ClimateDepot.com publisher Marc Morano argues mainstream media is skewing temperature data to make it an issue on climate change on ‘Varney & Co.’
Fox Business – Varney & Co. – Broadcast July 19, 2023
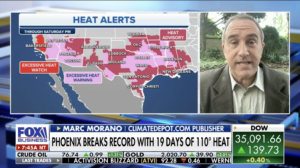
Stuart Varney: Marc Morano from the Climate Depot joins me now. We just heard in Phoenix, they had 19 straight days above 110 degrees. Now, wait, you’re a climate skeptic, is this not the result of climate change?
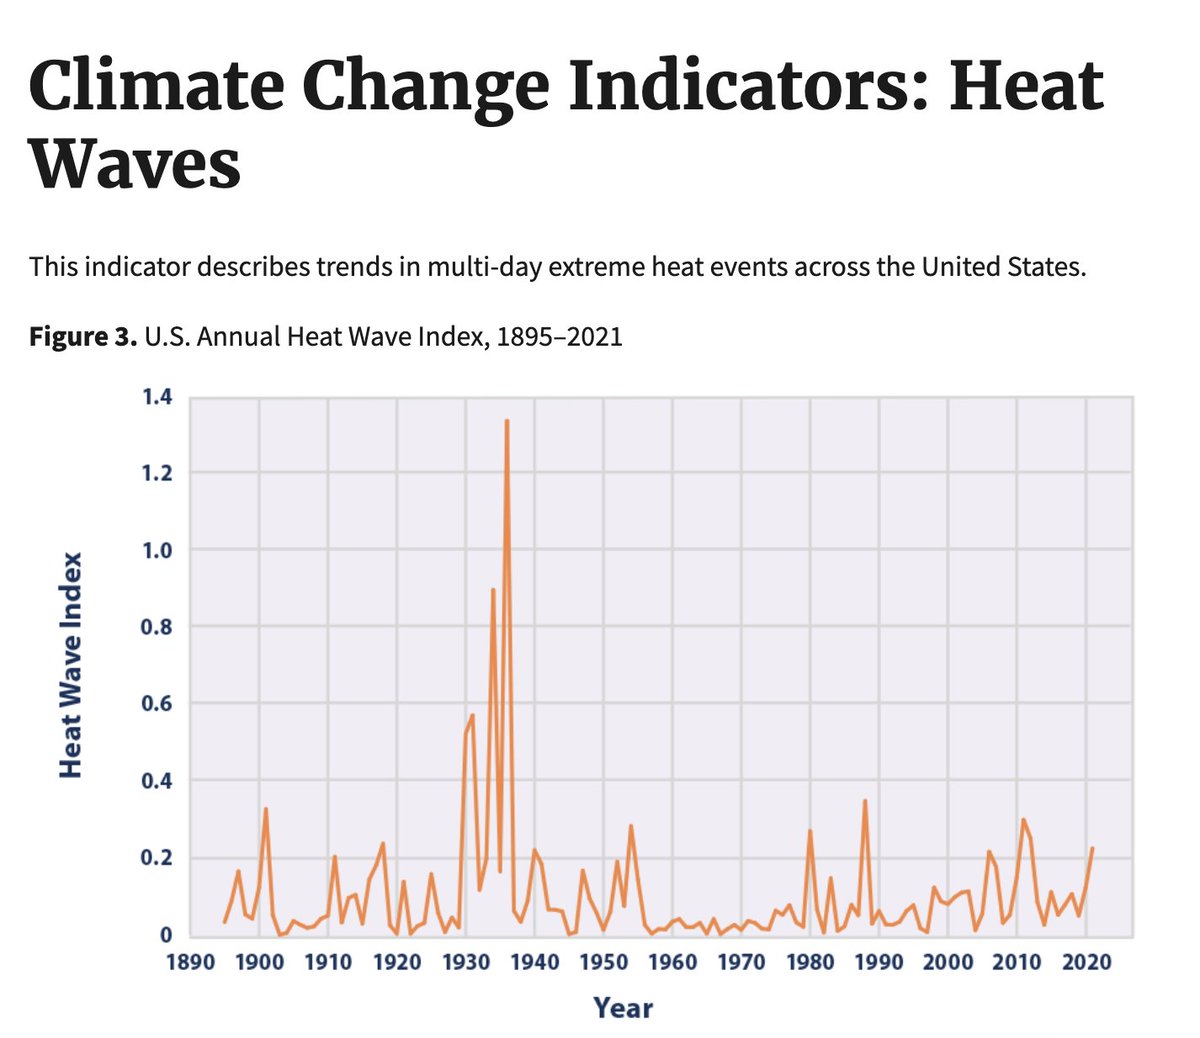
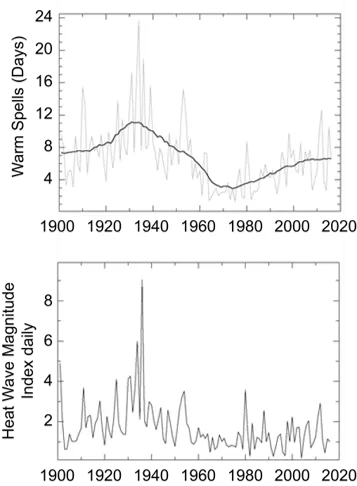
Marc Morano: “This is not outside the normal bounds of hot summer weather. Yes, it’s a record year. It could be one of the hottest, but here’s the thing. Joe Biden’s EPA has a chart of the heatwave index going back to the 1930s. The 1930s are probably 8 to 10 or 12 times hotter in the United States than anything we’re currently seeing.
75% of all state temperature records were broken before the 1950s — these records still stand. Now. This is a way that statistics — when you heard things like CNN or New York Times or others have said this is the ‘hottest’ in Earth’s history. Those claims were based on climate models, which even the NOAA –National Oceanic Atmospheric Administration — backed away from. They are weaponizing hot summers, heat waves to turn it into some kind of call for climate action. This is not outside the bounds of normal weather, I’m sorry.
Stuart Varney: Wait a second. What are you telling me that this extraordinary weather which has been prevalent around the world, you’re telling me that that is not the result of CO2 emissions?
Marc Morano: “It possibly could have impacted the temperatures, absolutely. But keep in mind thermometer data went on in about the 1880s and we were coming out of a Little Ice Age. Now hold on. The 1930s is what Biden’s EPA shows is the hottest heat waves in the US. 80% of our carbon dioxide globally came after World War Two — after 1940. So to blame the 1930s on climate change when there were worse heat waves doesn’t add up here.
Stuart Varney: Marc. You’re losing me here. Look. How many days is it straight in Phoenix? What is it, 19 straight days above 110 degrees? There’s nothing like that in the 1930s.
Marc Morano: Absolutely, you can go back and look. 1936 was the hottest year, according to this EPA data
.
Now hold on. When you’re looking at these, you’re anecdotally picking a city, Stuart. This is what they do. They can do this with floods, droughts. Meanwhile, even the UN acknowledges all this extreme weather is either declining or no trend on climate timescales, 50 to 100 years. Any weather event you can get and say ‘Look at this city here’ or ‘Look at this area of California. This is unprecedented drought, this is climate change.’ You want to look at it globally. And if you look at it globally, in the first United Nations report in 1990, it had that Medieval Warm Period much warmer than today.
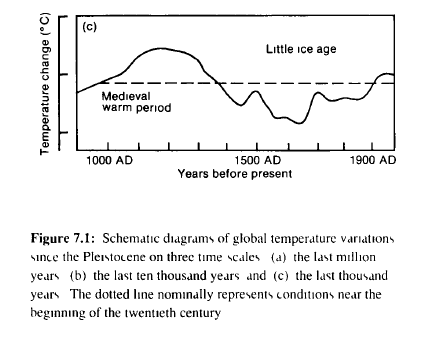
They then later said quote, ‘We have to get rid of the Medieval Warm Period.’ So they altered data, cooled the past, and erased it. There is now an effort, Stuart, led by a scientist in Texas, Andrew Dessler, who wants to get rid of the 1930s EPA chart because it has the same problem. You can’t blame today’s heat waves on CO2 when heat waves were worse in the United States before 80% of our CO2 went into the atmosphere. Sorry…
Stuart Varney: It’s a good debate. This is a very good debate. And I’m glad you’re on the show to make it. That’s a good point.
Marc Morano: One last thing…
Stuart Varney: I’m terribly sorry. I’m out of time. I’m very sorry. I’m out of time. We’ll bring you back again. It’s a good debate, and I want more of it. Marc Morano.
#
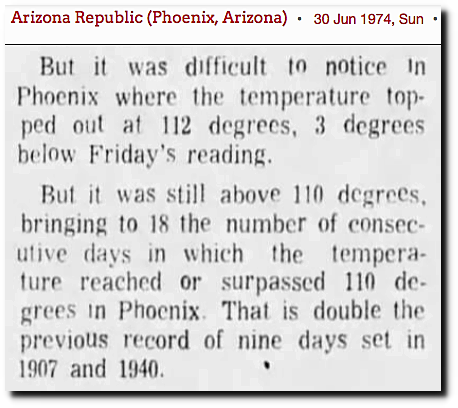
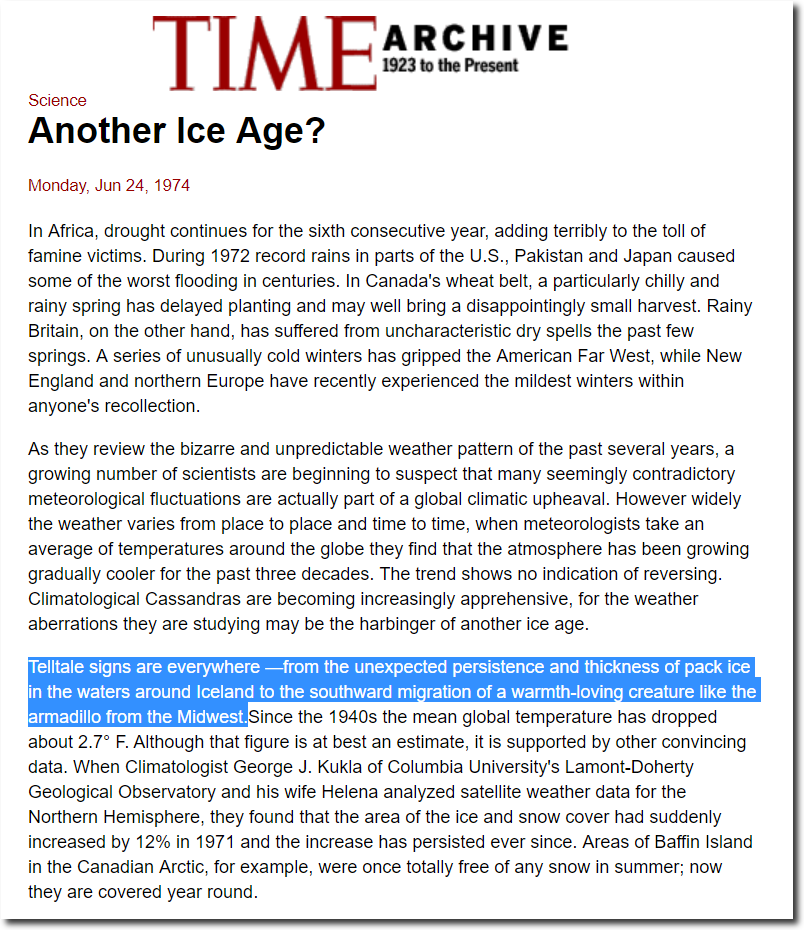
Phoenix previous record of 18 consecutive days over 110F was set the same week Time Magazine was warning of new ice age.
30 Jun 1974, Page 31 – Arizona Republic at Newspapers.com
TIME Magazine Archive Article — Another Ice Age? — Jun. 24, 1974
#
The press is full of hysterical stories about high nighttime temperatures in Phoenix caused by "climate change" The #ClimateScam is based on junk science and misinformation – and when called out they project their malfeasance on to others.https://t.co/jg7KLkPzFu https://t.co/7DCVVsGUEu pic.twitter.com/8Nay7gAuaZ
— Tony Heller (@TonyClimate) July 19, 2023
Most of the US is having one of the least hot summers on record. Compare vs. 1936. Your #ClimateScam propaganda is getting increasingly ridiculous.https://t.co/GFVWbBo1w9 pic.twitter.com/0u5pxvjopf
— Tony Heller (@TonyClimate) July 19, 2023
Phoenix previous record of 18 consecutive days over 110F was set in 1974 – during the same week the press was warning of a new ice age. Your #ClimateScam propaganda is shameless.https://t.co/vlXfuBbrs0 pic.twitter.com/qCBc2uYt12
— Tony Heller (@TonyClimate) July 19, 2023
Maricopa County (where Phoenix is located) is the fastest growing county in the US. Nobody believes your #ClimateScam propaganda. https://t.co/4d3UD4RWXA. pic.twitter.com/wWxbwDAzXj
— Tony Heller (@TonyClimate) July 19, 2023
The 1930s were much hotter than any recent years. The #ClimateScam can't exist without fake statistics. pic.twitter.com/I02BQjwO9h
— Tony Heller (@TonyClimate) July 19, 2023
Phoenix has a wonderful climate most of the year and people flock there from all over the world. Since air conditioning came into widespread usage during the 1950's, the population has increased 6,000%https://t.co/Oomg7Vh4Xu. pic.twitter.com/ZIkGdp9p7Y
— Tony Heller (@TonyClimate) July 19, 2023
According CBS news, surpassing a previous record by one day is "shattering" it.#ClimateScam https://t.co/nLOz4SY1nY
— Tony Heller (@TonyClimate) July 20, 2023
10,000 stations times 100 days means 1,000,000 opportunities to break a record. The odds of breaking a daily temperature record at each station on each day is 100:1 – so about 10,000 records would be set during the summer.
I used to be a high school teacher and am very patient https://t.co/qbSAoreoVI— Tony Heller (@TonyClimate) July 20, 2023
The percent of the US to reach 95F (35C) this year continues at a record low 36%, down from 93% in 1931#ClimateScam
ftp://ftp.ncdc.noaa.gov/pub/data/ghcn/daily/ghcnd_hcn.tar.gz pic.twitter.com/0CMyKATltt
— Tony Heller (@TonyClimate) July 20, 2023
The five hottest July 20ths in the US were 1934, 1901, 1930, 1932 and 1925, when close to half of the country was over 95F (35C.) Recent years have been closer to one-fifth#ClimateScam pic.twitter.com/8SxCaAyZ0B
— Tony Heller (@TonyClimate) July 20, 2023
Here we go again. The claimed unprecedented ‘hottest day’ record was given an asterisk – but only after the unsupportable claim achieved its goal of weaponizing the weather in support of the climate agenda.
Morano on media & climate activists’ heatwave hysteria:
“What is happening is very similar to how COVID ‘case counts’ were used to justify all sorts of government restrictions, from school closures to mask mandates to lockdowns during the peak of Covid. They pick a statistically arbitrary data point – ‘case counts’ during COVID — and average global temperature statistics in climate – – and widely overstate their significance to push policy positions they could never otherwise justify. As one epidemiologist said of using COVID ‘case counts’ to push mask mandates, “That is like tying masking to the phases of the moon.” https://twitter.com/VPrasadMDMPH/status/1494108544173412352…
Pushing government climate regulations based on global average temperatures or a heatwave is just as unscientific. They get a hot summer and try to weaponize it with average global temperature statistics to scare people into submitting to more climate regulations.
Biden’s EPA shows the 1930s heat waves were much, much worse in the US than in recent times. We also know that many studies and data reveal that the Roman Warming Period and the Medieval Warm Period were as warm or warmer than today. Even the United Nations acknowledged that in their first climate report in 1990 before they later altered the data and erased the Medieval Warm Period.
See new Tweets
Conversation
Tony Heller
@TonyClimate
So far this year, just over one-third of the US has reached 95F (35C) – down from 93% of the US in 1931. US summers are much cooler now than they used to be.
rogerpielkejr.substack.com/p/
During the past 50 years, when heat waves have increased, mortality from extreme heat has fallen pretty much everywhere in the US
rogerpielkejr.substack.com/p/
Let’s keep it up
Media Chases ‘Climate Enhanced’ Heat Waves, Misses Data Showing They are Less Frequent
None of the news outlets running heat wave stories this week examined or cites historical data on heat waves, preferring instead to push scary numbers in the form of heat indexes that combine temperature and humidity, reprint the opinion of “climate scientists,” and reference computer models that suggest climate change is making heat waves worse.
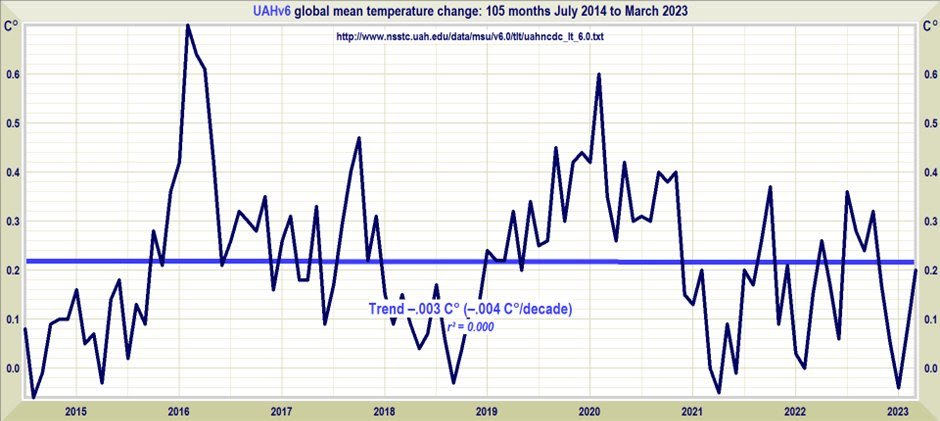
On Thursday, the National Oceanic and Atmospheric Administration distanced itself from the designation, compiled by the University of Maine’s Climate Reanalyzer, which uses satellite data and computer simulations to measure the world’s condition. That metric showed that Earth’s average temperature on Wednesday remained at an unofficial record high, 62.9 degrees Fahrenheit (17.18 degrees Celsius), set the day before.
The AP updated its story on July 7th to include this single yet very important paragraph:
NOAA, whose figures are considered the gold standard in climate data, said in a statement Thursday that it cannot validate the unofficial numbers. It noted that the reanalyzer uses model output data, which it called “not suitable” as substitutes for actual temperatures and climate records. The agency monitors global temperatures and records on a monthly and an annual basis, not daily.
So, in the space of two days, we went from temperature data that was “[t]otally unprecedented and terrifying,” to temperature data that was not suitable for purpose.
Although, on July 8, the University of Maine’s Climate Reanalyzer website was forced to put up this notice on their global temperature page:
But even that claim is false, because in fact the NCEP CFSv2 used by Climate Reanalyzer and listed at the top of their graph, is in fact defined as a model according to its developer, NOAA:
Some have asked about 1936.
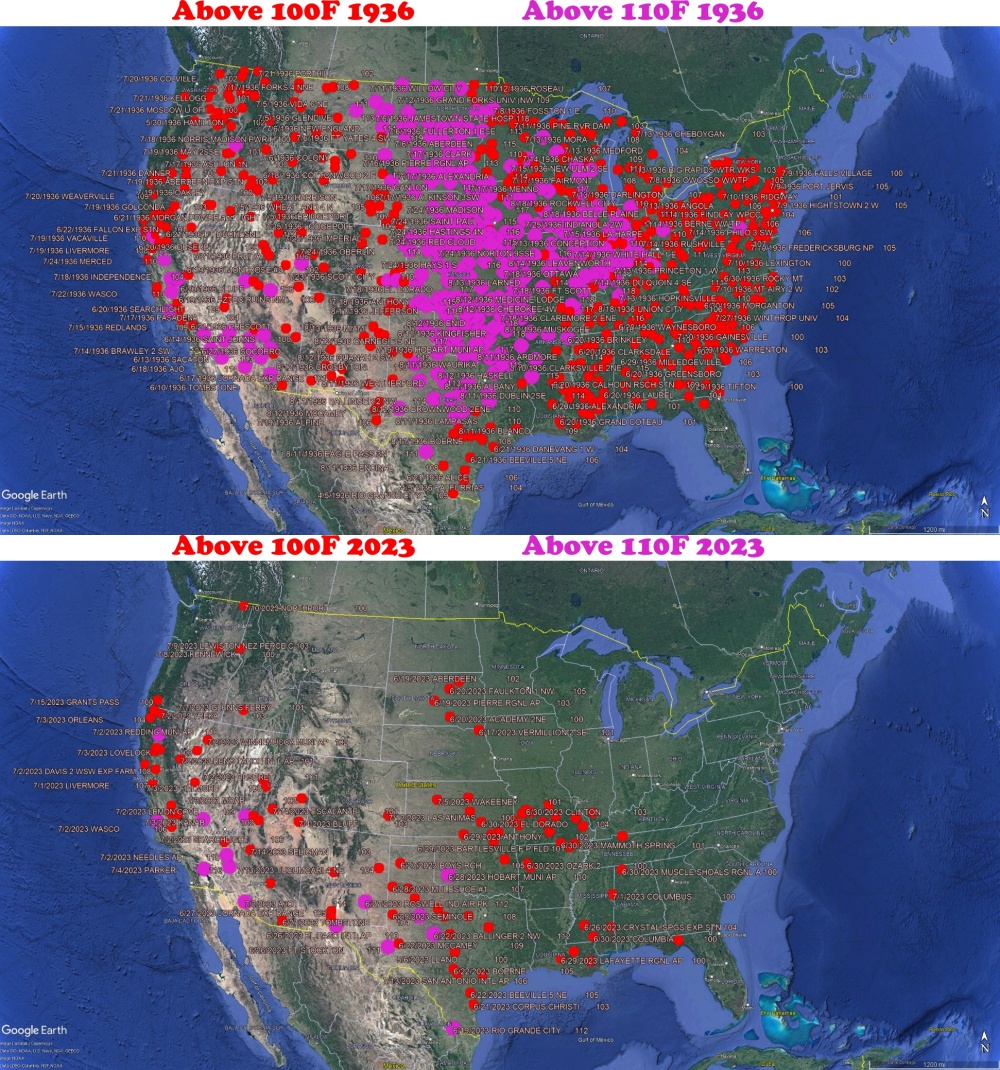
Here's the map for July 16, 1936. It was 5°F hotter on average across 48 states, but that was due to Dust Bowl.
The heat now is caused by climate change, which is different and more dangerous.
So, don't get hung up on the numbers.
27.3%… pic.twitter.com/vPvtFVe3q1
— Ryan Maue (@RyanMaue) July 16, 2023
USA Heatwave reality check: Global temps below 30-year avg & ‘75% of the states recorded their hottest temperature prior to 1955’ – Worst U.S. heat waves happened in 1930s
Heatwaves?! Book reveals ‘75% of the U.S. states recorded their hottest temperature prior to 1955’
Even the U.S. Federal government reveals this Inconvenient temperature history.
NOAA features temperature chart showing Earth’s history much hotter than today – Past temps ‘Much too warm for ice sheets or perennial sea ice’ | Climate Depot – https://t.co/Bya0S1bYGX https://t.co/8gmyOSMhra pic.twitter.com/bUkqtIVgDE
— Marc Morano (@ClimateDepot) July 8, 2023
Watch: Fox host Stuart Varney challenges Morano over heatwave-climate link
Media Chases ‘Climate Enhanced’ Heat Waves, Misses Data Showing They are Less Frequent
#
Meteorologist Anthony Watts: On July 3rd and 4th and the following days, multiple mainstream media outlets ran stories claiming that the Earth had experienced an unprecedented hot day(s). This is false. The data they cited was not official data, but from a private website and investigation shows the claim was a gross error.
Forbes: July 4 Was Earth’s Hottest Day In Over 100000 Years
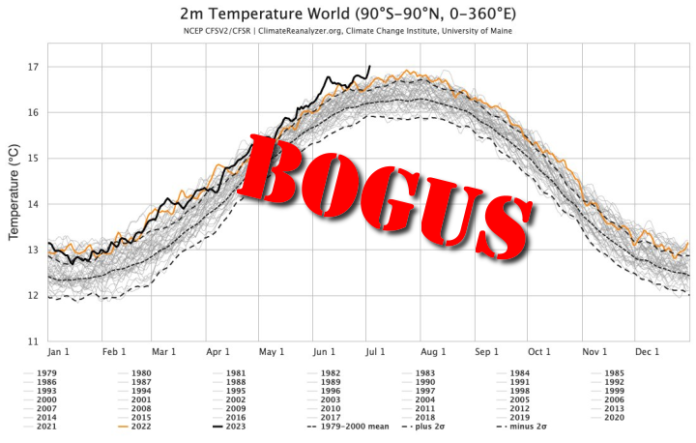
Apparently, all those people missed the fact that they were looking at the output of a climate model, not actually measured temperatures. Only one news outlet, The Associated Press, bothered to print a sensible caveat…The National Oceanic and Atmospheric Administration distanced itself from the designation, compiled by the University of Maine’s Climate Reanalyzer, which uses satellite data and computer simulations to measure the world’s condition….
The AP updated its story on July 7th to include this single yet very important paragraph: “NOAA, whose figures are considered the gold standard in climate data, said in a statement Thursday that it cannot validate the unofficial numbers. It noted that the reanalyzer uses model output data, which it called ‘not suitable’ as substitutes for actual temperatures and climate records. The agency monitors global temperatures and records on a monthly and an annual basis, not daily.”
So, in the space of two days, we went from temperature data that was “[t]otally unprecedented and terrifying,” to temperature data that was not suitable for purpose.

