
“No accelerating sea level rise”… “no correlation between CO2 concentrations in the atmosphere and sea level rise”.
First appearing at CFACT.
We have been studying climate change and potentially associated sea level changes resulting from melting ice and warming oceans for a half century. In the 1970s our primary concern was global cooling and an advancing new ice age. Many believe that increasing quantities of carbon dioxide in our atmosphere could result in rising levels of the sea in general. The record does not show this to be true. There is no evidence whatever to support impending sea-level-rise catastrophe or the unnecessary expenditure of state or federal tax monies to solve a problem that does not exist.
The National Oceanographic and Atmospheric Administration (NOAA) has updated its coastal sea level tide gauge data which continue to show no evidence of accelerating sea level rise. These measurements include tide gauge data at coastal locations along the West Coast, East Coast, Gulf Coast, Pacific Ocean, Atlantic Ocean and the Gulf of Mexico, as well as seven Pacific Island groups and six Atlantic Island groups, comprising more than 200 measurement stations.
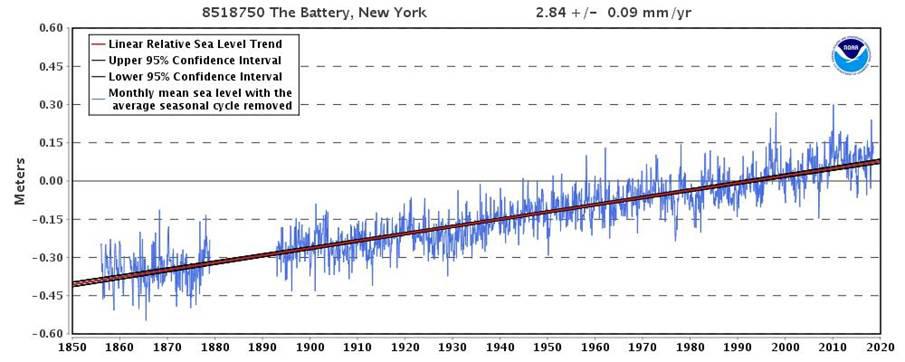
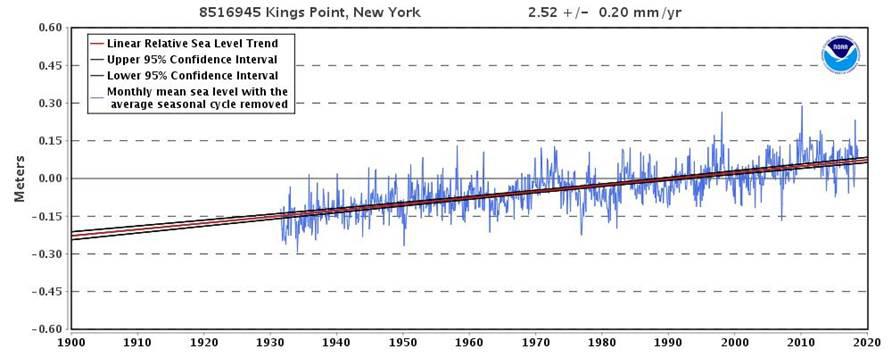
The longest NOAA tide gauge record on coastal sea level rise measurements is in New York at the Battery, with its 160-year record which is shown below with a steady rate of sea level rise of 11 inches per century. A slightly slower rate of sea level rise occurs at nearby Kings Point, New York, whose 80-year record also appears below.
Tidal gauges at the Battery and Kings Point show sea level rising at a pace of 11 inches per century. Both locations show a steady pace of increase, with the same pace of increase holding steady despite periods of relatively rapid temperatures increase and periods of cooling. The Battery measurements date back to 1855, showing the same pace of sea level rise well before the existence of coal power plants and SUVs.
NOAA data provide assessments with a 95% confidence level at all measured locations which demonstrate the consistent behavior of location-specific sea level rise over time. The 2016 updated NOAA tide gauge data include four long-term periods between 92 and 119 years for California coastal locations at San Diego, La Jolla, Los Angeles and San Francisco. The actual measured steady rates of sea level rise at these locations vary between four inches and nine inches per century.
In contrast to the steady but modest rise in sea level, revealed in long-term measurements, the United Nations Intergovernmental Panel on Climate Change (IPCC) speculates that sea level will almost immediately begin rising significantly more than in the past and present. NOAA records contradict such claims. This pattern of steady but modest sea level rise extends throughout the world, throughout times of increasing atmospheric carbon dioxide concentrations, and throughout periods of accelerated warming and cooling.
The IPCC and global warming activists have a difficult time scientifically supporting speculation about accelerating sea level rise, as warming temperatures have yet to push sea level rise beyond one foot per century. Current sea level trends are not significantly different from what they were seven to nine decades ago, when atmospheric CO2 levels were 310 parts per million by volume (ppmv) or less.[1] Dire predictions made decades ago of dramatically accelerating polar ice loss, and an ice-free Arctic Ocean have not come to pass.[2] As Dr. Steven E. Koonin, former Undersecretary for Science for the Obama administration, noted in 2014, “Even though the human influence on climate was much smaller in the past, the models do not account for the fact that the rate of global sea-level rise 70 years ago was as large as what we observe today.”[3]
Fortunately, we don’t need to wonder who is right and who is wrong in the debate over future sea-level rise. We can test the rising-seas hypothesis with real data collected from 10 coastal cities with long and reliable sea level records. Those cities are Ceuta, Spain; Honolulu, Hawaii; Atlantic City, New Jersey; Sitka, Alaska; Port Isabel, Texas; St. Petersburg, Florida; Fernandina Beach, Florida; Mumbai/Bombay, India; Sydney, Australia; and Slipshavn, Denmark.
We can test the rising-sea hypothesis with real data collected from ten coastal cities with long and reliable sea-level records.
The cities appear on the map below along with the data for each city presented on separate graphs below. The graphs include the following elements:
▪ CO2 concentrations measured in the atmosphere over the past century, signified by the green lines in the graphs. (This line is the same in all the graphs.)
▪ Monthly mean sea-level data for each city, signified by the blue lines, and
▪ The “linear fit,” signified by the red line, representing the best estimate of past and future average sea levels. We also include the 95% Prediction Intervals.
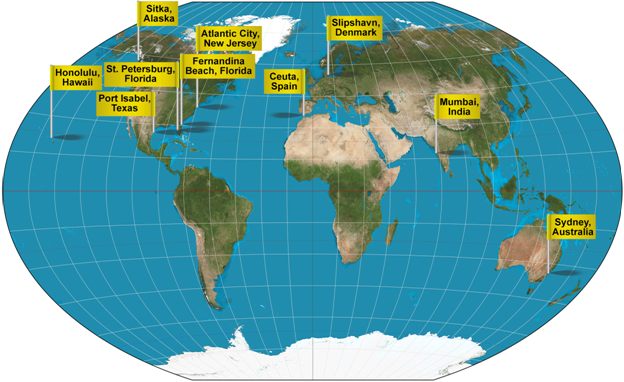
Source: https://en.wikipedia.org/wiki/World_map, modified.
Example 1: Ceuta, Spain – Mediterranean Sea
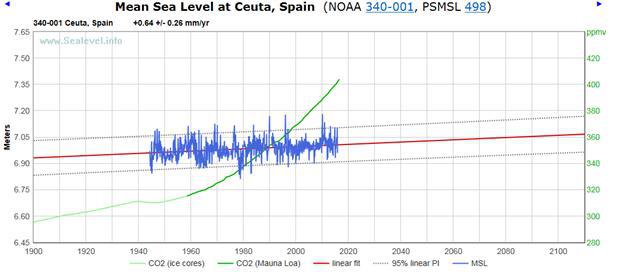
The Ceuta, Spain data show about as flat a trend as we can observe. Most notably, the data show no correlation between CO2 concentration and sea-level rise. If the current trend continues for the next century, sea level in Ceuta will rise only three inches. This is in sharp contrast to the 10-foot global rise in sea levels recently projected by former NASA scientist James Hansen.[5]
Example 2: Honolulu, Hawaii – Pacific Ocean
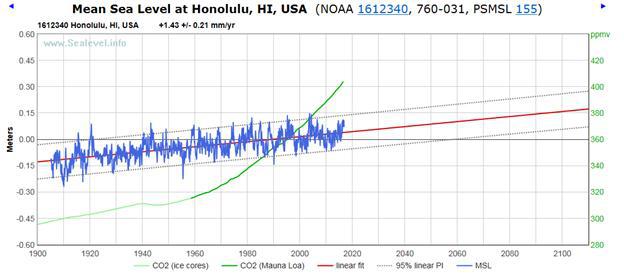
Hawaii, like some other regions, can see significant year-to-year fluctuations in sea level because of global oceanic currents or local plate tectonic movements. However, Honolulu has seen an average sea-level rise of only 5.6 inches since 1900. The sea level around Honolulu is projected to rise a mere 5.6 inches in the next 100 years, once again with no correlation to CO2 levels.
Example 3: Atlantic City, New Jersey – Atlantic Ocean
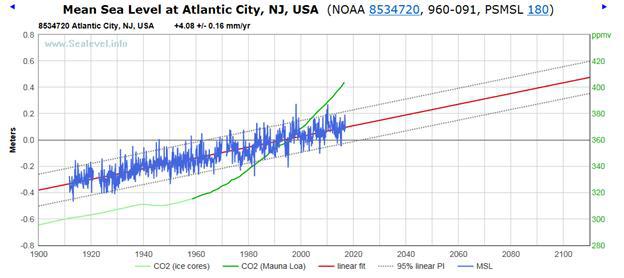
Atlantic City represents one of the more significant upward trends. The average sea level there has risen about 16 inches in the past 100 years. Notice, however, the spike at 1998, when the El Niño event took place in the Pacific Ocean, and then the subsequent drop in sea level that persisted for the next five years. Obviously, factors other than CO2 levels were responsible for both the spike and the drop.
Example 4: Sitka, Alaska – Northern Pacific Ocean
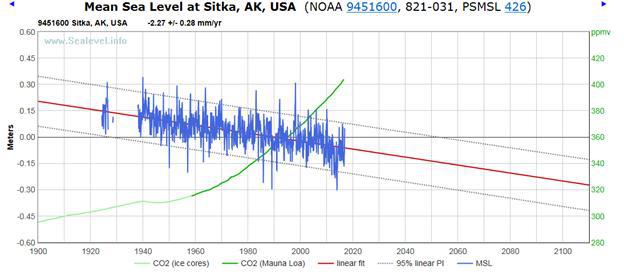
The sea level trend in Sitka, Alaska has been downward, not upward. If the rate of change continues, sea level will fall nine inches over the next 100 years. Note Sitka is only about 100 miles from Glacier Bay and 200 miles from the Hubbard Glacier on Disenchantment Bay. If melting glaciers were causing sea levels to rise, one might expect to see it in Alaska.
Example 5: Port Isabel, Texas – Western Gulf of Mexico
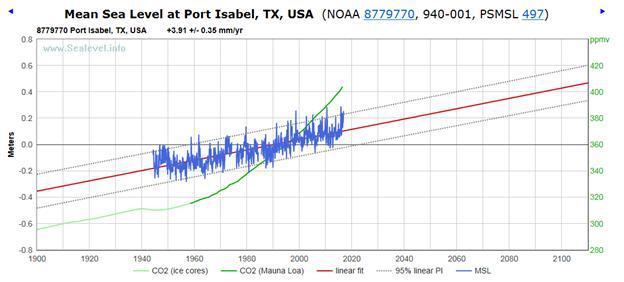
Port Isabel, Texas shows an upwardly inclined sea level trend, although the record reaches only as far back as 1944. If the current trend continues, sea level will rise 15.4 inches over the next 100 years.
Example 6: St. Petersburg, Florida – Eastern Gulf of Mexico
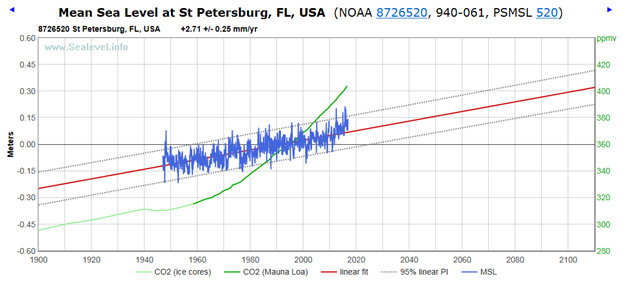
At St. Petersburg, on the other side of the Gulf of Mexico from Port Isabel, Texas, sea level is also rising but more slowly. Once again, the record is shorter than other sites, dating back only to 1947. Here, the projected sea-level rise is only 10.7 inches over the next 100 years.
Example 7: Fernandina Beach, Florida – Atlantic Ocean
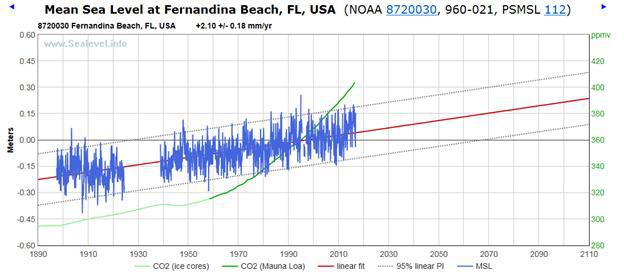
On the opposite side of Florida from St. Petersburg, the Fernandina Beach sea level rise is projected at only 8.3 inches over the next 100 years. Miami Beach officials have been formulating policies to combat a rising ocean, even though the data for that area are spotty and incomplete. The real problem might well be land subsidence, which is unrelated to CO2 concentrations. Miami officials would do better to consider the possible impact of heavy infrastructure concentrated along the coastline, built upon former swampland.[6]
Example 8: Mumbai/Bombay, India – Indian Ocean
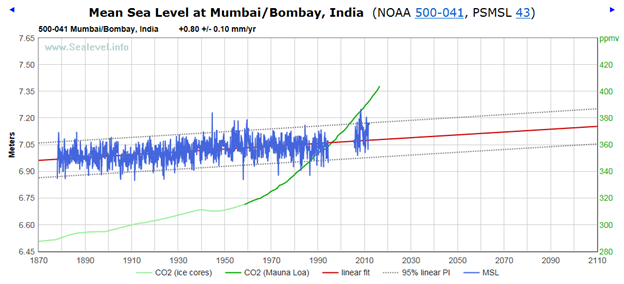
Reliable sea level records at Mumbai/Bombay, India, stretch back to the 1870s. The slight upward trend in Mumbai/Bombay means if current trends continue, sea level there will rise a mere 3.12 inches in the next 100 years. If melting Himalayan glaciers were causing sea level to rise, one might expect to see that reflected in the tidal gauges of Mumbai/Bombay.[7]
Example 9: Sydney, Australia – Pacific Ocean
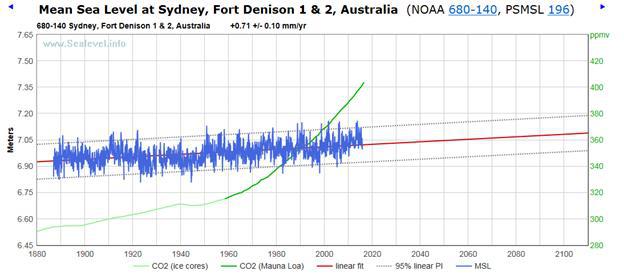
Australia has taken drastic measures to mitigate perceived CO2 issues, and the people of that country have suffered significant electricity blackouts in the past year. The shift from reliable coal-fired power plants to unreliable renewable energy has raised electricity rates in Australia to among the highest in the world.[8] Estimated sea-level rise over the next 100 years: 2.76 inches.
Example 10: Slipshavn, Denmark – North Sea
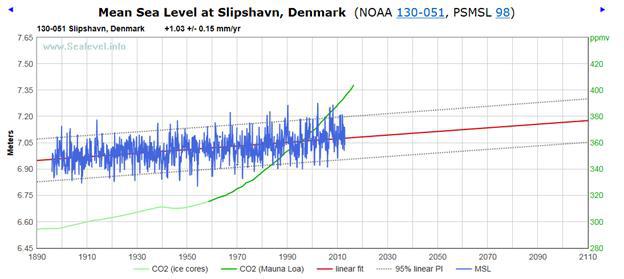
Slipshavn is unique in that it is situated in what is believed to be one of the most geologically/ tectonically inert regions on Earth. Unlike regions such as Alaska, where many land areas are rising, or the Gulf of Mexico, where some areas are subsiding, Slipshavn is tectonically very stable. If sea-level trends over the past 100 years remain constant, and on the basis of the data above, there is no reason to expect anything different in the near future. Sea level at Slipshavn should rise by a mere 3.6 inches over the next 100 years.
Analysis
The data and projected trends for these ten well-documented coastal cities point to three conclusions:
-
There has been no dramatic sea level rise in the past century, and projections show no dramatic rise is likely to occur in the coming century.
-
There is no evidence to indicate the rate of sea level rise or fall in any of the areas of this study will be substantially different than has been the case over the past many decades.
-
There is no correlation between CO2 concentrations in the atmosphere and sea level rise. The steady but modest rise in sea level predated coal power plants and SUVs, and has continued at its same pace even as atmospheric CO2 concentrations rose from 280 parts per million to 420 parts per million today .[9]
Survey from three sources:
1958–present data are from measurements at the Mauna Loa Observatory in Hawaii, at 3,400 meters altitude in the Northern subtropics.[10]
1850–1958 data are from ice core data.[11]
1800–1850 CO2 data are from a different ice core data set.[12]
Sea-level measurements for the ten coastal city graphs represent monthly data points compiled from the National Oceanic and Atmospheric Administration (NOAA) and the Permanent Service for Mean Sea Level (PSMSL), based in Britain. The database from which the graphs are drawn consists of data from 375 long-record tide-gauges around the globe, selected by NOAA for trend analysis.[13]
Sea levels vary widely across the globe. Values for the initial levels in the graphs refer to Mean Sea Level (MSL) data, established by the NOAA Center for Operational Oceanographic Products and Services (NOAA-CO-OPS).
REFERENCES:
[1] Patrick J. Michaels, “2016 Record Warm Surface Temperatures: The Party’s Over!” Cato at Liberty, August 10, 2017.
[2] Douglas Stanglin, “Gore: Polar Ice Cap May Disappear By Summer 2014,” USA Today, December 14, 2009.
[3] Steven E. Koonin, “Climate Science Is Not Settled,” The Wall Street Journal, September 19, 2014.
[5] Brian Clark Howard, “Prediction of Rapid Sea Level Rise Won’t Change Global Climate Talks,” National Geographic, July 21, 2015.
[6] Simone Fiaschi and Shimon Wdowinski, “The Contribution of Land Subsidence to the Increasing Coastal Flooding Hazard in Miami Beach,” Miami, FL: Rosenstiel School of Marine and Atmospheric Science, no date.
[7] James Lamont, “Himalayan Glaciers Melting Fast, Says Nepal,” Financial Times, September 1, 2009.
[8] Ian Plimer, The Climate Change Delusion and the Great Electricity Ripoff (Redland Bay, Queensland: Connor Court Publishing, 2017).
[9] Nils-Axel Mörner, “Sea Level Manipulation,” International Journal of Engineering Science Invention 6 (August 2017): 48–51. ISSN (Online): 2319 – 6734, ISSN (Print): 2319 – 6726; Albert Parker and Clifford D. Ollier, “California Sea Level Rise: Evidence Based Forecasts vs. Model Predictions,” Ocean & Coastal Management, July 2017.
[10] National Oceanic and Atmospheric Administration, Earth System Research Laboratory Global Monitoring Division, data set from ftp://aftp.cmdl.noaa.gov/products/trends/co2/co2_annmean_mlo.txt and ftp://aftp.cmdl.noaa.gov/products/trends/co2/co2_mm_mlo.txt .
[11] Data compiled by the NASA Goddard Institute for Space Studies.
[12] Law Dome Atmospheric CO2 Data, World Data Center for Paleoclimatology, and NOAA Paleoclimatology Program.
[13] Sources: National Oceanic and Atmospheric Administration, and the Permanent Service for Mean Sea Level, compiled at www.Sealevel.info.
