The One Oscillation That Rules Them All
By David Archibald
Cumulative graphs, in which changes in the individual values from time period to time period are added, are powerful for showing changes of trend in a series. Thus the cumulative graph of the annual average solar aa Index (a geomagnetic index) nails the beginning and end of the Modern Warm Period:
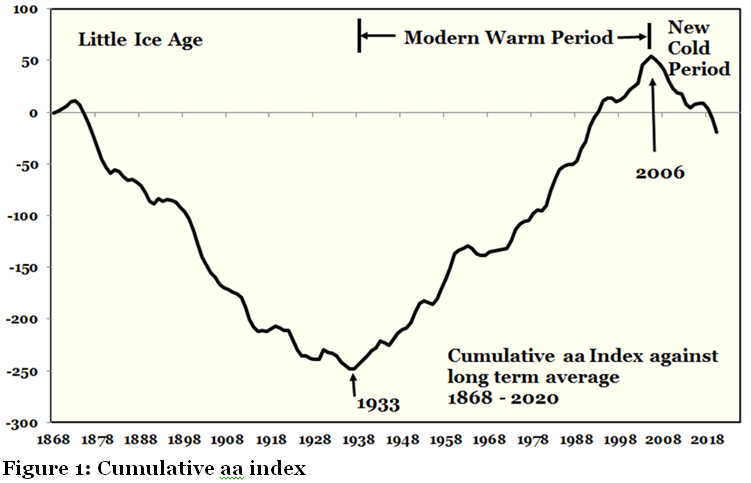
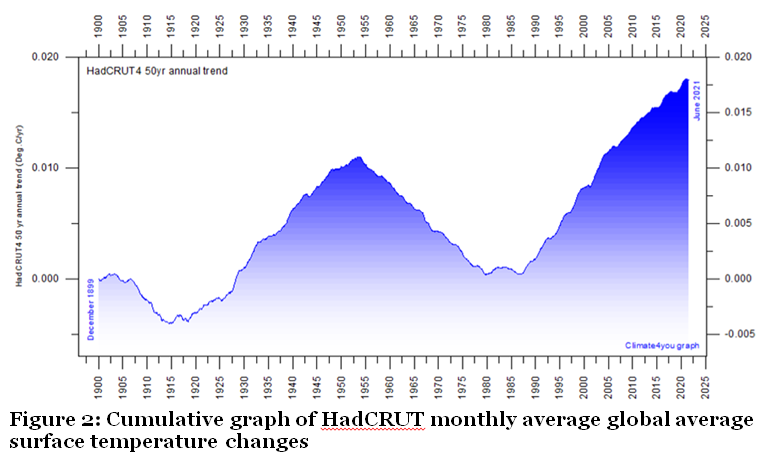
Professor Ole Humlum, based in Svalbard near the Arctic Circle, has a trove of climate data at his website Climate4you. This includes a graphic of the cumulative graphic technique applied to the HadCRUT series of monthly global average surface air temperatures. It is found half way down this page, entitled ‘Cyclic air temperature changes’.
The changes of trend evident have no apparent correlation with any solar data series including the solar cycles, both Hale and Schwabe. I was rereading a book I wrote in 2014 entitled Twilight of Abundance for a new polemic when I came across this paragraph on page 14:
Overprinted on long term solar-driven warming is the Pacific Decadal Oscillation (PDO) which produces large swings in climate. The PDO is a long-lived El Niño-like pattern of Pacific climate variability, though PDO events last for 20-to-30 years, while typical El Nino events persisted for only 6 to 18 months. Negative PDO regimes prevailed from 1890-1924 and again from 1947-1976, while “warm” or positive PDO regimes dominated from 1925-1946 and from 1976 through to 2008. Major changes in northeast Pacific marine ecosystems have been correlated with phase changes in the PDO; warm eras have higher coastal ocean biological productivity in Alaska and inhibited productivity off the west coast of the contiguous United States, while cold PDO eras have seen the opposite north-south pattern of marine ecosystem productivity. After 30 years in a warm phase, the PDO appears to have switched to a cool phase which could also last 30 years. “
The Pacific Decadal Oscillation was named by Nathan Mantua and his co-authors of their paper: A Pacific Interdecadal Climate Oscillation with Impacts on Salmon Production, who noticed it while studying salmon production patterns.
The Pacific Decadal Oscillation is detected as warm or cool surface waters in the Pacific Ocean, north of 20°N. Reversals in the distribution of warm versus cool water correspond with dramatic shifts in salmon production regimes in the North Pacific Ocean.
When the dates of the Pacific Decadal Oscillation are plotted on the graphic from Climate4you, the correlation is strong:
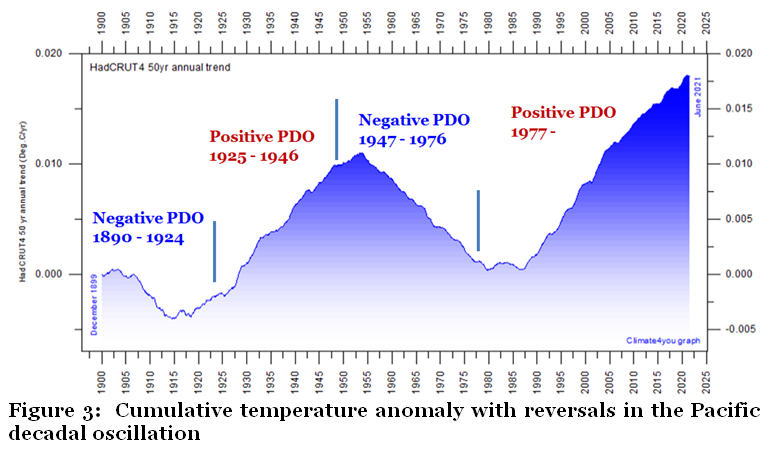
Given the noise from El Nino events and solar cycles, we have found the proximate cause for the major changes of temperature trend for the planet. Given the size of the North Pacific, you would not be surprised to find that it has a response at the planetary scale.
The satellites that measure the temperature of the atmospheric column were launched soon after the last reversal in the Pacific Decadal Oscillation. The significance of Figure 3 is that the apparent global warming over the last 40 years, that has been studied in great detail, that has caused great angst, is likely to be just an artefact of the phase of the Pacific decadal oscillation. Now that is sorted, can we all go home now?
Salmon production is not the only thing controlled by the state of the Pacific decadal oscillation. The greens and ecoloons had been predicting a new ice age right up to the 1976 Pacific Climate Shift. With the change of the Pacific decadal oscillation in that year they flipped to predicting warming instead.
There is still the potential for a scary scenario out of this. At 44 years long, the current positive phase of the Pacific decadal oscillation is long in the tooth and should be reversing soon of its own accord. This will coincide with the rapid drop in solar activity underway, speeding up the cooling process. The appropriate cultural reference is from the movie Aliens: “We’re on an express elevator to hell. Going down.”
Solar Cycle 25 is shaping up as being half the amplitude of 24. This is supported by the divergence in their UV output as shown by this graph from the University of Bremen:
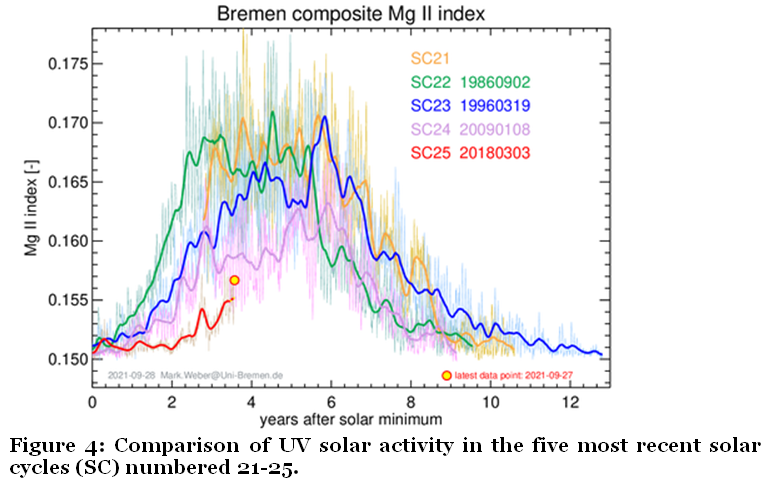
The thick curves show the Mg II index time series twice smoothed with a 55-day boxcar. Dates of minima of solar cycles were determined from the smoothed Mg II index.
On top of all that, the last volcanic eruption big enough to have an effect on the Earth’s climate was Mt Pinatubo in 1991, now 30 years ago. Volcanic eruptions of that magnitude occur at an average of 40 years apart, so we are coming due for one on average. The combination of a major volcanic eruption overprinted on a deep solar minimum is the setup like that of the ‘Year Without A Summer’ – 1816 when the Mt Tambora eruption overprinted the Dalton Minimum. In 1816 the oats price in the northeastern US went from 10 cents a bushel to 90 cents a bushel. Oats were what horses ran on and were the equivalent of today’s diesel and gasoline.
On the subject of agricultural prices, world wheat stocks have fallen dramatically this year and are equal to the lowest levels of the stocks-to-consumption ratio this century. The setup just gets better and better.
==========================================
David Archibald is an Australian scientist and petroleum geologist. Among other books, he is the author of American Gripen: The Solution to the F-35 Nightmare