https://notalotofpeopleknowthat.wordpress.com/2020/03/16/polar-ice-loss-accelerating-factcheck/
By Paul Homewood
Earth’s great ice sheets, Greenland and Antarctica, are now losing mass six times faster than they were in the 1990s thanks to warming conditions.
A comprehensive review of satellite data acquired at both poles is unequivocal in its assessment of accelerating trends, say scientists.
Between them, Greenland and Antarctica lost 6.4 trillion tonnes of ice in the period from 1992 to 2017.
This was sufficient to push up global sea-levels by 17.8mm.
Of that combined 17.8mm contribution to sea-level rise, 10.6mm (60 %) was due to Greenland ice losses and 7.2mm (40%) was due to Antarctica.
The combined rate of ice loss for the pair was running at about 81 billion tonnes per year in the 1990s. By the 2010s, it had climbed to 475 billion tonnes per year.
According to the IPCC, its mid-range simulations (RCP4.5) suggested global sea-levels might rise by 53cm by 2100. But the Imbie team’s studies show that ice losses from Antarctica and Greenland are actually heading to much more pessimistic outcomes, and will likely add another 17cm to those end-of-century forecasts.
https://www.bbc.co.uk/news/science-environment-51846468`
#
Paul Homewood’s FACTCHECK
GREENLAND
According to the Danish Meteorological Institute (DMI), melting of the Greenland ice cap contributed about 0.6mm/yr to global sea level rise between 2003 and 2017 (Fig 1).
This rise has been largely at a constant rate, except between 2010 and 2012.
Figure 1 – Changes in the Greenland Ice Cap Mass
http://polarportal.dk/en/greenland/mass-and-height-change/
Most of the ice loss is the result of receding glacier fronts, but the DMI confirmed in Nov 2018 that glaciers have more or less maintained their area since 2012.(1)
There is therefore no evidence of accelerating ice loss since 2003.
The claim that the Greenland icecap has been losing ice at a faster rate than in the 1990s is true, but it is also a red herring and has no bearing on future rates of loss. In 2003, scientists reported that Greenland had cooled significantly between 1958 and 2001 (2).
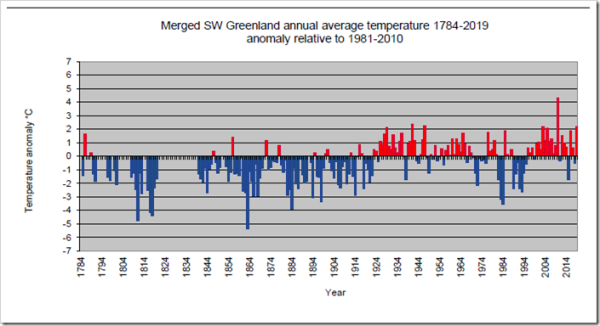
Unsurprisingly during this period of cooling ice loss slowed markedly. Since 2001, temperatures have recovered to levels generally seen in the 1930s and 40s (Fig 2), with a resultant increase in ice loss.
The rise and fall in Greenland temperatures is linked to natural cycles, including the Atlantic Multidecadal Oscillation, which runs on a 50 to 60 year pattern, meaning that a colder climate will likely return in the next decade or so.
Ice cores prove that Greenland was colder during the 19thC than any era since the end of the ice age. (4). It is therefore highly likely then that the Greenland icecap will continue to lose mass for the rest of this century at least.
However, it is extremely poor science to extrapolate future trends from only the upward part of a cycle. It is even worse when it is used to project accelerating trends.
Figure 2 – SW Greenland Temperature Anomalies
DMI (3)
ANTARCTIC
Far from ice loss increasing in the Antarctic, scientists cannot even agree whether the ice cap is even shrinking at all.
According to a recent NASA study, the ice sheet has actually been growing, with snowfall in East Antarctica exceeding ice loss in West Antarctica. (5).
The NASA study shows that Antarctica gained 82 billion tons of ice per year between 2003 and 2008.
SEA LEVEL
Ultimately of course we have tide gauges to tell us what is happening with sea levels, and the picture is consistently clear.
Globally, sea levels have been rising steadily at a rate of about 2mm a year since the late 19thC, with a slow down between the 1960s and 90s. And, as the IPCC’s latest Assessment Report pointed out, the recent rate of rise has been similar to that between 1920 and 1950. (6)
It is very likely that the mean rate of global averaged sea level rise was 1.7 [1.5 to 1.9] mm/yr between 1901 and 2010 and 3.2 [2.8 to 3.6] mm/yr between 1993 and 2010. Tide gauge and satellite altimeter data are consistent regarding the higher rate during the latter period. It is likely that similarly high rates occurred between 1920 and 1950.
IPCC AR5 (6)
Sea levels provide no evidence that the poles are losing ice at a faster rate than in the first half of the 20thC. They certainly do not support the theory that ice loss will significantly accelerate in the rest of the 21stC.
https://www.sciencedirect.com/science/article/pii/S0921818113002750?via%3Dihub
References
1) DMI – http://polarportal.dk/en/news/2018-season-report/
2) Hanna & Cappelen – http://news.bbc.co.uk/1/hi/sci/tech/2840137.stm
3) DMI – https://notalotofpeopleknowthat.files.wordpress.com/2020/02/dmirep20-04.pdf
4) Steffensen – https://vimeo.com/14366077
6) IPCC AR5 – https://ar5-syr.ipcc.ch/topic_observedchanges.php#node11


