

Reprinted from CCNET:
CCNet – 18 October 2012
The Climate Policy Network

This impressive piece of research makes a significant contribution to a growing body of evidence that both the global extent of the Medieval Warm Period, and the temperature was similar, or even greater than the Current Warm Period, even though the atmospheric CO2 concentrations today are some 40% greater than they were during the MWP. –David Whitehouse, The Global Warming Policy Foundation, 17 October 2012
Now another paper, by Esper et al published in the Journal of Global and Planetary Change, shows that not only was the summers of the Medieval Warm Period equal or greater than our current warmth, but that the summers of the Roman Warm Period of 2000 years ago was significantly warmer than today. –Anthony Watts, Watts Up With That, 18 October 2012
We here present a 2000-year summer temperature reconstruction from northern Scandinavia and compare this timeseries with existing proxy records to assess the range of reconstructed temperatures at a regional scale. The new reconstruction is based on 578 maximum latewood density profiles from living and sub-fossil Pinus sylvestris samples from northern Sweden and Finland. The record provides evidence for substantial warmth during Roman and Medieval times, larger in extent and longer in duration than 20th century warmth. –Jan Esper et al, Global and Planetary Change 88–89 (2012) 1–9
Ice sheets retreating due to global warming often suddenly stabilise for “decades to centuries” no matter that the warming is still going on, scientists have found. It would seem that current predictions of sea level rises to be expected on a given timescale with a given amount of global warming will need to be revised – downwards. As the most up-to-date predictions are not very alarming anyway, it could be that sea level rises just aren’t that big a worry, over say the next century anyway. –Lewis Page, The Register, 18 October 2012
An eminent scientist has criticised the leader of Cambridgeshire County Council for denying man’s role in global warming. However Cllr Clarke has won support from members of his party – who loudly cheered as he defended his position at the authority’s latest meeting. His blog posting on the subject drew on Met Office figures which showed there had been no discernible rise in global temperatures in the last 16 years. Pinned down at the meeting on whether he believed that man-made climate change existed, Cllr Clarke said he had “no idea”. —Cambridge News, 18 October 2012
1) David Whitehouse: Climate Warmer 1000 Years Ago – The Global Warming Policy Foundation, 17 October 2012
2) David Whitehouse: Atlantic Sea Surface Temperature As Warm In 1775 As Today – The Global Warming Policy Foundation, 18 October 2012
3) Yet another paper demonstrates warmer temperatures 1000 years ago and even 2000 years ago – Watts Up With That, 18 October 2012
4) What Does This Temperature Graph Tell Us? – CO2 Science Magazine, 3 October 2012
5) Ice Sheets May Stabilise For Centuries, Regardless Of Warming – The Register, 18 October 2012
6) UK Government May Review Flawed Stern Review – House of Lords, 15 October 2012
7) And Finally: Global Warming Expert Attacks ‘Unhelpful’ Blogger – Cambridge News, 18 October 2012
1) David Whitehouse: Climate Warmer 1000 Years Ago
The Global Warming Policy Foundation, 17 October 2012
A new paper, looking back at the climate of the past two thousand years, published in the journal “Climate of the Past,” will either cause something of a stir, or provide confirmation of what some regard as having already emerged from the peer-reviewed scientific literature. The title of the paper is, “The extra-tropical Northern Hemisphere temperature in the last two millennia: reconstructions of low-frequency variability,” by B Christiansen of the Danish Meteorological Institute and F C Ljungqvist of Stockholm University. The link to the journal is here, and the paper can be read in its entirety here.
The climate of the past few hundred years is of clear importance because it allows scientists to put today’s warm period into context, and provides some evidence of the influence of the quantity of greenhouse gasses that mankind has injected into the atmosphere. In much literature and during many debates statements to the effect that it is warmer now than it has been for thousands of years are frequently used.
As the authors point out the major problem with reconstructing the climate of the past few thousand years is that the so-called instrumental period – for which we have direct measurements – only stretches back as far as the middle of the 19th century. To overcome this researchers in this paper compile an impressive number of temperature proxies situated in the extra-tropical Northern Hemisphere. There are 91 in total, comprising ice-cores, tree-rings (density and width), lake and sea sediments, historical records, speleotherms, and pollen. All of them go back to 1500 AD and 32 go back as far as 1 AD.
The reconstruction of past climate has improved significantly in the past few years due to the availability of more proxies and better statistical analysis. The authors acknowledge this and point out the differences that are emerging from the reconstructions conducted about a decade ago. They mention two such reconstructions performed by Michael Mann that they say, perhaps typically for the period, show little variability. They add they display, “little evidence for previous temperature anomalies comparable to those of the 20th century.” The authors conclude that previous climate reconstructions “seriously underestimate” variability and trends in the climate record of the past two millennia.
This new analysis shows that the warming we have seen in the late-20th century is not unprecedented, as can be seen in figure 1. Seen in the reconstruction is a well-defined peak of temperature between 950–1050 AD. They also find that the first millennium is warmer than the second.
The researchers conclude: “The level of warmth during the peak of the MWP (Medieval Warm Period) in the second half of the 10th century, equaling or slightly exceeding the mid-20th century warming, is in agreement with the results from other more recent large-scale multi-proxy temperature reconstructions.”
Ljungqvist et al. also show that, “on centennial time-scales, the MWP is no less homogeneous than the Little Ice Age if all available proxy evidence, including low-resolution records are taken into consideration in order to give a better spatial data coverage.”
In conclusion this impressive piece of research makes a significant contribution to a growing body of evidence that both the global extent of the MWP, and the temperature was similar, or even greater than the Current Warm Period, even though the atmospheric CO2 concentrations today are some 40% greater than they were during the MWP.
Some argue that without anthropogenic greenhouse gasses the world would have cooled in the past few decades. That might be the case, but the statement that it is warmer now than it has been for thousands of years is untrue. The rate of warming seen recently is also not unprecedented.
In the context of climate sensitivity – the real world climatic reaction to increasing greenhouse gasses – and climate model uncertainty, it is an interesting question to ask: if Nature alone in the past can produce temperatures like those we see today, why can’t she do so again?
Feedback: [email protected]
2) David Whitehouse: Atlantic Sea Surface Temperature As Warm In 1775 As Today
The Global Warming Policy Foundation, 18 October 2012
Another piece of research using climate proxies has cast some light on the recent evolution of sea surface temperature in a region of the Atlantic.
The researchers, from the National University of Mexico and the Woods Hole Oceanographic Institution in the USA, writing in the journal Paleoceanography, point out that accurate low-latitude sea surface temperature records that predate the instrumental era (post-1850) are needed to put recent warming in the context of natural climate variability and to understand what they describe as the possible influence of anthropogenic climate change on this variability.
They obtain a most interesting 235-year-long sea surface temperature reconstruction based on annual growth rates of coral (Atlantic coral Siderastrea sidereal) at three sites in Mexico located within the Atlantic Warm Pool (AWP). The point out that AWP surface temperatures vary in concert the Atlantic Multidecadal Oscillation (AMO) – a basin-wide, quasiperiodic (60–80 years) oscillation of North Atlantic sea surface temperatures.
They find that the annual growth rates of all colonies are significantly, inversely correlated to regional sea surface temperatures. The temperature data they obtain shows an additional multidecadal sea surface temperature cycle prior to instrumental record that suggests that AWP multidecadal variability, and likely AMO variability, persisted since at least 1775 AD with an amplitude comparable to that of the instrumental era.
The sea surface temperature reconstruction shows that it remained within 1 deg C of recent values during the past 225 years, consistent with previous reconstructions.
The graph they produce is fascinating. It shows a decline in sea surface temperature from 1773 to 1860, then a peak at 1880 which then declines to 1910. The year 1910 is a significant one for those studying rises in sea level as it is from 1910 that the gradient of recent sea level rise changes and persists that that rate of increase to the present day.

The rise in sea surface temperature since 1910 is qualitatively the same as the rise in global surface temperature over this period, a rise between 1910–40, a slight decline to about 1980 and a rise thereafter.
Raw data can be found at here.
Feedback: [email protected]
3) Yet another paper demonstrates warmer temperatures 1000 years ago and even 2000 years ago.
Watts Up With That, 18 October 2012
Anthony Watts
Yesterday I highlighted the paper The extra-tropical Northern Hemisphere temperature in the last two millennia: reconstructions of low-frequency variability, by B Christiansen of the Danish Meteorological Institute and F C Ljungqvist of Stockholm University which showed that using a multitude of proxy samples in the norther hemisphere, that:
“The level of warmth during the peak of the MWP (Medieval Warm Period) in the second half of the 10th century, equaling or slightly exceeding the mid-20th century warming, is in agreement with the results from other more recent large-scale multi-proxy temperature reconstructions.”
Now another paper, by Esper et al published in the Journal of Global and Planetary Change, shows that not only was the summers of the MWP equal or greater than our current warmth, but that the summers of the Roman Warm Period of 2000 years ago was significantly warmer than today.
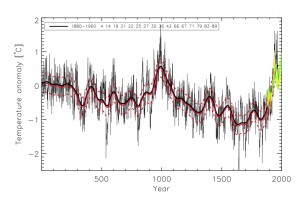
Fig. 4. Northern Scandinavian JJA temperatures back to 138 BC. The annually resolved N-Scan record (blue curve) shown together with 100-year filters of the reconstruction (red curve) and uncertainty estimates integrating standard and bootstrap errors (dashed curves). Light and dark grey bars indicate exceptionally warm and cold 30-year periods during the Roman, Migration, Medieval Warm, Little Ice Age, and Modern Warm Periods. Temperatures are expressed as anomalies with respect to the 1951–1980 mean.
Variability and extremes of northern Scandinavian summer temperatures over the past two millennia
Jan Esper, Ulf Büntgen, Mauri Timonen, David C. Frank
Abstract
Palaeoclimatic evidence revealed synchronous temperature variations among Northern Hemisphere regions over the past millennium. The range of these variations (in degrees Celsius) is, however, largely unknown. We here present a 2000-year summer temperature reconstruction from northern Scandinavia and compare this timeseries with existing proxy records to assess the range of reconstructed temperatures at a regional scale. The new reconstruction is based on 578 maximum latewood density profiles from living and sub-fossil Pinus sylvestris samples from northern Sweden and Finland. The record provides evidence for substantial warmth during Roman and Medieval times, larger in extent and longer in duration than 20th century warmth. The first century AD was the warmest 100-year period (+0.60 °C on average relative to the 1951–1980 mean) of the Common Era, more than 1 °C warmer than the coldest 14th century AD (−0.51 °C). The warmest and coldest reconstructed 30-year periods (AD 21–50=+1.05 °C, and AD 1451–80=−1.19 °C) differ by more than 2 °C, and the range between the five warmest and coldest reconstructed summers in the context of the past 2000 years is estimated to exceed 5 °C. Comparison of the new timeseries with five existing tree-ring based reconstructions from northern Scandinavia revealed synchronized climate fluctuations but substantially different absolute temperatures. Level offset among the various reconstructions in extremely cold and warm years (up to 3 °C) and cold and warm 30-year periods (up to 1.5 °C) are in the order of the total temperature variance of each individual reconstruction over the past 1500 to 2000 years. These findings demonstrate our poor understanding of the absolute temperature variance in a region where high-resolution proxy coverage is denser than in any other area of the world.
4) What Does This Temperature Graph Tell Us?
CO2 Science Magazine, 3 October 2012
While perusing a paper recently published in the Journal of Archaeological Science (Drake, 2012), we read the author’s account of how most of the Greek palatial centers of the Late Bronze Age were either destroyed or abandoned between the 13th and 11th centuries BCE, and how thereafter – during what has come to be known as the Greek Dark Ages – the people affected by this climatic cooling suffered significantly in multiple ways until the advent of the Roman Warm Period.
But that is not what this editorial is about. What we found to be of most interest is something that has been known (by us and many others) about earth’s climate for quite some time now; and that is the long-term temperature record produced by the Greenland Ice Sheet Project (GISP2), which is depicted below, as plotted by Drake but based on data reported by Alley (2004).
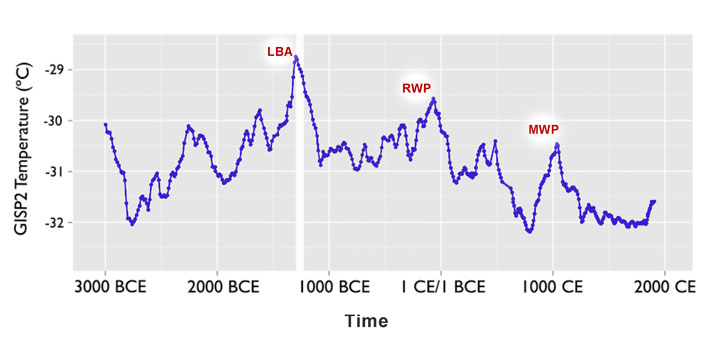
Figure 1. The past 5,000 years of the GISP2 temperature history of the Greenland Ice Sheet, adapted from Drake (2012), who denoted the general locations of the Late Bronze Age (LBA), the Roman Warm Period (RWP) and the Medieval Warm Period (MWP) in their original work.
In viewing this history, it is most interesting to note (and know) that over its first 4,800 years (that’s 96% of the record) – when the temperature varied all over the place – the atmosphere’s CO2 concentration was extremely stable, hovering between about 275 and 285 ppm; while over the last 200 years (the remaining 4% of the record), when the temperature shows but a fraction of a degree warming, the air’s CO2 concentration rose by well over an extra 100 ppm.
5) Ice Sheets May Stabilise For Centuries, Regardless Of Warming
The Register, 18 October 2012
Lewis Page
Ice sheets retreating due to global warming often suddenly stabilise for “decades to centuries” no matter that the warming is still going on, scientists have found. The new research would seem likely to have an impact on forecasts seeking to predict sea-level rise in coming times.
Boffins at Cambridge, Durham and Sheffield universities and others at the British Antarctic Survey came together to produce the new investigation, which sought to examine the way in which fast-moving “ice streams” move from major ice sheets – such as the Greenland and Western Antarctic ones – to the sea. The streams are very important, as they carry 90 per cent of the ice moving into the ocean.
“Ice streams are like taps filling a bath,” explains Dr Chris Stokes of Durham uni – in this case the bath being the world’s oceans.
“The problem here is that we do not know if something is suddenly going to turn them up or even turn them off,” he adds.
In this case Stokes and his colleagues didn’t find anything which would open up the taps: but they did find something which turns them off, often for lengthy periods.
“Our research shows that the physical shape of the channels is a more important factor in controlling ice stability than was previously realised,” says Dr Stewart Jamieson.
The boffins found this out by developing a simulation which matched what actually happened to a particular ice sheet as it retreated at the end of the last Ice Age:
The researchers looked at the landscape of the seafloor in Marguerite Bay, in the Antarctic Peninsula, and saw that during a rapid phase of recession 13,000 years ago, retreat paused many times. Using a computer model designed to work in situations of rapid change, they found they could reproduce the same pattern in a series of simulations. These showed that ice dragged on the sides of the channel more where it was narrow, causing retreat to slow and in places temporarily stop for decades to centuries before retreat continued.
“We find that retreat of the Marguerite Bay Ice Stream following the [Last Glacial Maximum] was highly nonlinear and was interrupted by stabilizations on a reverse-sloping bed, where theory predicts rapid unstable retreat,” the researchers wrote in their new paper, published in Nature Geoscience.
Comment
It would seem that current predictions of sea level rises to be expected on a given timescale with a given amount of global warming will need to be revised – downwards.
As the most up-to-date predictions are not very alarming anyway, it could be that sea level rises just aren’t that big a worry, over say the next century anyway
6) UK Government May Review Flawed Stern Review
House of Lords, 15 October 2012
Lord Naseby: My Lords, if we are to continue with the aim of trying to achieve self-sufficiency, has not the time come to have another look at the Stern review, not because there is anything wrong with renewables but because the cost platform has so escalated in that area that it is highly questionable that we can now afford the proposals in that review?
The Parliamentary Under-Secretary of State, Department of Energy and Climate Change (Baroness Verma): My Lords, the Government are very mindful of the points that my noble friend raises but, as I said earlier, we are looking at all forms of energy, including renewables. We may well revisit previous reports but the most important thing is that we look at how, in the future, we are going to have a sustainable energy system which ensures that all our homes constantly have light.
7) And Finally: Global Warming Expert Attacks ‘Unhelpful’ Blogger
Cambridge News, 18 October 2012
An eminent scientist has criticised the leader of Cambridgeshire County Council for denying man’s role in global warming. The politician had blogged on Met Office figures which showed there had been no discernible rise in global temperatures in the last 16 years.
Prof Eric Wollf, science leader at the British Antarctic Survey, based in Madingley Road, said Cllr Nick Clarke was wrong to assert that global warming “may not exist” and “is not caused by human activity” if it does.
Cllr Clarke, the leader of Cambridgeshire County Council, was also criticised by Tony Juniper, a former director of Friends of the Earth, who condemned his comments as a “huge embarrassment” and accused the Conservative of cherry-picking data.
However Cllr Clarke has won support from members of his party – who loudly cheered as he defended his position at the authority’s latest meeting.
His blog posting on the subject drew on Met Office figures which showed there had been no discernible rise in global temperatures in the last 16 years.
Pinned down at the meeting on whether he believed that man-made climate change existed, Cllr Clarke said he had “no idea”.
Prof Wollf said global temperatures could only be analysed over lengthy periods, and that they had risen on average by 0.8C over the last 140 years.
He said it was natural to expect variability from this trend – but that the world “really is warm”, with eight of the 10 warmest years on record occurring in the last decade.
Prof Woolf said: “There is no doubt that carbon dioxide concentrations have been increasing, and basic physics tells us that extra carbon dioxide causes warming – exactly what we have been seeing in recent decades.
“Climate science shows the complex ways in which natural factors add noise to the warming trend, but it is not helpful to pretend it isn’t there.”
Dr David Reiner, an expert on the politics of climate change at the Cambridge Judge Business School, said it was a “shame” that Cllr Clarke had “spouted off” and not drawn on the city’s scientific expertise.
Speaking at the meeting, Cllr Clarke said the point of his blog posting on the subject had not been scientific, but to demonstrate that anyone who spoke out against the established orthodoxy was condemned as a “heretic who will bring about the demise of mankind”.
He said the council needed to reduce its energy consumption, but argued subsidies to tackle climate change were hurting Cambridgeshire’s economy
