By David Middleton

The Fable of Chicken Little of the Sea
Guest essay by David Middleton,
When if comes to debunking Gorebal Warming, Chicken Little of the Sea (“ocean acidification”) and other Warmunist myths, my favorite starting points are my old college textbooks.
Way back in the Pleistocene (spring semester 1979) in Marine Science I, our professor, Robert Radulski, assigned us The Oceans by Sverdrup (yes, that Sverdrup), Johnson and Fleming. Even though it was published in 1942, it was (and may still be) considered the definitive oceanography textbook. I looked up “ocean acidification” in the index… It wasn’t there.
The notion that CO2 partial pressure influences the pH of seawater isn’t a new concept, *surely* ocean acidification must have been mentioned in at least one of my college textbooks.
So, next I turned to my Stratigraphy & Sedimentation (also Spring Semester 1979) textbook, Principles of Sedimentology by Friedman (yes, that Friedman) and Sanders. There’s an entire section on the relationship between CO2 and pH and how if affects calcium carbonate precipitation and dissolution…
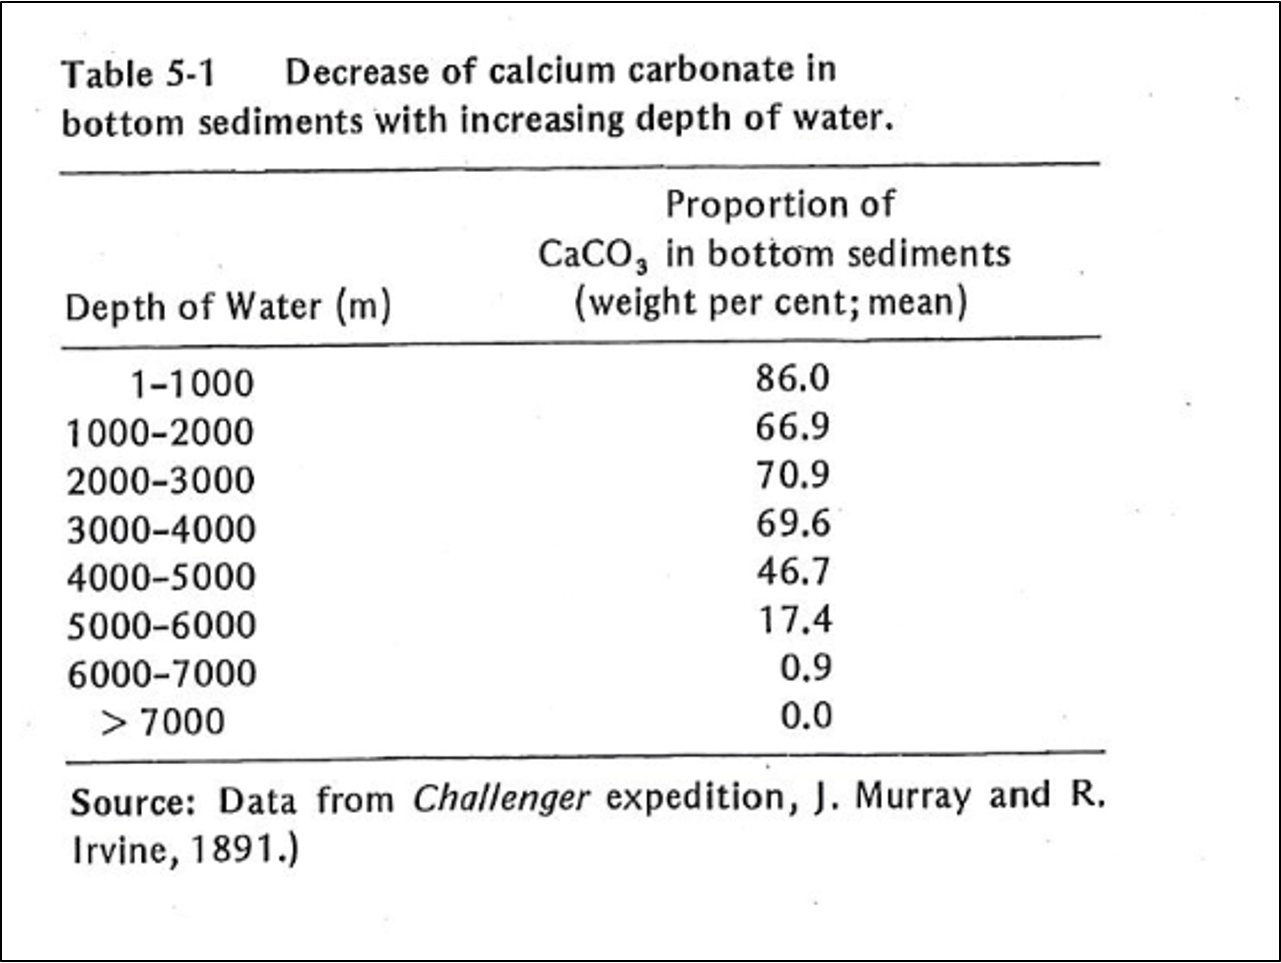
When the pH of seawater decreases, calcium carbonate dissolves. In warm, shallow seas, at a pH of about 8.3, dissolution of aragonite and calcite particles by inorganic processes is almost nonexistent. However, since the classical studies of the Challenger expedition, it has been known that the proportion of calcium-carbonate particles in seafloor sediments decreases as depth of water increases (Table 5-1). Such decrease is particularly rapid at depths between 4000 and 6000 m. Although the reasons for this decrease have been debated, the evidence suggests that calcium carbonate dissolves because the CO2 concentration increases with depth. The control on CO2 appears to be part biological; it results from biological oxidation of organic-carbon compounds. Also, the water masses at greater depth were derived from the polar region; their temperature is lower and the water contains more dissolved CO2. Increased concentration of CO2 is in turn reflected by lower pH, which leads to calcium carbonate dissolution. However, the increase of pressure with depth may also be involved; such increase affects the dissociation of carbonic acid (Eqs. 5-11 and 5-12). The depth at which the calcium-carbonate decreases most rapidly is known as the carbonate-compensation depth, defined as the depth at which the rate of dissolution of solid calcium carbonate equals the rate of supply.
Friedman and Sanders, pages 133-134.

A very thorough, easy to read, description of the relationship between CO2 and seawater pH… However, the phrase “ocean acidification” is notably absent from the entire 300+ pages. How is this possible?
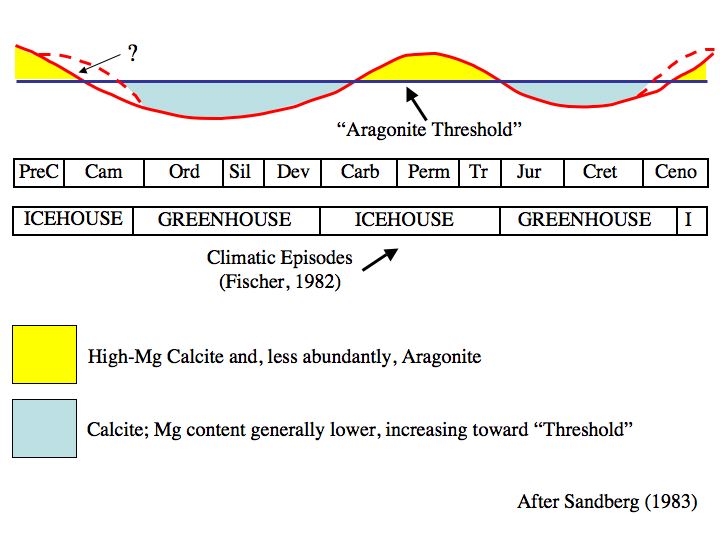
Even way back then, we knew that past atmospheric CO2 concentrations were often much higher and the oceans had oscillated between calcite and aragonite seas during periods of high and low atmospheric CO2 concentrations.
From Wikipedia By Wilson44691 at English Wikipedia – Transferred from en.wikipedia to Commons., Public Domain, https://commons.wikimedia.org/w/index.php?curid=3965327
Dr. Drobnyk was the department chairman and he assigned us a brand new textbook… Friedman & Sanders was published in 1978… Surely ocean acidification just had to be mentioned in it.
Surely…
Why wasn’t the relationship of CO2 and pH called Ocean Acidification prior to the Gorebal Warming Myth?
Because seawater cannot become acidic (at least not under real world conditions) and Communism was sufficiently scary as far as bureaucrats were concerned, prior to the end of Cold War I.
A study of seawater pH near active volcanic CO2 vents in the Mediterranean (Kerrison et al., 2011) found that the pH immediately adjacent to the vent was still alkaline, despite being subjected to the equivalent of nearly 5,600 ppm CO2.
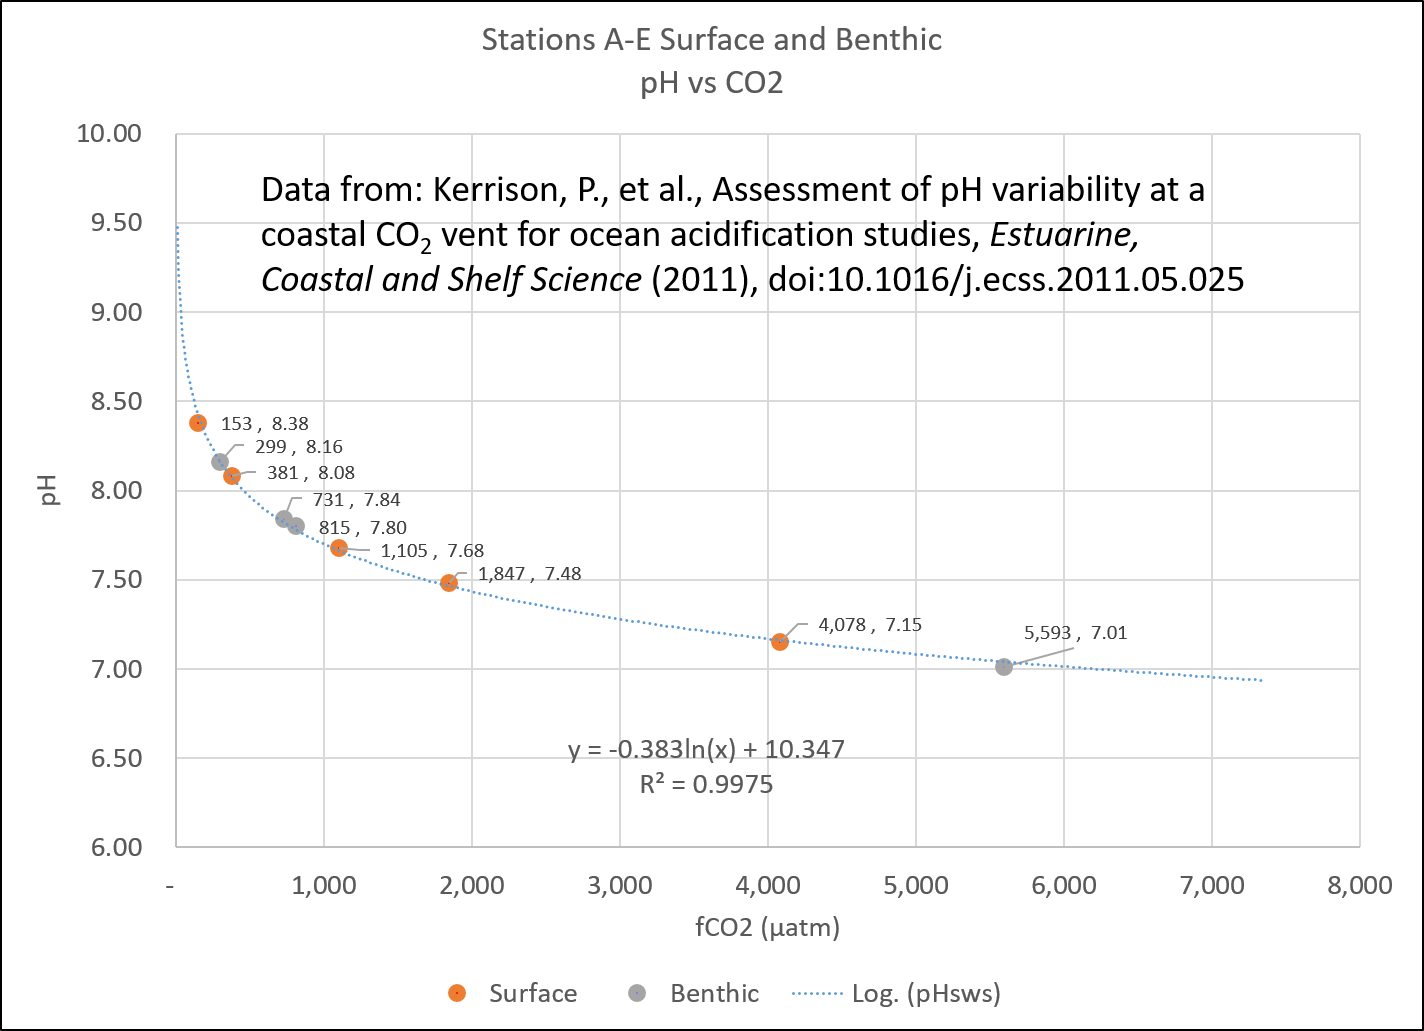
CO2 fugacity vs pH. Data from Kerrison et al., 2011.
Partial pressure and fugacity (μatm) are a little lower than what the mixing ratio (ppm) would be, depending on temperature and humidity. However, they are close. A partial pressure (pCO2) of 350 μatm generally equates to about 350 ppm in the atmosphere. At nearly 5,600 ppm CO2 the seawater was still alkaline, not acidic.
Straw man! The “ocean acidification” hypothesis clearly states that the oceans won’t become acidic.
Since someone will likely accuse me of manufacturing a straw man…
Calling this phenomenon “ocean acidification” when surface seawater will remain “basic” under future emissions scenarios is alarmist
Just as we describe an increase in temperature from -40°F to -20°F as warming, even though neither the starting nor the ending temperature is “warm,” the term “acidification” describes a direction of change (i.e. increase) in the level of acidity in the global oceans, not an absolute end point. When CO2 is added to seawater, it reacts with water to form carbonic acid (H2CO3); hence acid is being added to seawater, thereby acidifying it. Similarly, in the example about human blood, a drop in pH is referred to as acidosis, even though the point where acidemia begins (7.35) is still above 7.
That’s all well and good. It’s even true-ish… However, the science of seawater geochemistry has been around a long time. The relationship between CO2 and pH has been observed for a long time. Why did they suddenly fabricate the phrase “ocean acidification” to describe this process? Because “people” are almost as afraid of acid as they are of radiation.
The phrase was literally invented out of thin air in 2003 by Ken Caldiera…
However, while the chemistry is predictable, the details of the biological impacts are not. Although scientists have been tracking ocean pH for more than 30 years, biological studies really only started in 2003, when the rapid shift caught their attention and the term “ocean acidification” was first coined. What we do know is that things are going to look different, and we can’t predict in any detail how they will look. Some organisms will survive or even thrive under the more acidic conditions while others will struggle to adapt, and may even go extinct. Beyond lost biodiversity, acidification will affect fisheries and aquaculture, threatening food security for millions of people, as well as tourism and other sea-related economies.
Scientists have been tracking ocean pH for more than 30 whole years! Wow! 30 fracking years. That’s like a whole geological nanosecond!
This is so idiotic, it deserves repeating:
What we do know is that things are going to look different, and we can’t predict in any detail how they will look.
Bullschist!!!
We have a pretty good idea how things will look… They will look very much like they do today.
Scientific Reports volume 4, Article number: 5261 (2014)
Larger CO2 source at the equatorial Pacific during the last deglaciation
Kaoru Kubota, Yusuke Yokoyama, Tsuyoshi Ishikawa, Stephen Obrochta & Atsushi Suzuki
Abstract
While biogeochemical and physical processes in the Southern Ocean are thought to be central to atmospheric CO2 rise during the last deglaciation, the role of the equatorial Pacific, where the largest CO2source exists at present, remains largely unconstrained. Here we present seawater pH and pCO2 variations from fossil Porites corals in the mid equatorial Pacific offshore Tahiti based on a newly calibrated boron isotope paleo-pH proxy. Our new data, together with recalibrated existing data, indicate that a significant pCO2 increase (pH decrease), accompanied by anomalously large marine 14C reservoir ages, occurred following not only the Younger Dryas, but also Heinrich Stadial 1. These findings indicate an expanded zone of equatorial upwelling and resultant CO2 emission, which may be derived from higher subsurface dissolved inorganic carbon concentration.
Kubota et al, 2014 found…
pH and pCO2 reconstruction
Using our revised calibration, we reconstructed pH from our new δ11B measurements on Tahitian corals, as well as from previously reported data11 from both the Marquesas and Tahiti, and the overall result is consistent with the WEP foraminifer δ11B variations10 (Fig 3a and b). The oldest coral sample, dated to 20.7 ka BP during the last glacial maximum (LGM), exhibits a relatively high pH (8.26). From 15.5 to 9.0 ka BP, pH is generally constant within uncertainty (8.15–8.22) and consistent with the preindustrial value of 8.20. Four notable pH excursions are associated with HS1 and the YD. Two of our samples exhibit anomalously low pH at the end of HS1 (8.13 at 15.15 ka and 8.09 at 14.99 ka BP), in addition to those at end of the YD at the Marquesas11. The low pH following HS1 had been previously undetected at this location. Calculation of pCO2 (see Methods) reveals deglacial values significantly above those of the atmosphere (Figs. 3c and 4a). Conversely, ΔpCO2during last glacial and the early Holocene was nearly zero, suggesting air-sea CO2 equilibrium.
…Periods of anomalously low pH and high pCO2 near the transitions from Heinrich Stadial 1 (8.08-8.15 & 300-350 μatm) to the Bølling/Allerød, during the Bølling/Allerød interstadial (8.15-8.20 & >300 μatm) and at the onset of the Holocene (8.02-8.10 & 350-420 μatm).

Figure 3 from Kubota et al., 2014 “(a) Reported δ11B values of planktonic foraminifera with 2σ uncertainty from ERDC-92 (ref. 10). Age model is from the original publication. (b) In situ pH reconstructed from δ11B of fossil Porites spp. using our new calibration. Red and green circles are from Tahiti by this study and Douville et al.11, respectively. Blue circles are from Marquesas by Douville et al.11after correction by +0.04 pH units. (c) Derived pCO2 of surface water around equatorial South Pacific Ocean (same colors as b) and atmospheric pCO2 on the GICC05 timescale1. All error bars are 2σ. YD, Younger Dryas; B/A, Bølling/Allerød; ACR, Antarctic Cold Reversal; HS1, Heinrich Stadial 1; LGM, Last Glacial Maximum.”
Oddly enough, Steinthorsdottir et al., 2013 also found evidence of anomalously high atmospheric CO2 levels during Bølling/Allerød interstadial and the onset of the Holocene.
Quaternary Science Reviews 68 (2013) 43-58
Stomatal proxy record of CO2 concentrations from the last termination suggests an important role for CO2 at climate change transitions
Margret Steinthorsdottir, Barbara Wohlfarth, Malin E. Kylander, Maarten Blaauw, Paula J. Reimer
Abstract
A new stomatal proxy-based record of CO2 concentrations ([CO2]), based on Betula nana (dwarf birch) leaves from the Hässeldala Port sedimentary sequence in south-eastern Sweden, is presented. The record is of high chronological resolution and spans most of Greenland Interstadial 1 (GI-1a to 1c, Allerød pollen zone), Greenland Stadial 1 (GS-1, Younger Dryas pollen zone) and the very beginning of the Holocene (Preboreal pollen zone). The record clearly demonstrates that i) [CO2] were significantly higher than usually reported for the Last Termination and ii) the overall pattern of CO2 evolution through the studied time period is fairly dynamic, with significant abrupt fluctuations in [CO2] when the climate moved from interstadial to stadial state and vice versa. A new loss-on-ignition chemical record (used here as a proxy for temperature) lends independent support to the Hässeldala Port [CO2] record. The large-amplitude fluctuations around the climate change transitions may indicate unstable climates and that “tipping point” situations were involved in Last Termination climate evolution. The scenario presented here is in contrast to [CO2] records reconstructed from air bubbles trapped in ice, which indicate lower concentrations and a gradual, linear increase of [CO2] through time. The prevalent explanation for the main climate forcer during the Last Termination being ocean circulation patterns needs to re-examined, and a larger role for atmospheric [CO2] considered.
[…]
Although records of atmospheric [CO2] as obtained from air bubbles in ice cores provide a good overall picture of the [CO2] conditions during approximately the past 800,000 years of the last ice age (Shackleton et al., 2000; Monnin et al., 2001), these records do not typically record short-term oscillations (<200 years), due to smoothing effects caused by both diffusion of gasses within the ice and time-averaging of ice core records (Shackleton et al., 2000; Siegenthaler et al., 2005). However, large short-term oscillations of [CO2] may be extremely important in the climate system, as so-called tipping points may be reached rapidly, causing severe changes in steady state climate (Broecker, 1997, 2006).
[…]
Setting aside the blather about “tipping points” and “a larger role for atmospheric [CO2]” as a climate “forcer,” Steinthorsdottir et al., 2013 demonstrates sharp rises in atmospheric CO2 near the end of the Bølling/Allerød interstadial (400-450 ppm) and at the onset of the Holocene (>300 ppm).

Figure 8 from Steinthorsdottir et al., 2013: “Comparison with Antarctic ice core-based atmospheric CO2 record. On the left hand side is the Hässeldala Core 5 stomatal index based CO2 concentration record, showing approximate minimum and maximum CO2
concentrations (see Table 3 for errors). On the right hand side is an Antarctic CO2
record reconstructed from air bubbles in the ice cores obtained at Dome C by the EPICA project (Monnin et al., 2001), synchronized with the Greenland ice core timescale (Lemieux-Dudon et al., 2010). The ages of the main climate change boundaries for each record are illustrated with dashed lines, surrounded by their error ranges in light grey (based on Walker et al., 2008 for the Greenland ice core chronology). The darker grey bars, which overlap the error ranges shown in light grey, illustrate that the ages for each of the boundaries are comparable within their error ranges. The records, although displaying some similarities, are clearly different. Firstly, the magnitude and range of CO2 concentrations are much larger in the Hässeldala Port record. Secondly, the stomatal-based record shows a more dynamic CO2 development through time, in particular across the climate change boundaries, while the ice core-based record shows an almost linear, smoothed development.”
Just about every method of estimating pre-industrial Late Quaternary CO2 levels apart from Antarctic ice cores shows much larger magnitudes and ranges of CO2 concentrations with far more dynamic CO2 development through time… because they are all higher resolution measurements than 99% of Antarctic ice cores For that matter, the magnitude, range and dynamism of Antarctic ice core CO2 varies with resolution. Most of the Gorebal Warming mythology is the result of the correlation of low resolution Antarctic ice cores to higher resolution temperature measurements and proxies.
While it is true that, all-other-factors-held-equal, seawater pH should decline as atmospheric CO2 levels rise…
All other factors are never held equal.
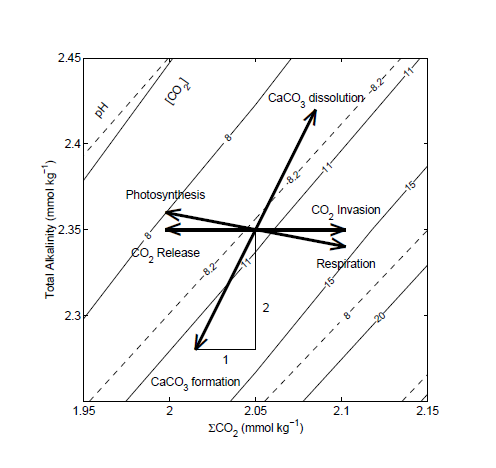
pH is complicated (Zeebe and Wolf-Gladrow)
Paleo pH estimates more closely match the PDO than CO2…


Amazingly… Almost all of the post-1978 references are supposedly examples of ocean acidification…
References
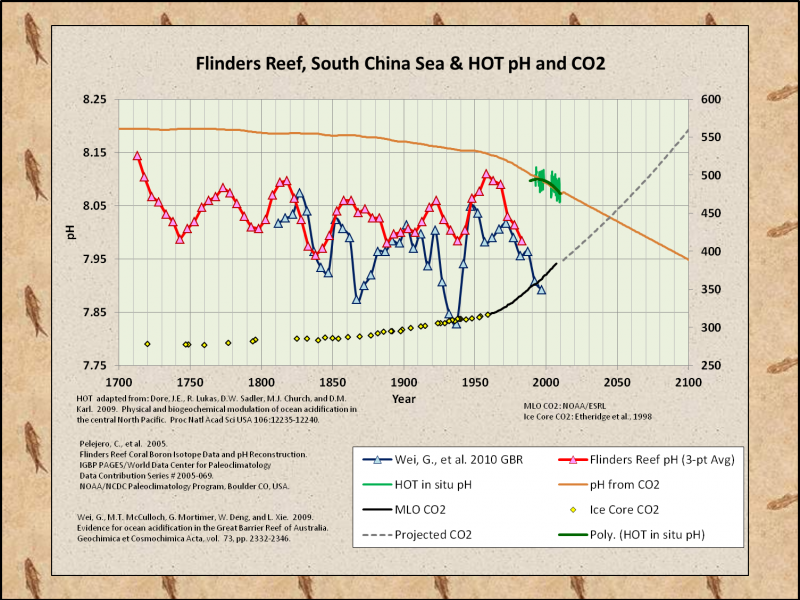
Dore, J.E., Lukas R., Sadler, D.W. Church, M.J., Karl, D.M. (2009). “Physical and biogeochemical modulation of ocean acidification in the central North Pacific.”
Proc Natl Acad Sci USA 106:12235–12240.
Friedman, G.M. and Sanders, J.E. (1978) “Principles of Sedimentology”. Wiley, New York.
Kerrison, Phil & Hall-Spencer, Jason & Suggett, David & Hepburn, Leanne & Steinke, Michael. (2011). “Assessment of pH variability at a coastal CO2 vent for ocean acidification studies.” Estuarine and Coastal Marine Science. 94. 129-137. 10.1016/j.ecss.2011.05.025.
Kubota K., Yokoyama Y., Ishikawa T., Obrochta S., Suzuki A. “Larger CO2 source at the equatorial Pacific during the last deglaciation.” (2014) Scientific Reports, 4 , art. no. 5261.
Pelejero, C., Calvo, E., McCulloch, M.T., Marshall, J.F., Gagan, M.K., Lough, J.M. and Opdyke, B.N. 2005. “Preindustrial to modern interdecadal variability in coral reef pH.” Science 309: 2204-2207
Steinthorsdottir, Margret & Wohlfarth, Barbara & Kylander, Malin & Blaauw, Maarten & Reimer, Paula. (2013). “Stomatal proxy record of CO2 concentrations from the last termination suggests an important role for CO2 at climate change transitions.” Quaternary Science Reviews. 68. 43-58. 10.1016/j.quascirev.2013.02.003.
Sverdrup, H. U. M. W., Johnson and R. H. Fleming, “The Oceans—Their Physics, Chemistry, and General Biology,” Prentice-Hall, Upper Saddle River, 1942.
Wei, G., McCulloch, M.T., Mortimer, G., Deng, W. and Xie, L. 2009. “Evidence for ocean acidification in the Great Barrier Reef of Australia.” Geochimica et Cosmochimica Acta 73: 2332-2346.
Zeebe, Richard E. and Wolf-Gladrow, Dieter A.
CARBON DIOXIDE, DISSOLVED (OCEAN)…
Proof that Chicken Little of the Sea has a sense of humor. If that’s not funny enough, the featured image came from…
http://ocean.si.edu/blog/have-we-hit-chicken-little-point-ocean-conservation