Scaremonger photos of inundation abound in our national news this week. Famous foreshore parks are gone, islands disappear, houses, picnic areas, racecourses, golf courses — all submerged. The water rolls in over Sydney’s Circular Quay, Melbourne’s Docklands, Brisbane Airport, Hindmarsh Island — swamped. Rooned. Today its the satellite photo, tomorrow it’ll be computer generated streetscapes; coming soon, the underwater documentary: Swimming in the Opera House.
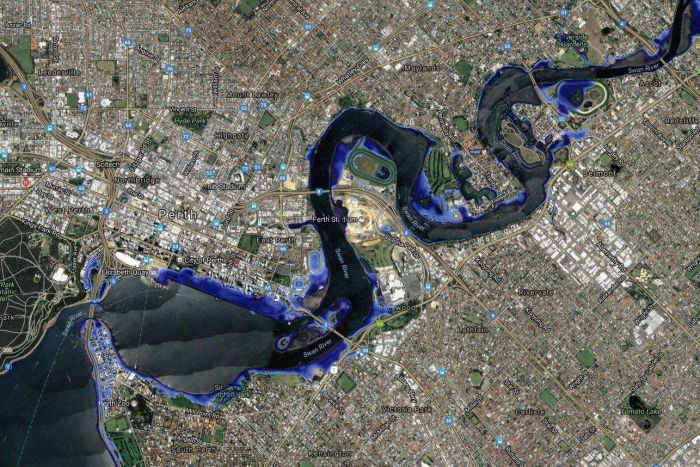
This is a mocked up satellite pic of Perth, WA projecting how much ground we will lose.
If you live in these future washed out zones, email me. I’ll buy your house.
Compare the forecast two metre rise, to actual Tide Gauge Data for Fremantle since 1900 (Fremantle has the second longest record of sea level change in the Southern Hemisphere):

Sea Level rise Fremantle, Perth, Australia shows about a 20cm rise in 110 years.
So there has been a 20cm rise or so in 100 years. But 2000 cm is coming. Yeah. (For details of the way Sea Levels around Perth Coastline change see Chris Gillhams work.)
This slow rate of sea level rise is not just a west coast thing: Sydney’s sea levels are rising at just 6.5cm per century.
The model projections future rate of change is off the scale.
Here’s that current Fremantle trend with a projected 2 metre rise to 2100 added in:

…
A 20cm rise in one hundred years is 2mm per annum. If the forecasts are right that rate must rise immediately to 22mm pa, a tenfold increase.