Did you hear this reported anywhere?
It is likely that the first half of 2025 has seen the fewest deaths related to extreme weather of any half-year in recorded human history
Great story from @RogerPielkeJr https://t.co/IcfQzQbLAh pic.twitter.com/ogO753k9yl
— Bjorn Lomborg (@BjornLomborg) July 21, 2025
https://rogerpielkejr.substack.com/p/human-progress-versus-climate-evangelism
Human Progress versus Climate Evangelism – Humanity marks an incredible achievement that some don’t want you to know about
By ROGER PIELKE JR.
Excerpt:
I was reading the Aon Global Catastrophe Recap, First Half ((1H) of 2025.1 In terms of economic losses, the first half of the year was overwhelmingly dominated by losses in the United States (especially the California fires) accounting for more than 90% of total insured losses (~$100 billion).
What really jumped out to me was this conclusion:
At least 7,700 people were killed due to natural disasters during the first half of 2025, which is well below the 21st-century average of 37,250. Majority of the deaths (5,456) occurred as a result of the earthquake in Myanmar.
That means that ~2,200 people worldwide died in catastrophes related to extreme weather events during the first six months of the year.
On the one hand, ~2,200 deaths are a lot and every loss of life is tragic. On the other hand, in the context of historical losses related to weather extreme, on a planet of 8.2 billion people, ~2,200 deaths is incredibly low. Historically low, in fact.
It is likely that the first half of 2025 has seen the fewest deaths related to extreme weather of any half year in recorded human history
To place this number into context, I immediately went to the EM-DAT database of catastrophe losses, overseen by the Centre for Research on the Epidemiology of Disasters (CRED) in Belgium.2 CRED also shows a very low tally of deaths from disasters for the first half of 2025.3 The EM-DAT total is less than that of Aon, so I’ll use the higher Aon numbers in the figures below.4

The figure above shows deaths from weather and climate disasters, from January to June, from 2000 to 2025. You can see that deaths are dominated by years with large events — 2008, Cyclone Nargis (~138,000 deaths, Indian Ocean); 2010, heat wave (~56,000 deaths, Russia); 2022, heat wave (>50,000 deaths, Europe).5 The little red bar on the far right of the bar graph is 2025.
To see 2025 more clearly, I have zoomed in on the graph, shown below.

You can clearly see that 2025 comes in well below any year of the past 25 years. Thus, we can conclude with some confidence that the first half of 2025 has seen the fewest deaths related to extreme weather of any January-June this century.
I’d go so far as to suggest that it is likely that the first half of 2025 has seen the fewest deaths related to extreme weather of any half year in recorded human history, given how large losses were in decades and centuries past, as you can see below.

#
End Excerpt
#
Related:
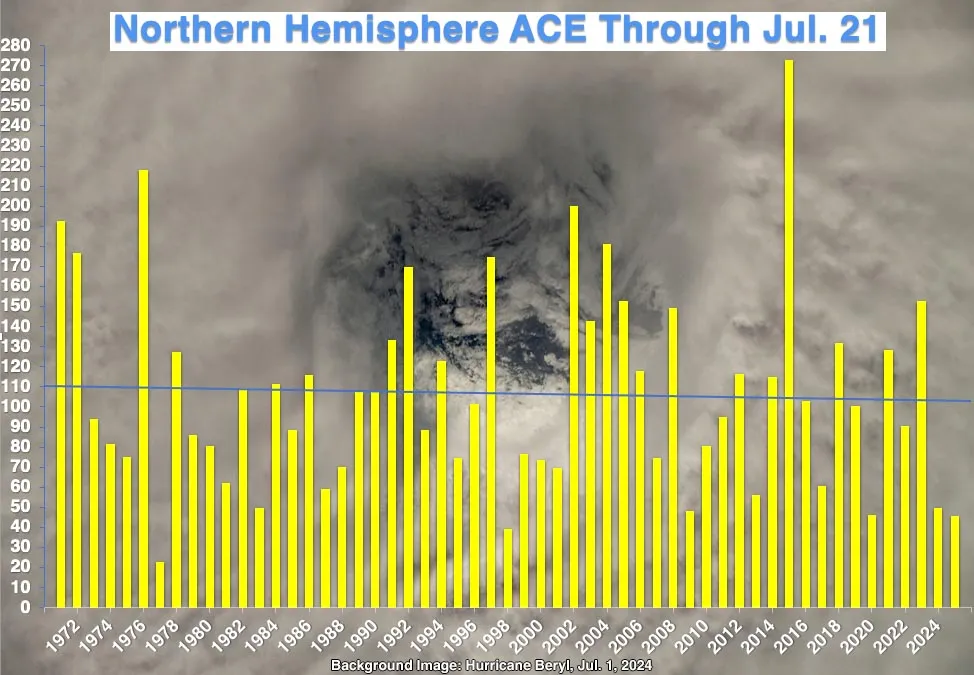
The graph shows Northern Hemisphere ACE for each year from January 1 through July 21, starting with 1971, the first year of reliable data from the Northeast Pacific. The ACE to date of 45.5 is only about 41% of the climatological average for the period 1991-2020. The only years with lower ACE at this point were 1977 (23.0) and 1998 (39.1). …
The cumulative longevity of each named storm (or “named storm days” in the table below) is only about two-thirds of average. As for hurricane-strength systems — which are called typhoons in the Northwest Pacific and severe cyclonic storms in the North Indian Ocean — their cumulative longevity is a mere 27% of average.