Death from Climate Disasters PLUMMETS
New research by Koutsoyiannis destroys the fear-driven #ClimateCult narrative. Deaths from hydroclimatic disasters have COLLAPSED—not because events are less OR more severe, but because of technology & risk management.
So why the non-stop… pic.twitter.com/3zXu6Azs2f
— Jonathan Cohler (@cohler) February 13, 2025
https://climath.substack.com/p/cool-look-at-risk-part-3-epilogue
Cool look at risk — Part 3: Epilogue – The third and last post for the fourth edition of my book
In this third and final post about my book Stochastics of Hydroclimatic Extremes — A Cool Look at Risk I highlight its last two sections, 11.3 and 11.4.
11.3 Is the risk from hydroclimatic extremes increasing?
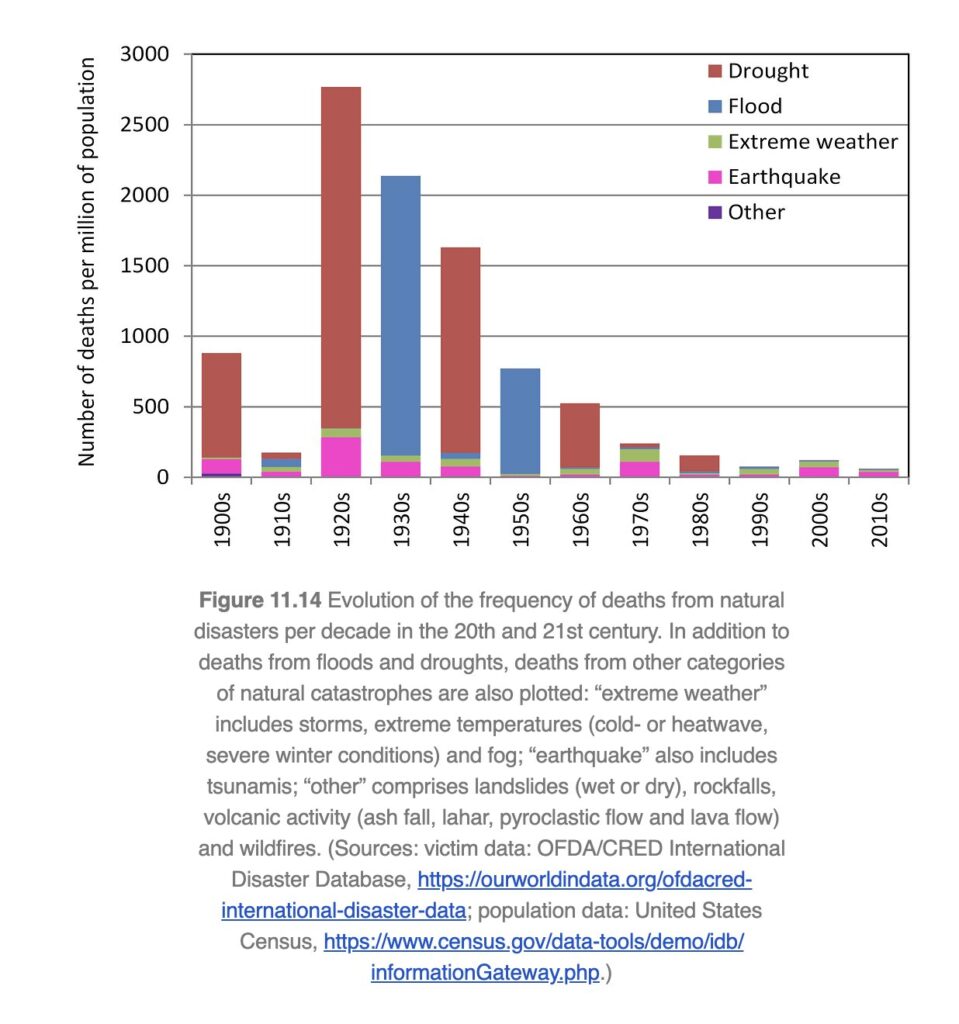
To track changes in the risk from extremes, including the influence of exposure and vulnerability, the ultimate measure of risk is the number of deaths from natural disasters. Relevant data are shown in Figure 11.14 for all natural disasters classified into five categories, three of which are of hydroclimatic type (see also : Koutsoyiannis, 20201).

Clearly, the impacts of hydroclimatic disasters, particularly the severest of them which caused human losses, have dropped spectacularly since the beginning of the 20th century. The number of victims arising from these disasters has fallen, while other types of disasters still cause large numbers of victims. Thus, in the 2010s the primary cause was earthquakes, representing 59% of the total number of victims from natural disasters. Obviously, the reason behind the reduction of the death toll from floods and droughts is not that they have become less severe or less frequent. Rather it is due to improvements in technology, risk assessment and management, and international collaboration. Strengthening of the economy enabled the implementation of these improvements.
Interestingly, according to data of 2010-2017, the deaths from natural disasters represent 0.08% of the total number of deaths, as seen in Figure 11.15. This number ranks them at the bottom in Figure 11.15, with the penultimate cause being cold and heat. Deaths from cold and heat are registered together. However, a multi-country analysis by Gasparrini (2015)2 suggests that these are mostly (at 95%) due to cold, while in the more recent study by Zhao et al. (2021)3 it has been estimated that the percentage of deaths from cold is more than 90% of the total. For comparison, the contribution to deaths of respiratory diseases (belonging to the broader category of health issues) is 11.6%, about 150 times higher than natural disasters (and, apparently, this figure should have now increased due to the Covid-19). Also, the share of deaths due to road accidents is 30 times higher than natural disasters.
The curious reader is encouraged to try to trace the reasons why the general perception of the public as informed by the media, is the inverse of reality. Also, why the climate related risks, the least severe of all, have been promoted so extensively by international organizations (governmental and non-governmental), politicians (of practically the entire political spectrum) and “philanthropists”.

11.4 Gazing into the future
The enormous promotion of climate related risks has been accompanied by the development of a paradigm of prophecy concerning the future of the planet and of humanity, based on models. There seems to be no reluctance to extend the time horizons of such prophecies which can reach the year 100 000 AD (Shaffer et al., 2009)4 or even 1 million years (Archer et al., 2020).5