
https://rogerpielkejr.substack.com/p/us-hurricane-overview-2024
Excerpt: Yesterday, The Washington Post published what can only be described as a hit piece on the nominee for Secretary of Energy, Chris Wright. The Post took issue with Wright’s claim that:
“[R]eports from the Intergovernmental Panel on Climate Change (IPCC) actually show no increase in the frequency or intensity of hurricanes.”
The Post claimed that Wright was misrepresenting the most recent IPCC assessment report. But rather than quoting the IPCC itself to show where Wright may have been wrong, The Post instead relied on a characterization of the IPCC from one of its contributors (emphasis added):
“He [Wright] is demonstrably misrepresenting [the IPCC] report,” said [Jim] Kossin, who said the IPCC report shows warming is making storms more intense. “It is extremely easy to show that. It is all there in black and white. There is no gray area.”1
Let’s do what The Post did not and take a look at what the IPCC actually concluded about trends in tropical cyclones:
“There is low confidence in most reported long-term (multidecadal to centennial) trends in TC frequency- or intensity-based metrics . . .”
Sounds like there might be a bit of gray area, no?
Take it also from MIT’s Kerry Emanuel, who is more bullish on human influences on tropical cyclones than the IPCC or most of his peers, but also recognizes that current understandings are far from black and white:
“At present, there is little scientific consensus about trends in global or regional [tropical cyclone] activity, either in the past, as detected in observations or in climate model simulations, or in the future as our climate continues to change.”
The Post’s reporting reminds us that there is a lot of misinformation out there related to climate, and hurricanes in particular. With The Washington Post and an IPCC author apparently willing to misrepresent what the IPCC concluded on hurricanes in service of a political hit, it can be very difficult for curious non-experts to know what’s what.
…
In terms of human impacts beyond the economic, 2024 was particularly deadly with respect to inland flooding, with approximately 400 people perishing due to the storms — especially Hurricane Helene in the Appalachian mountains. That is the most storm-related deaths since 2005 and Hurricane Katrina. Almost 20 years ago we published a paper arguing that inland flooding from hurricanes was an underappreciated threat.
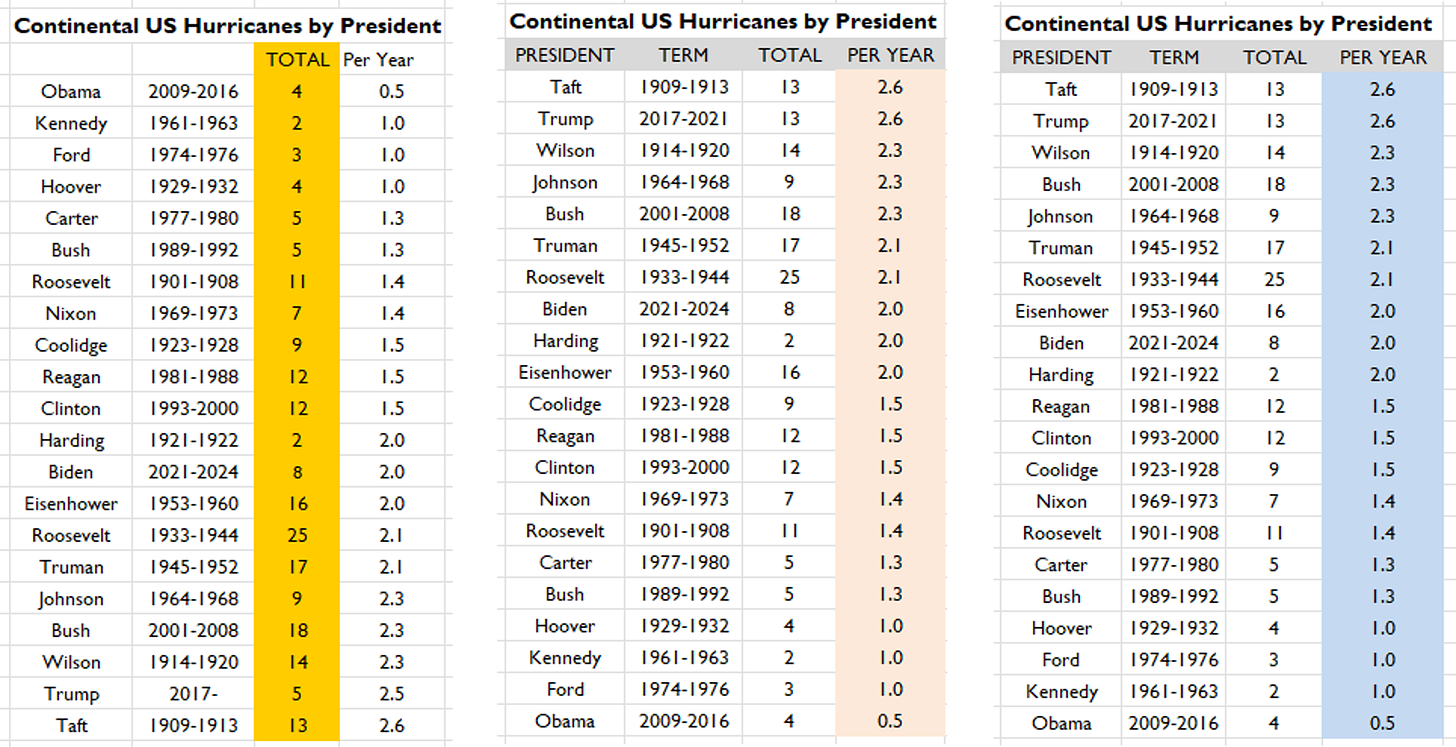
Continental U.S. Landfall Trends Since 1900

The figures above show long-term trends in continental U.S. hurricane landfalls. The last 8 years have seen a lot of major hurricane landfalls. The 8 years before that saw none. Since 1900 there are no trends in either variable.
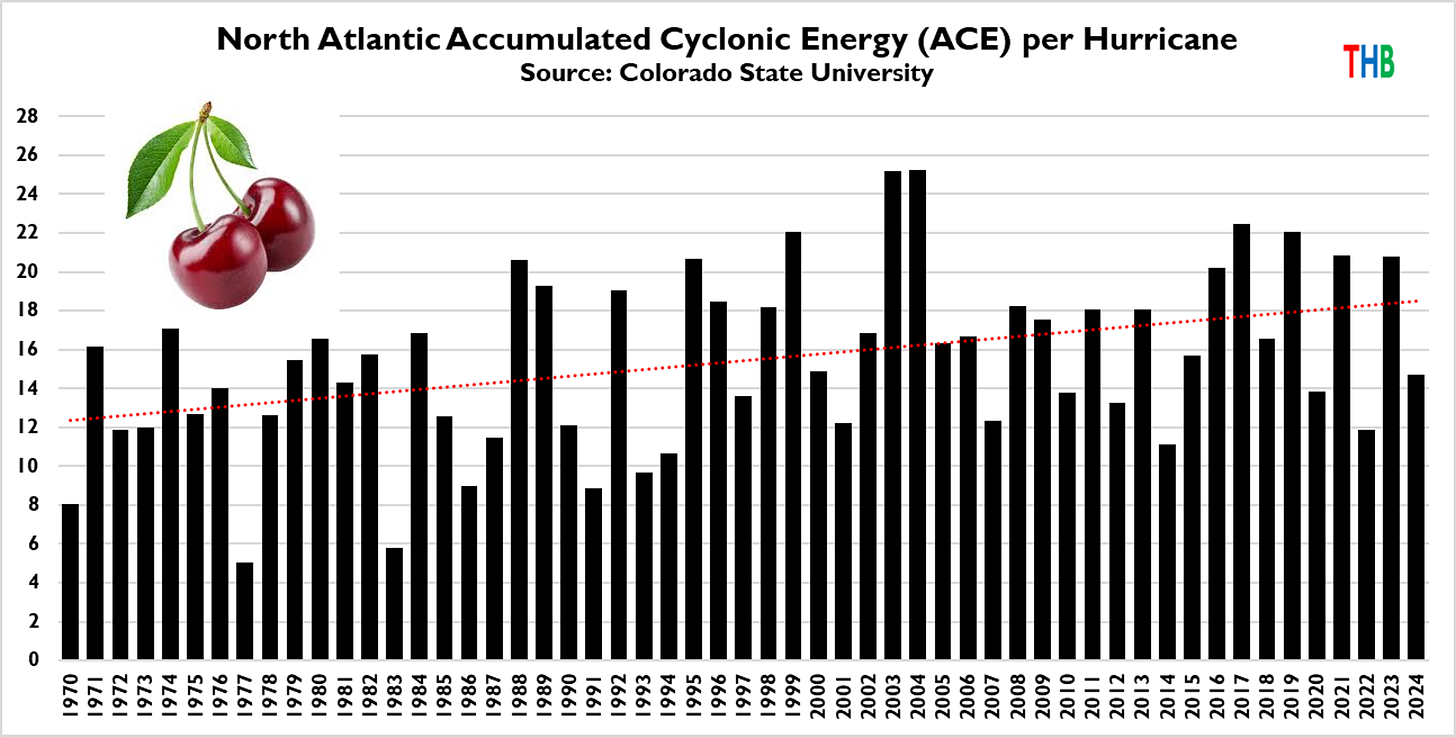
Trends in North Atlantic and Global Storm Intensity

The figure above shows ACE per hurricane in the North Atlantic since 1900. There is considerable variability, but no overall trend (dashed red line). By this metric, North Atlantic hurricanes have not overall become more intense since 1900.

The figure above shows the same variable — ACE per hurricane — globally, and shows no trend since 1980 (which is the first year available from CSU, based on data quality issues prior to that). Note that while the North Atlantic was active in 2024, most of the rest of the world saw a relatively inactive year by recent historical standards.
Normalized U.S. Hurricane Damage 1900 to 2024

The figure above updates our time series of normalized continental U.S. hurricane losses, with 2024 just making it into the top 10% of annual losses over the past 125 years. There is no trend in the time series (red dashed line), which is consistent with the lack of trends in landfalling hurricanes or major hurricanes.
…
Full Pielke Jr. Report here:
#