https://rogerpielkejr.substack.com/p/global-tropical-cyclones
This post is co-authored with Ryan Maue, whose Weather and Climate Substack I highly recommend. —RP
Excerpts: In 2012, Jessica Weinkle, Ryan Maue and I published in the Journal of Climate the first climatology of global landfalling tropical cyclones of at least hurricane strength. Since then, Ryan and I have updated the time series every year.
Landfalling hurricanes (also called typhoons or cyclones) are an important subset of tropical cyclones because these storms cause the most damage of any type of extreme event, with most of these losses occurring in the United States.
The figure below shows total global landfalling hurricanes and major hurricanes, 1970 to 2023. The graph starts in 1970 because that is when reliable information is available globally, however several basins have records that go back further in time.
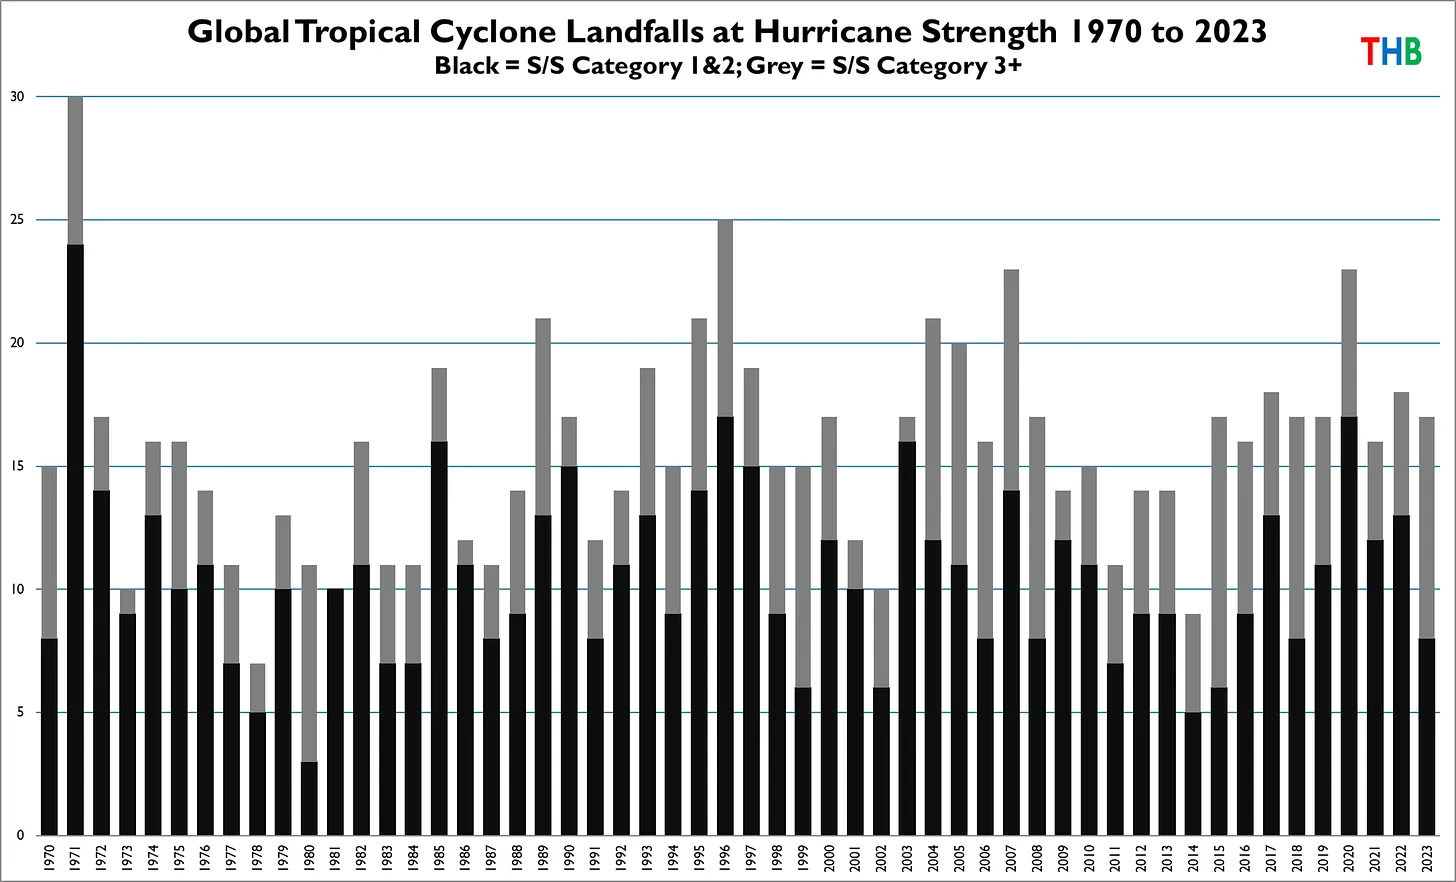
The figure below shows the same data with linear trends for minor (Saffir/Simpson Categories 1 and 2) and major (S/S 3+) hurricanes.

You can see that since 1970 there is no trend in landfalls of minor hurricanes and an upward trend in major hurricanes. Might this be the consequence of human-caused climate changes?
We can get a sense of the meaningfulness of a trend that starts in 1970 by looking further back in time for the Western North Pacific and North Atlantic which together saw 67% of all global hurricane landfalls from 1970 to 2023. The combined landfalls of minor and major hurricanes for these two basins is shown below and there is no trend in either category.

Below is the same data, but starting from 1970, and you can clearly see that major hurricane landfalls increase over this shorter period, in contrast to beginning the analysis in 1950, when data for these two basins is first available.

In technical terms, detection of change has not been achieved — which is fully consistent with the scientific consensus of NOAA and the IPCC. Without detection there can be no attribution under the IPCC framework for detection and attribution. Given the large interannual and decadal variability in tropical cyclones, data are easily cherrypicked (intentionally or unintentionally) to identify spurious trends.
The figures below show the distribution of global landfalling storm counts for major and total hurricanes for the period 1970 to 2023, showing large variability.

Landfalling hurricanes are of course just a subset of tropical cyclones, as many storms stay out to sea. Ryan has just updated his excellent figures on global tropical cyclone activity. The figure below shows running 12-month sums of all hurricanes and major hurricanes since 1980.

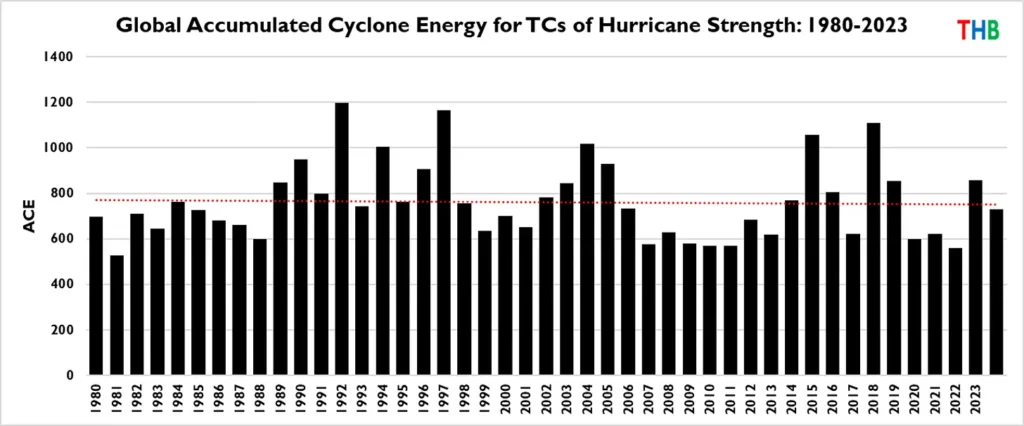
Finally, from the excellent data maintained by Phil Klotzbach at Colorado State University, we can look at yet another set of metrics — Accumulated Cyclone Energy (ACE, which combines frequency and intensity) and ACE per hurricane. These figures are shown below, and you can clearly see no trends in these metrics since 1980. Over this time period and according to these metrics, hurricanes have not become more intense.

For full article go to: https://rogerpielkejr.substack.com/p/global-tropical-cyclones