
By
Since the early 2000s there has been no net change in the Greenland ice sheet mean annual surface temperature, as well as no net change in melt extent percentage.
Greenland’s ice coverage was, for most of this year (September 1, 2022 to August 31, 2023), observed to be significantly above the long-term (1981-2010) climate average. The Greenland ice sheet didn’t even cooperate with the narrative during the “global boiling” melt months of July and August.
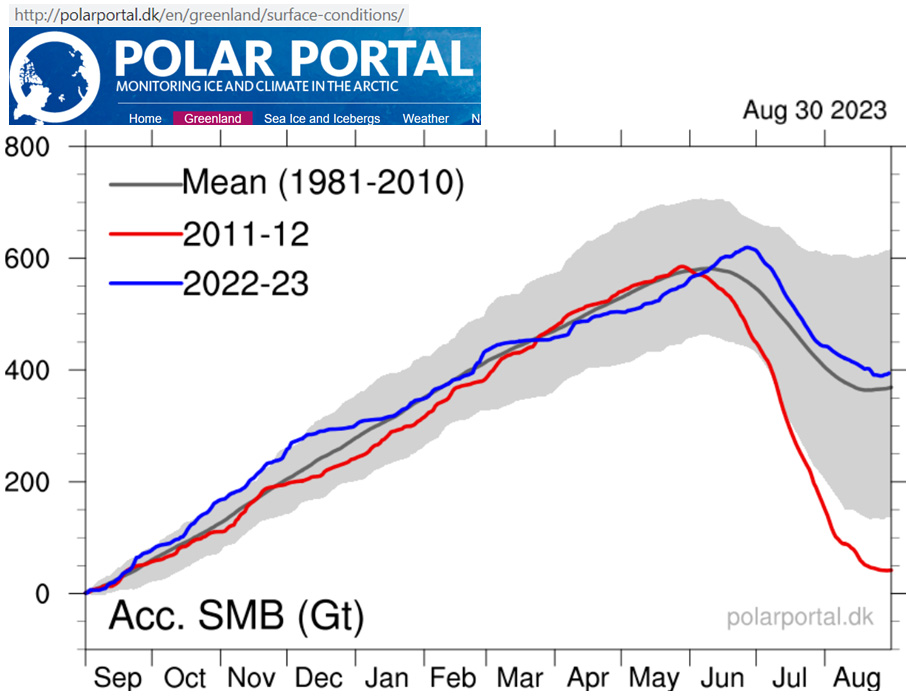
Image Source: PolarPortal
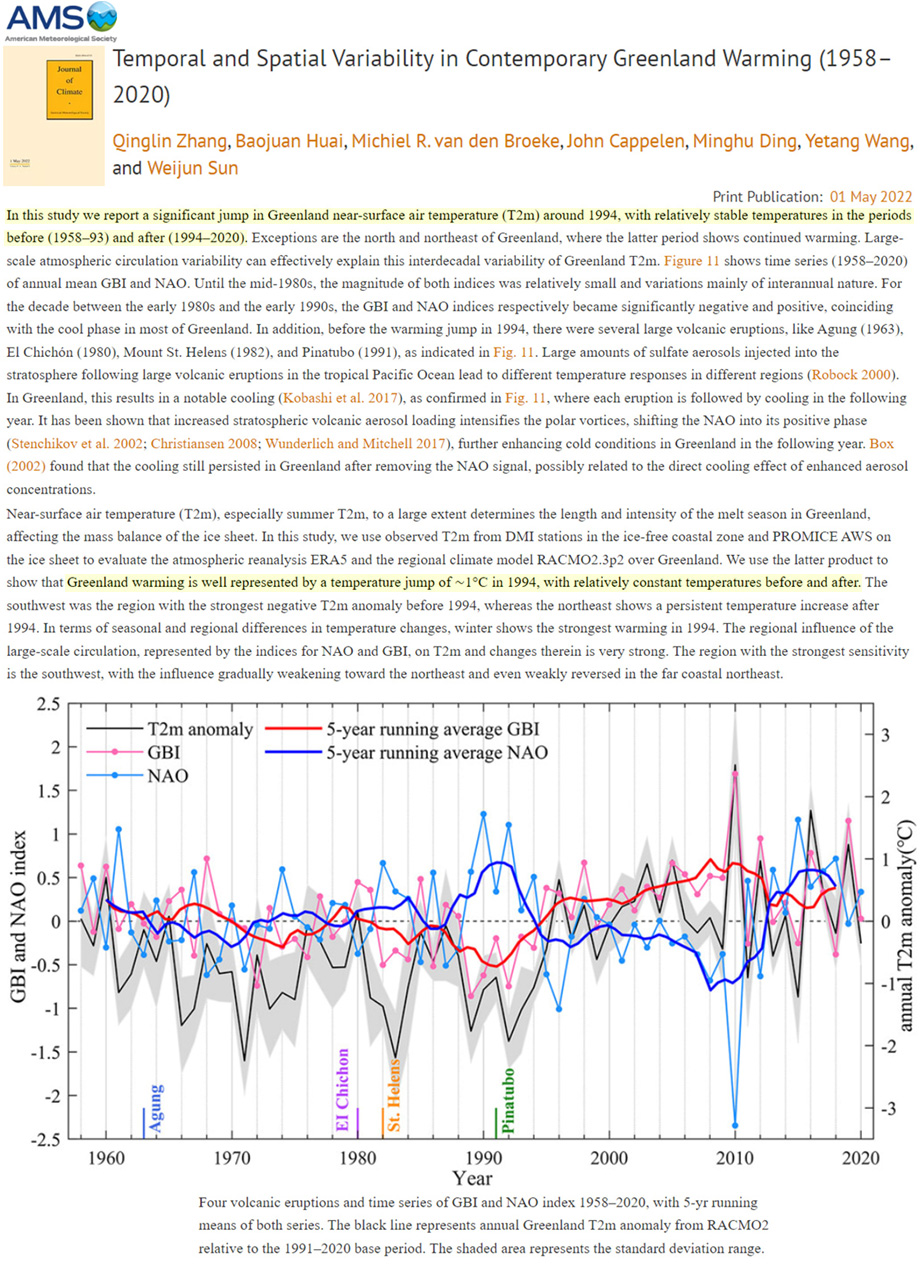
Greenland has been defying the narrative for decades now. After a brief, sharp warming from 1994 to the early 2000s, the mean annual land surface temperatures (LST) have been trendless since about 2003. Since 2012, Greenland has been cooling (Fang et al., 2023). Compare the colorized Greenland temperature trends lineup for 2007-2012 to the 2013-2020 period (bottom).
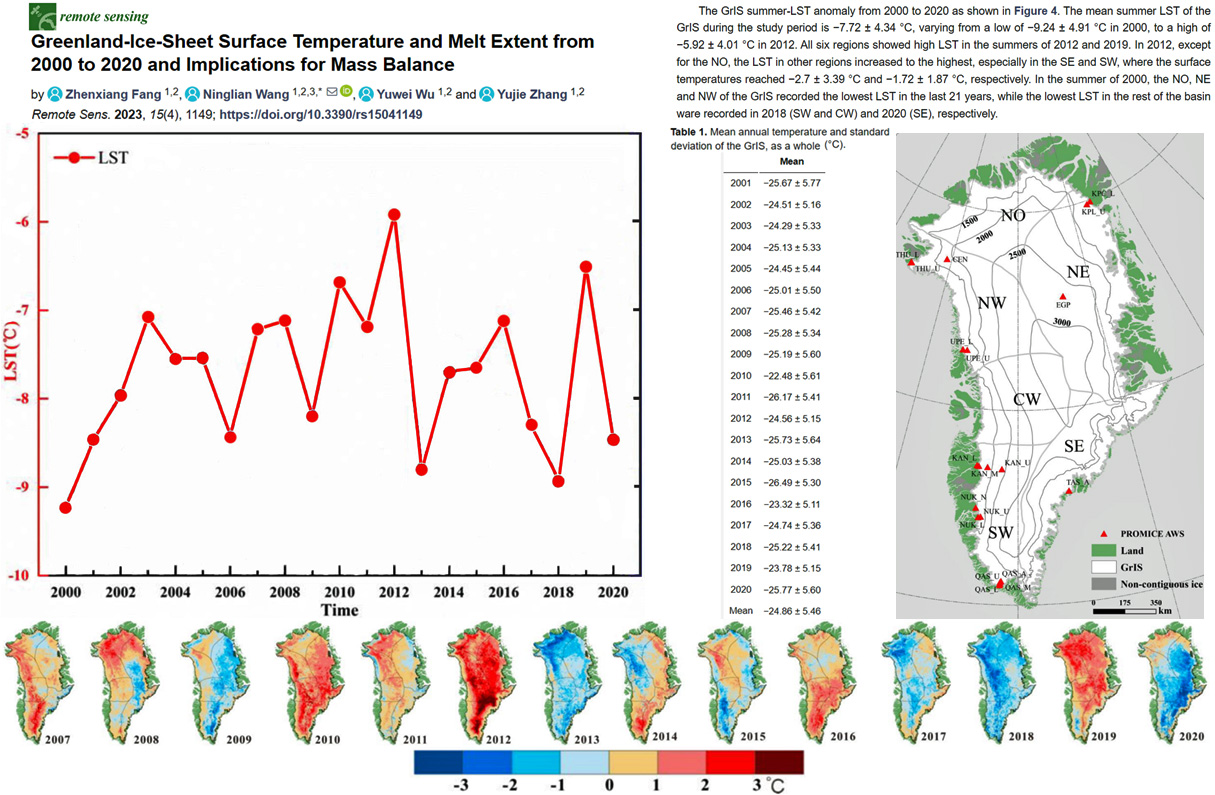
Image Source: Fang et al., 2023
A trendless temperature record also manifests as non-significant change in melt extent as a percentage of surface area as well as the the mass balance for the whole ice sheet, especially from about 2005 onwards.
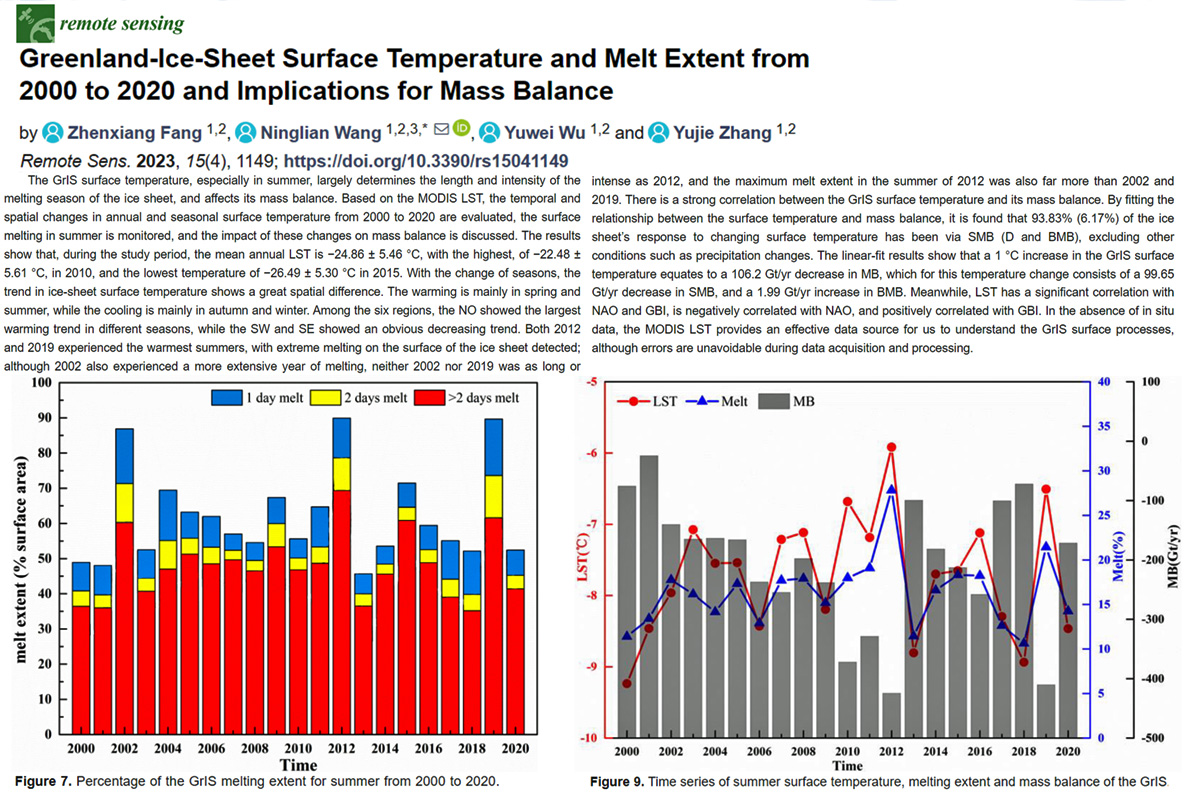
Image Source: Fang et al., 2023
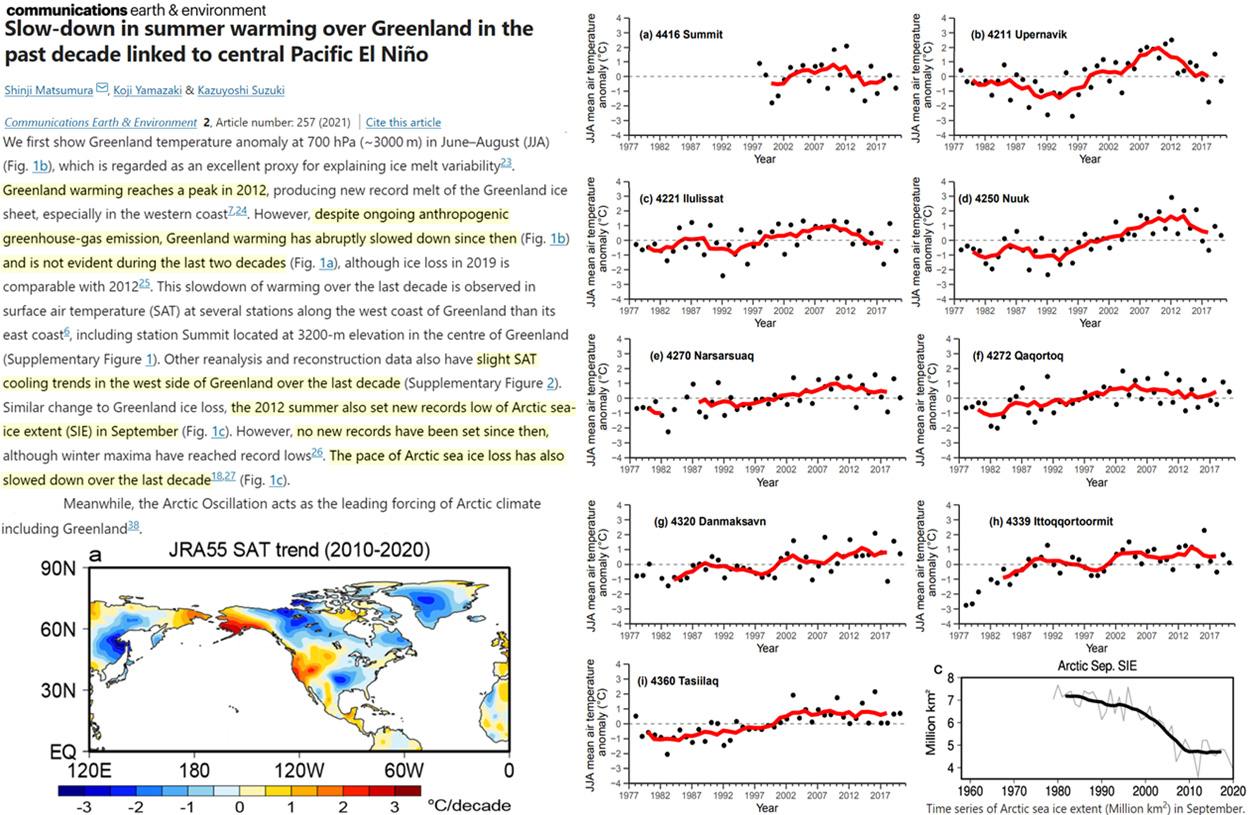
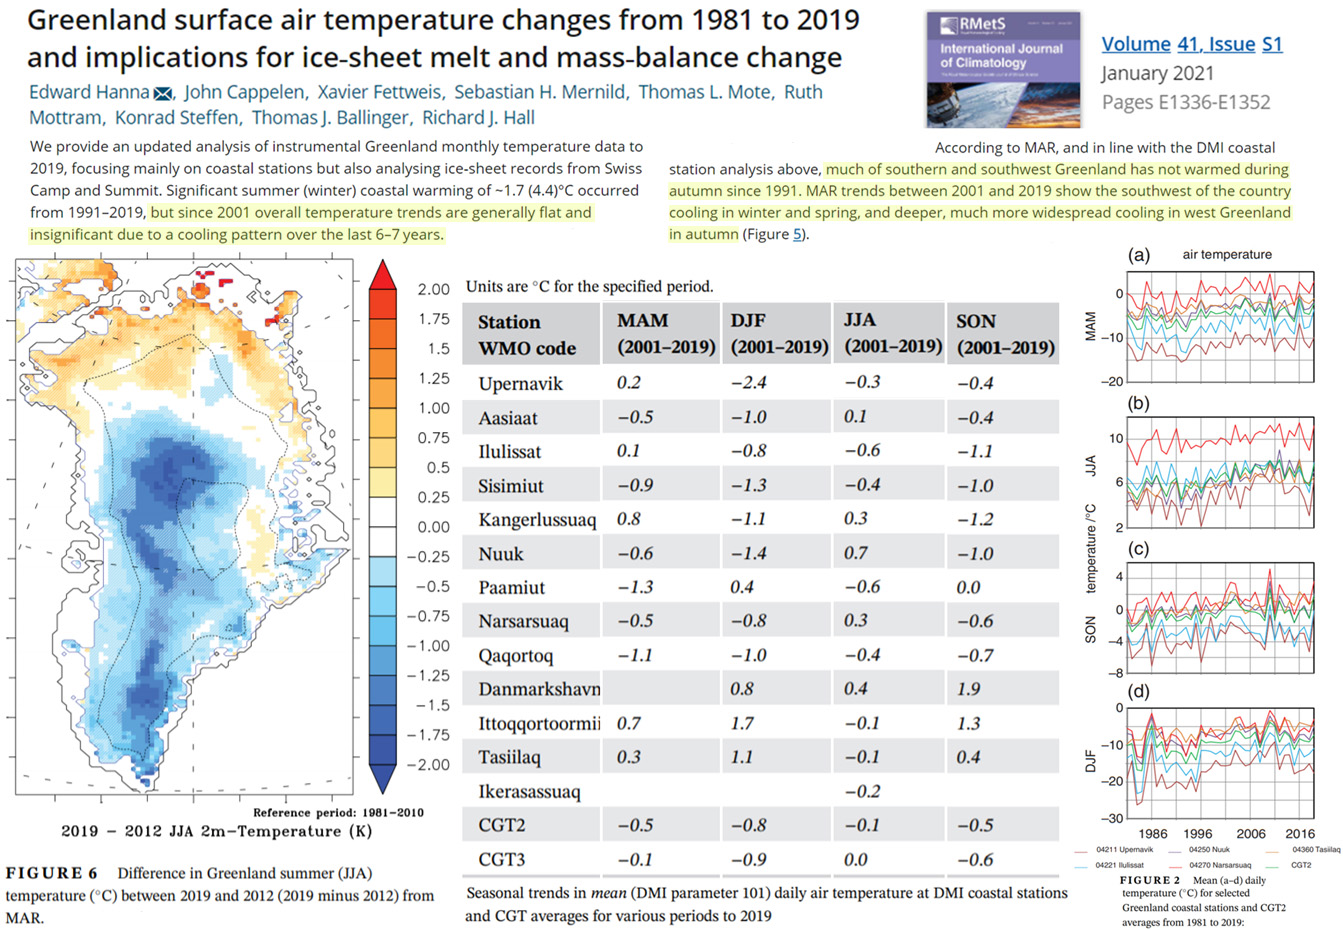
Other scientists have also reported Greenland warming “is not evident” (Matsumura et al., 2022) in recent decades. Instead, temperature stations document net cooling trends from 2001-2019 (Hanna et al., 2021).

