
Climate Activist Professor Dessler seeks to eliminate record-breaking 1930s EPA heatwave chart
https://notalotofpeopleknowthat.wordpress.com/2022/06/22/no-andy-epa-are-not-cherry-picking/
No Andy, EPA Are Not Cherry Picking
By Paul Homewood
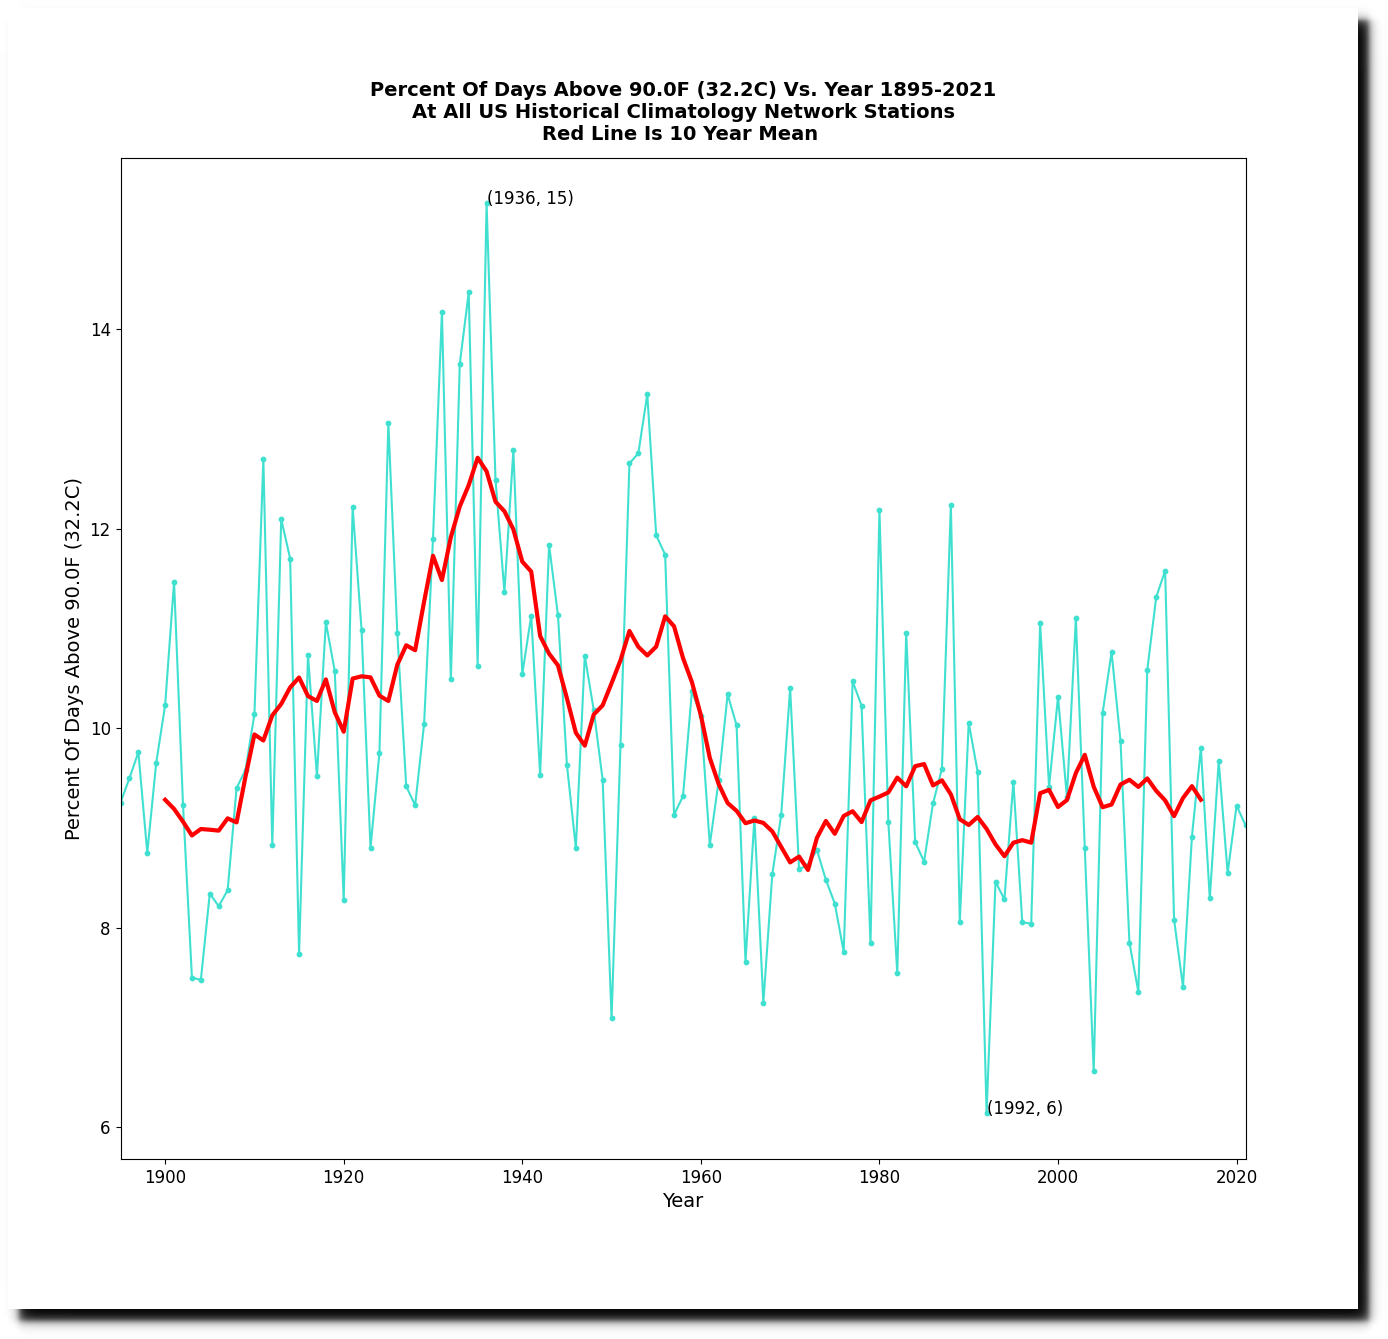
Andy “Don’t Believe The Data” Dessler claims that the EPA heatwave index is cherry-picked, because it is based on 90th percentiles:

https://twitter.com/AndrewDessler/status/1429099366250434562?s=20&t=jbrp-SxXqW7qPBDy9FK5CQ
He prefers 95% percentiles, which he claims are not cherry-picking!

Only one slight problem, Andy!
The EPA have also looked at 95%, and come to the same conclusions as before; there has been a marked decline in heatwaves for most of the US:

https://www.epa.gov/climate-indicators/climate-change-indicators-high-and-low-temperatures
Note that the trend is measured from 1948, so the extreme heat of the 1930s is not even reflected here.
There is one other consideration here. Dessler has also used Berkeley Earth homogenised dataset (BEST). His calculations indicate just how divorced from reality BEST is, with temperatures far above what the actual data suggest.
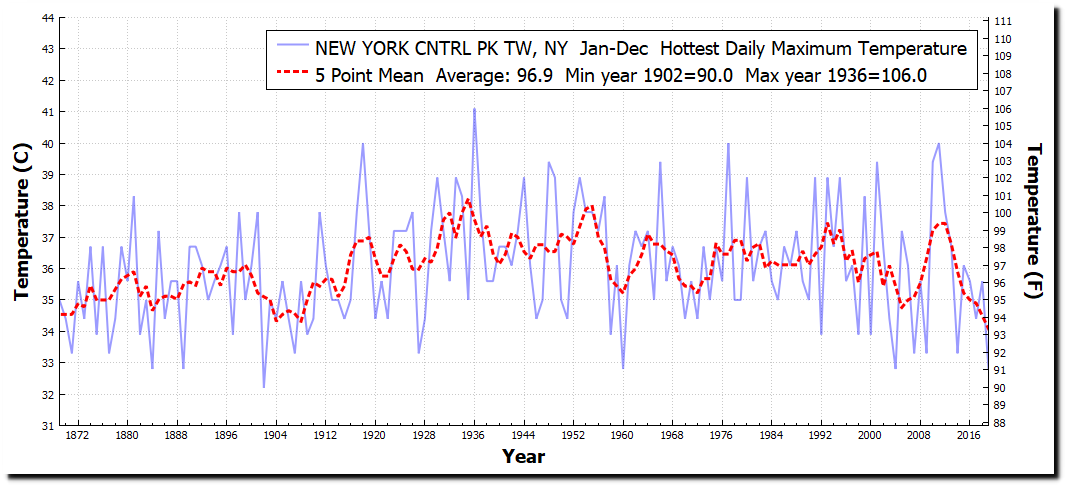
Finally, let’s look back to the graph for Texas, which I showed in my earlier post:

Note that the average of “hot days” is 20 a year – in other words, 95% percentile to all intents and purposes.
On all counts, Dessler’s own analysis is fake.
https://notalotofpeopleknowthat.wordpress.com/2022/06/22/who-needs-facts-andy/
Who Needs Facts, Andy?
By Paul Homewood
So this is what climate science has sunk to!

https://twitter.com/AndrewDessler/status/1429099366250434562?s=20&t=jbrp-SxXqW7qPBDy9FK5CQ
Andrew Dessler is Professor of Atmospheric Sciences & climate “scientist” at Texas A&M.
There was time when science was about facts and truths. Now it seems that climate science is not interested in data but feelings.
The chart he disparages has been used as a long-term indicator of US heatwaves for several years by the EPA. Moreover, it tallies with other official charts published in the National Climate Assessment in 2017:


Heat waves (6-day periods with a maximum temperature above the 90th percentile for 1961–1990) increased in frequency until the mid-1930s, became considerably less common through the mid-1960s, and increased in frequency again thereafter (Figure 6.4). As with warm daily temperatures, heat wave magnitude reached a maximum in the 1930s
https://science2017.globalchange.gov/chapter/6/
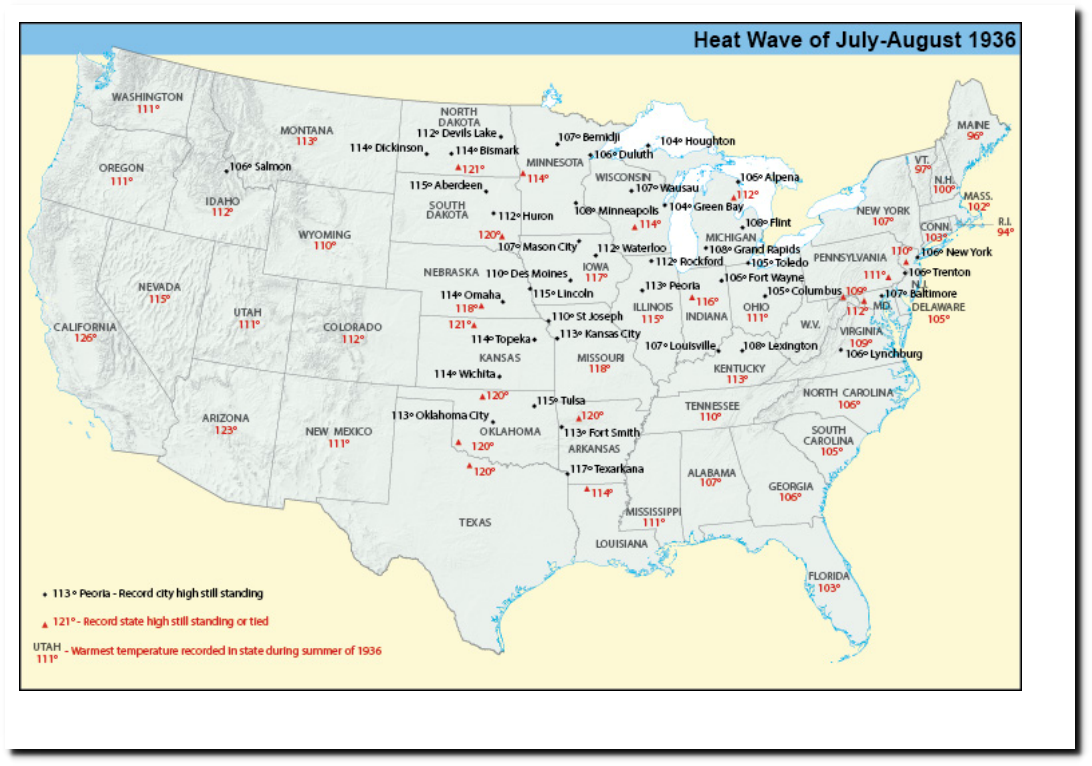
The vast majority of State record high temperatures were set in the 1930s, notable 1936:

We can also drill down to individual States, such as Dessler’s own Texas:

https://statesummaries.ncics.org/chapter/tx/
And his own part of Texas:
")
")
http://climod2.nrcc.cornell.edu/
But hey Andy, who needs facts?
#
https://realclimatescience.com/2022/06/dessler-wants-to-erase-the-1930s/
Dessler Erases The 1930s

National Climate Assessment
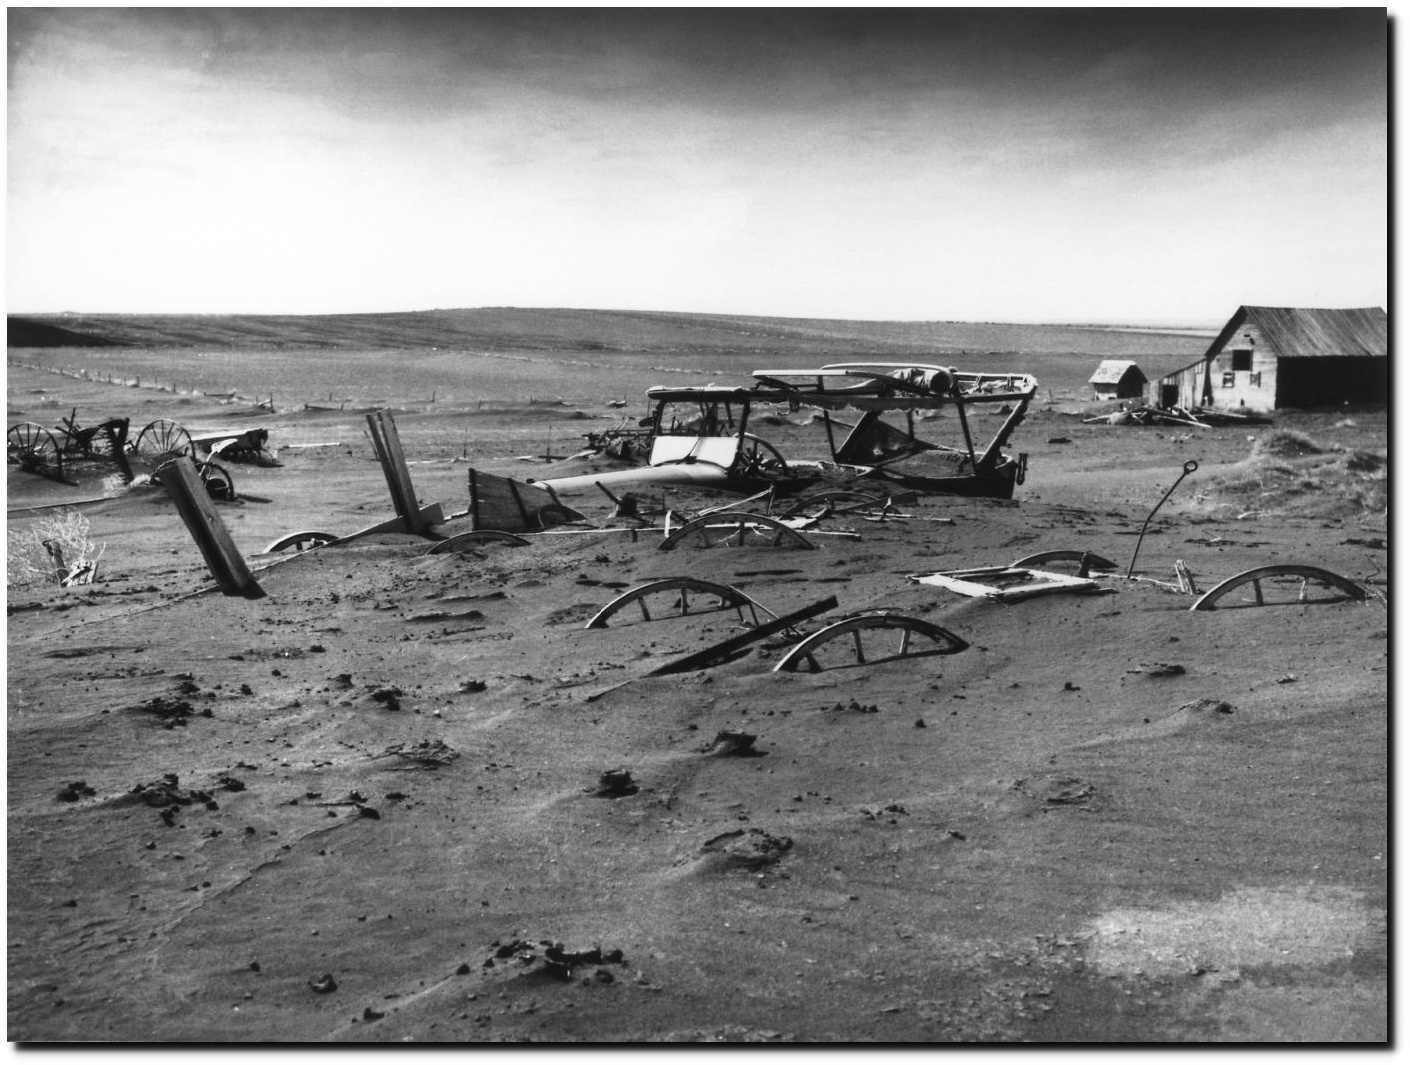
“the warmest daily temperature of the year increased in some parts of the West over the past century (Figure 6.3), but there were decreases in almost all locations east of the Rocky Mountains. In fact, all eastern regions experienced a net decrease (Table 6.2), most notably the Midwest (about 2.2°F [1.2°C]) and the Southeast (roughly 1.5°F [0.8°C]). The decreases in the eastern half of Nation, particularly in the Great Plains, are mainly tied to the unprecedented summer heat of the 1930s Dust Bowl era”

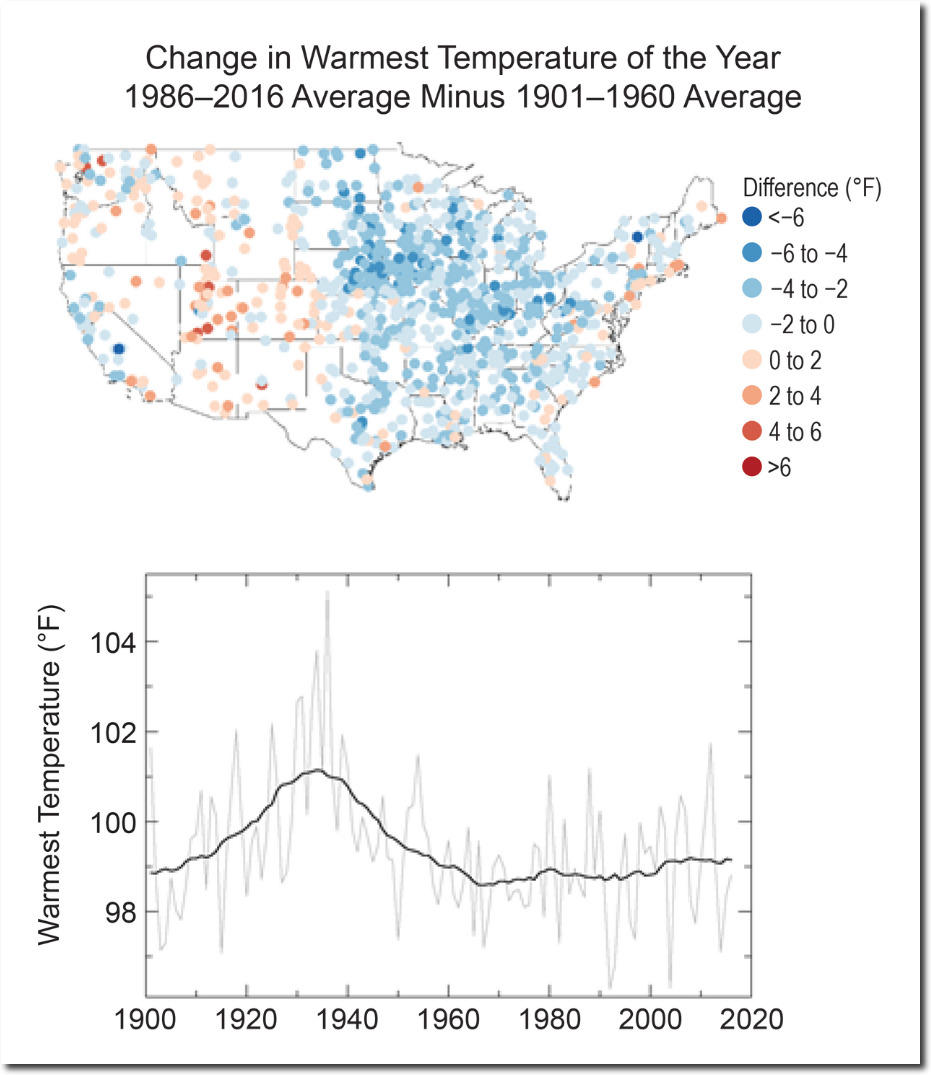
Temperature Changes in the United States – Climate Science Special Report


National Report on Sustainable Forests — 2010
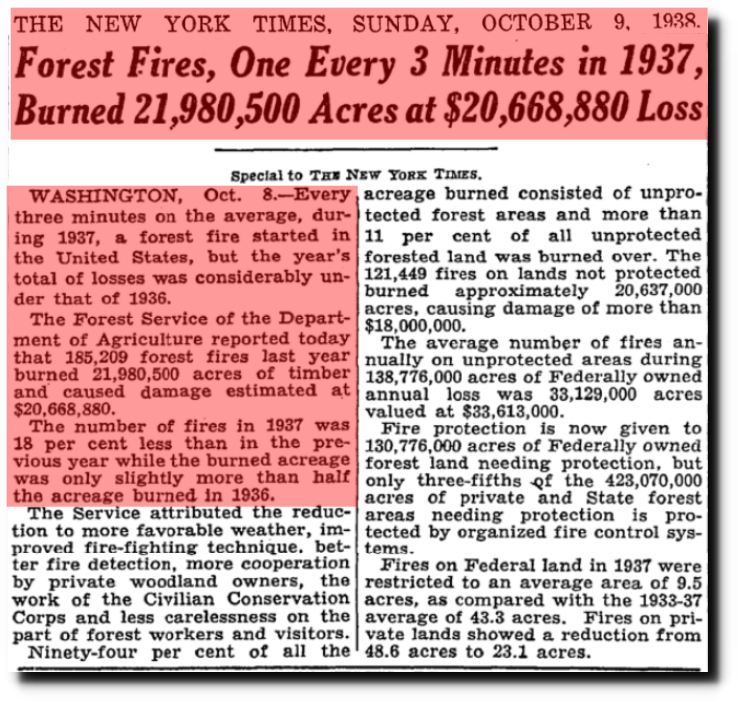
TimesMachine: October 9, 1938 – NYTimes.com
Twenty-four states set their temperature record during the 1930s.
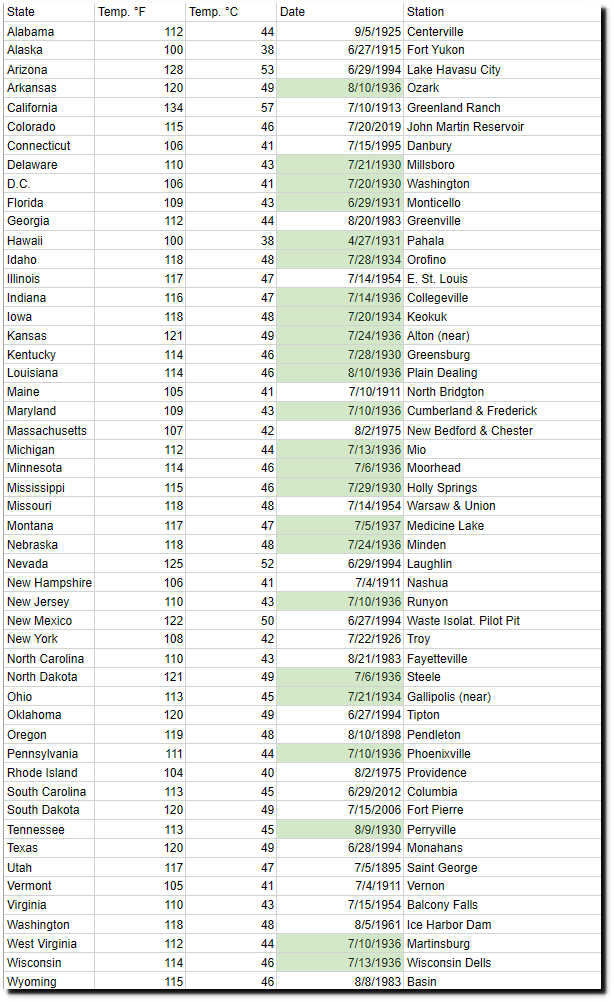
Record Highest Temperatures by State
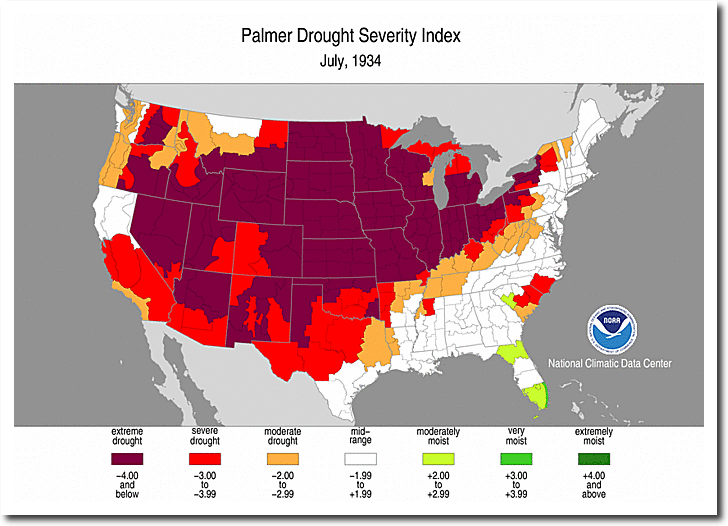
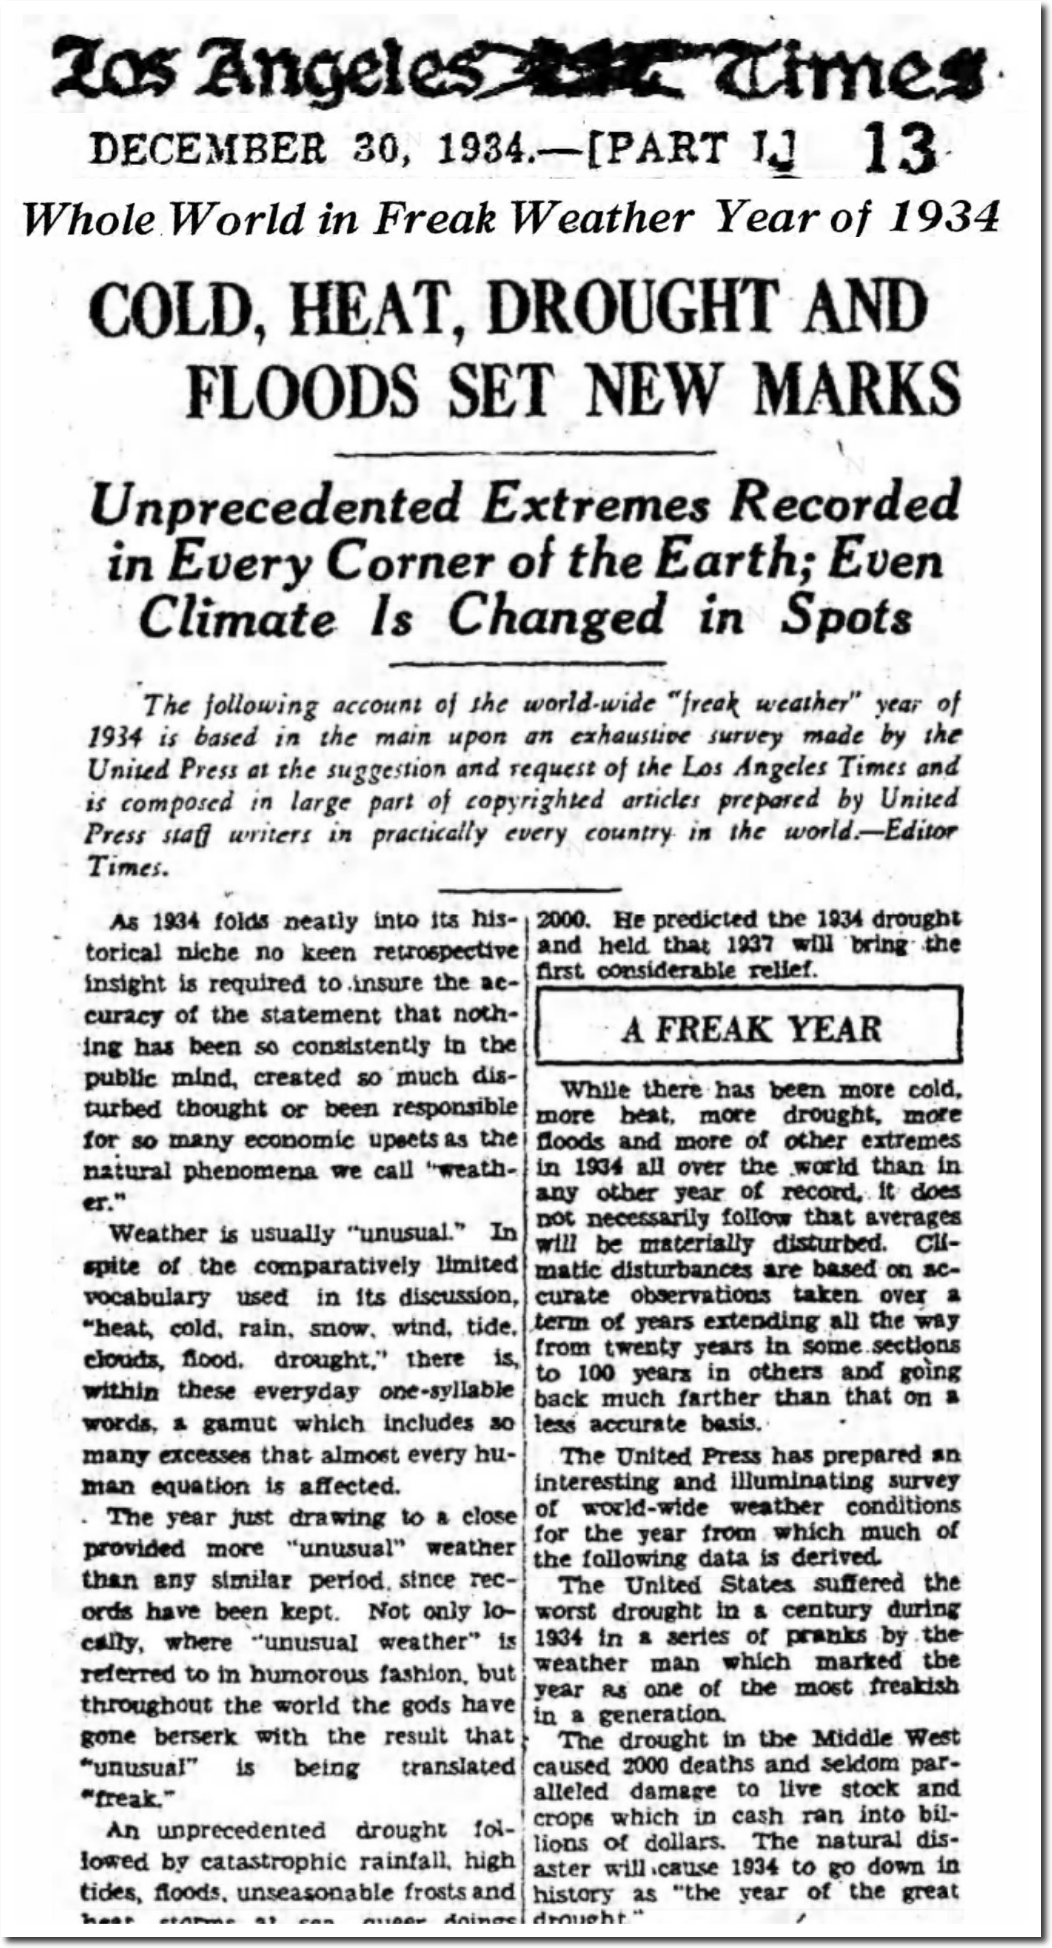
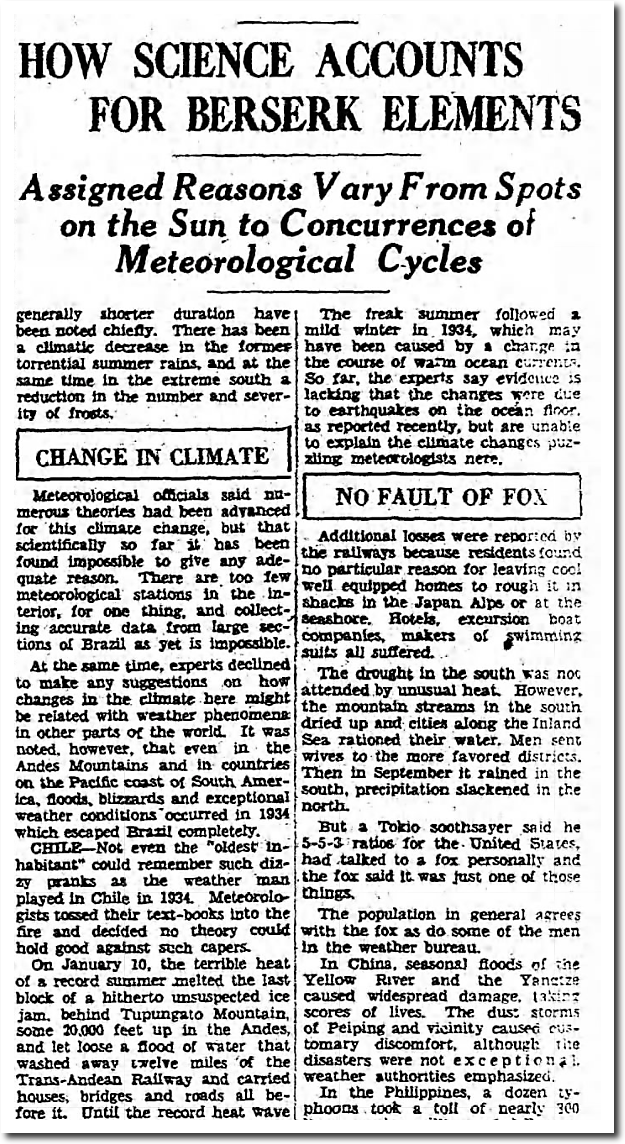
1934 and 1936 were unprecedented years for heat and drought in US. But the extreme weather wasn’t just in the US – it was global. Click on the 1934 LA Times below to see it full sized.
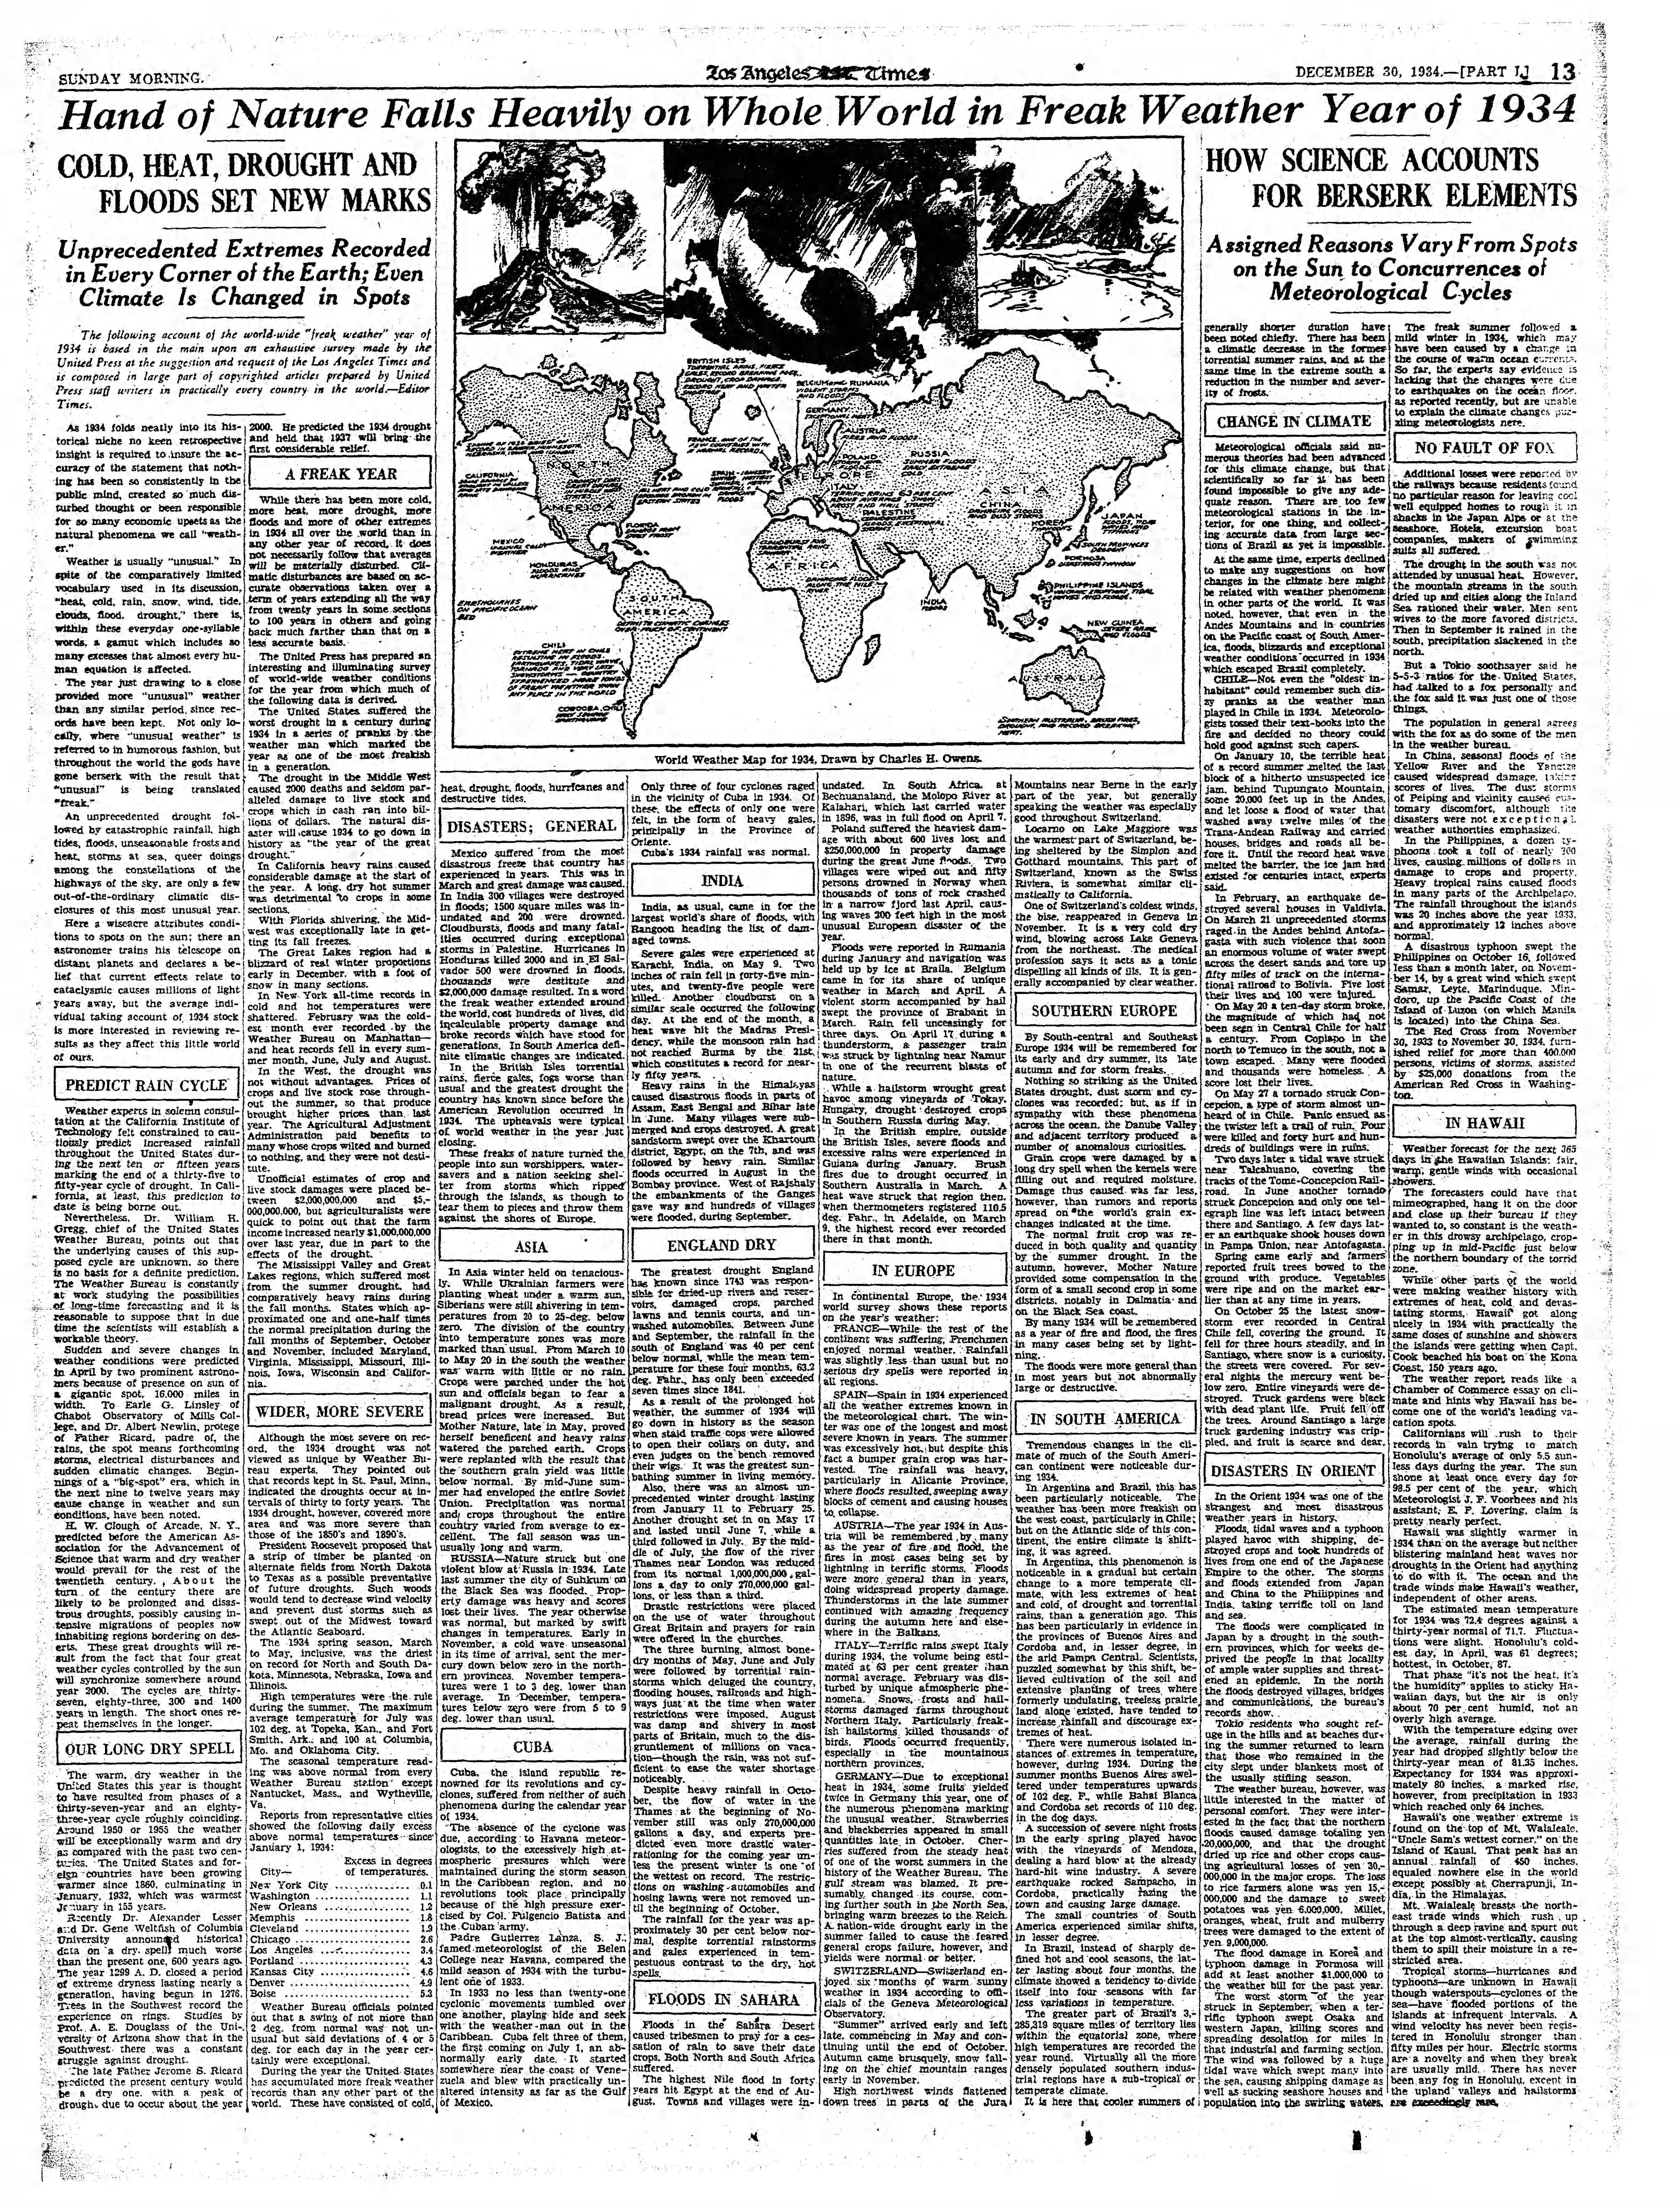
30 Dec 1934, Page 13 – The Los Angeles Times at Newspapers.com
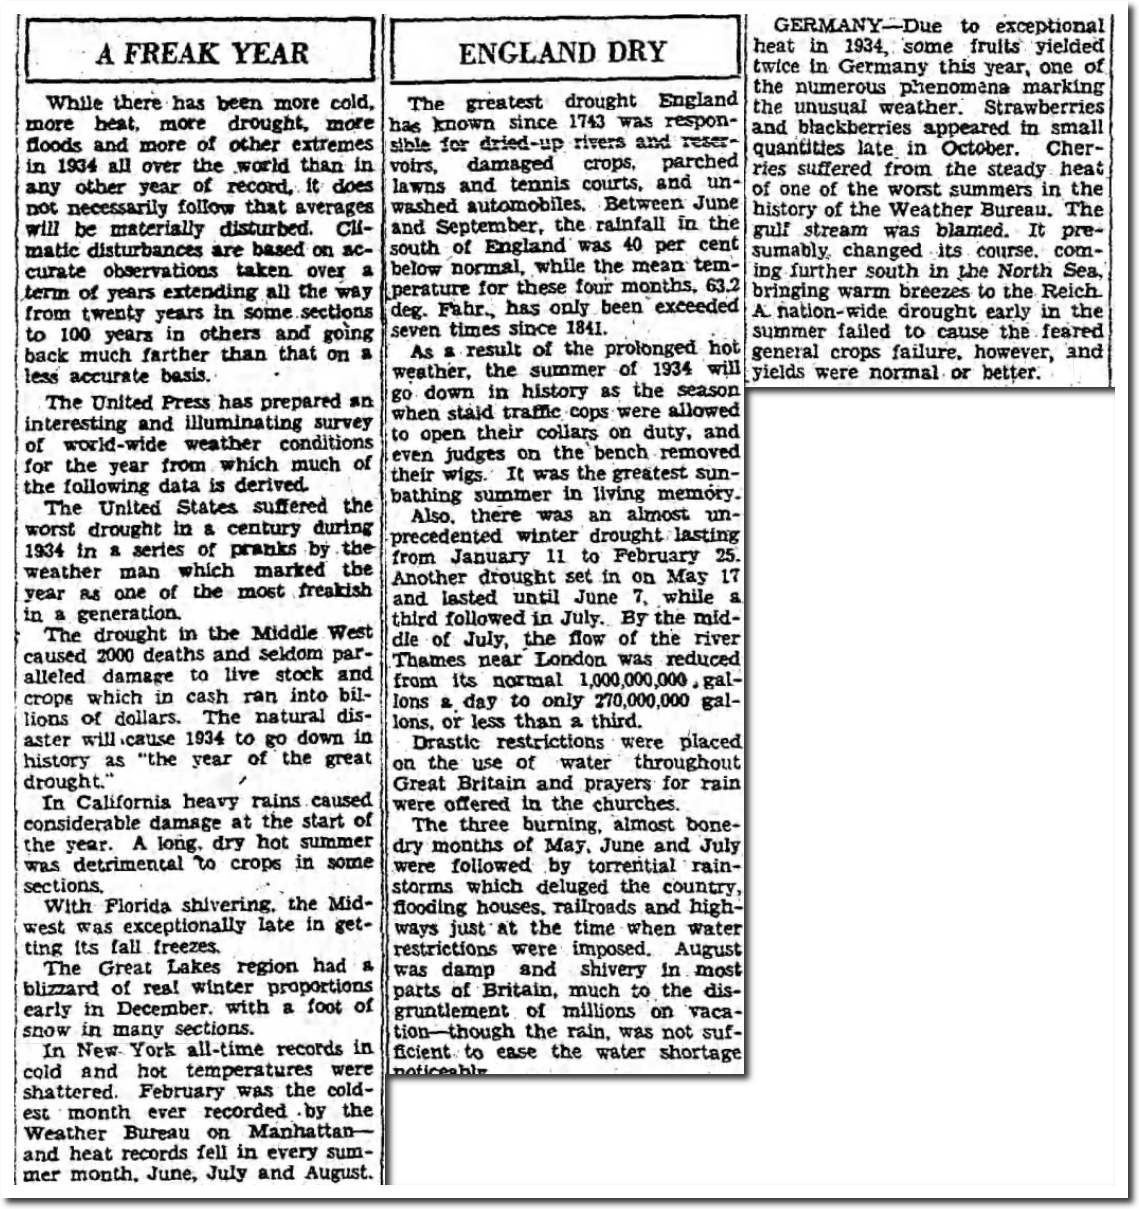
During 1934, the world experienced unprecedented drought and heat.
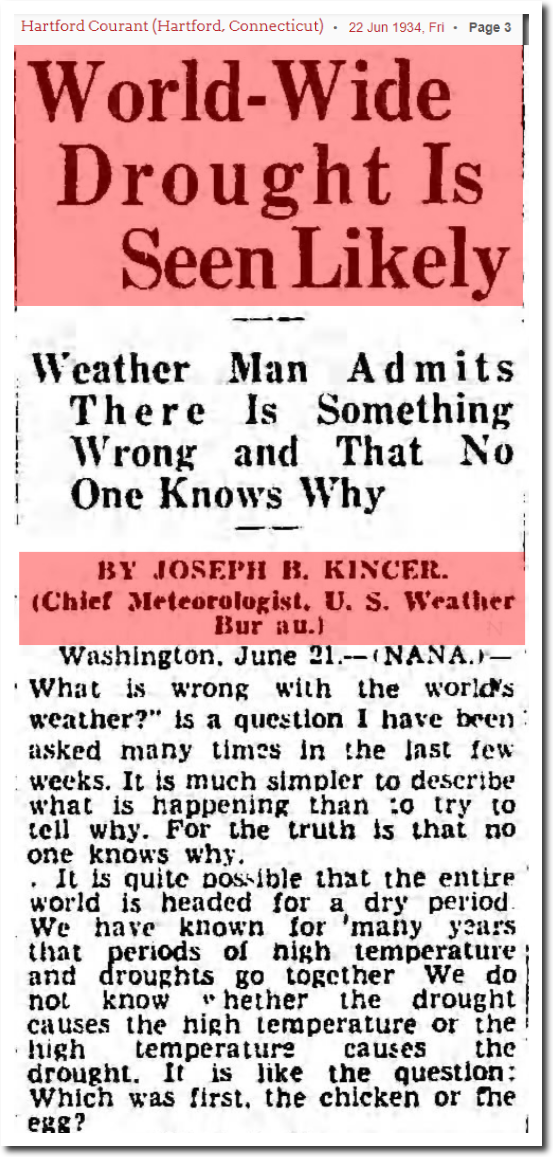
22 Jun 1934, Page 3 – Hartford Courant at Newspapers.com
THE CAIRNS POST, SATURDAY,” FEBRUARY 3, 1934.
“WORLD HEATING UP.” ‘ICE DISSOLVING AT POLES.’’ ‘‘SEA WILL RISE 40 PEET.’’
The world is gradually becoming both warmer and drier. One day the great Polar icecaps may melt—raising the level of the oceans from 40 to 50 feet, and wiping half of England from the map.”
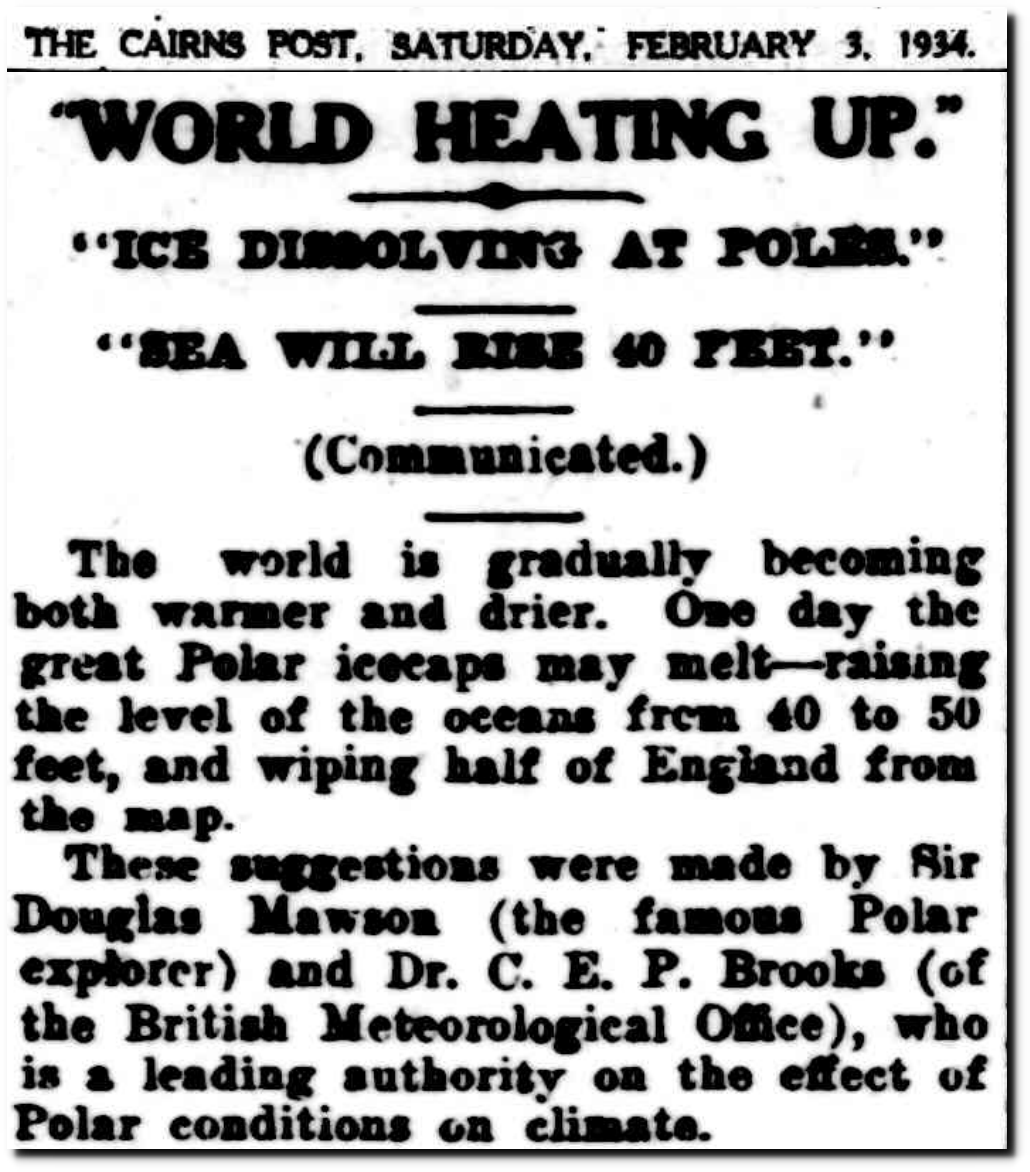
03 Feb 1934 – “WORLD HEATING UP.” – Trove
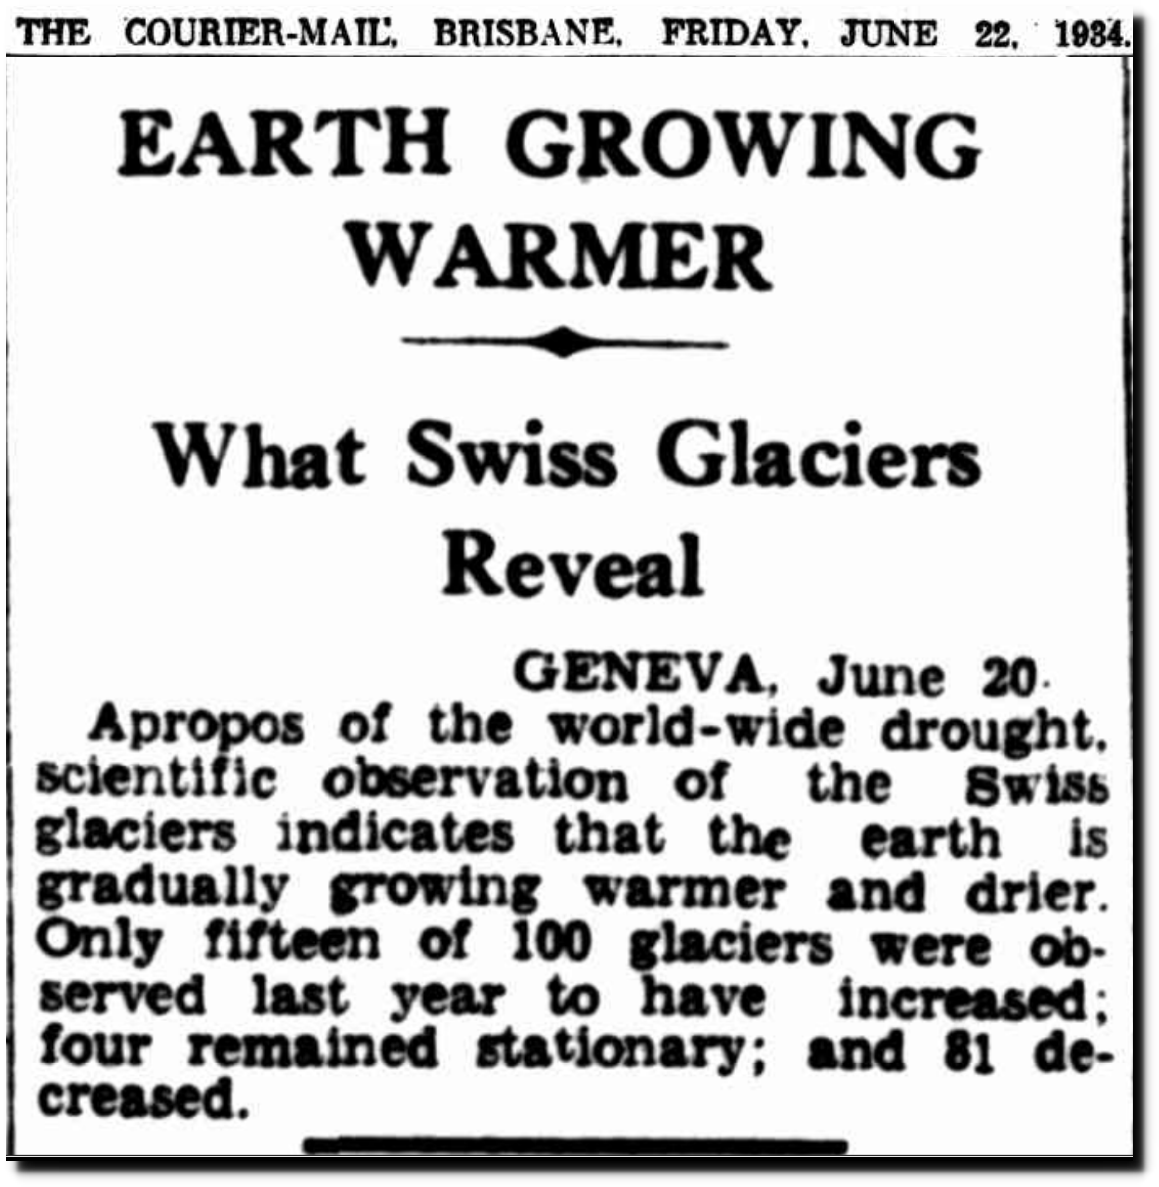 22 Jun 1934 – EARTH GROWING WARMER – Trove
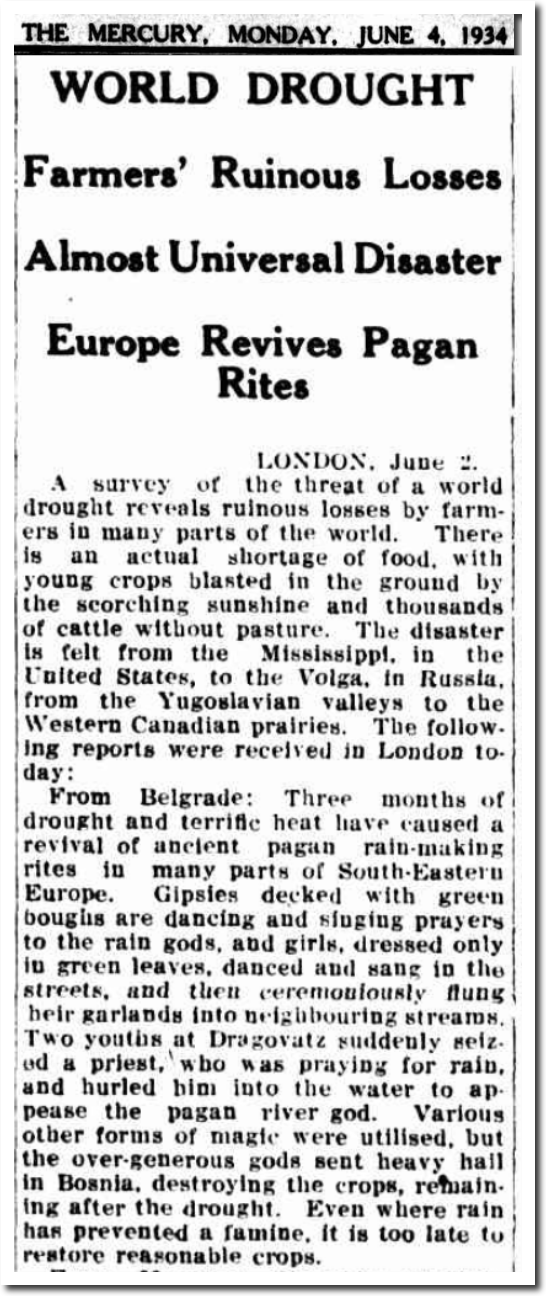
04 Jun 1934 – WORLD DROUGHT – Trove
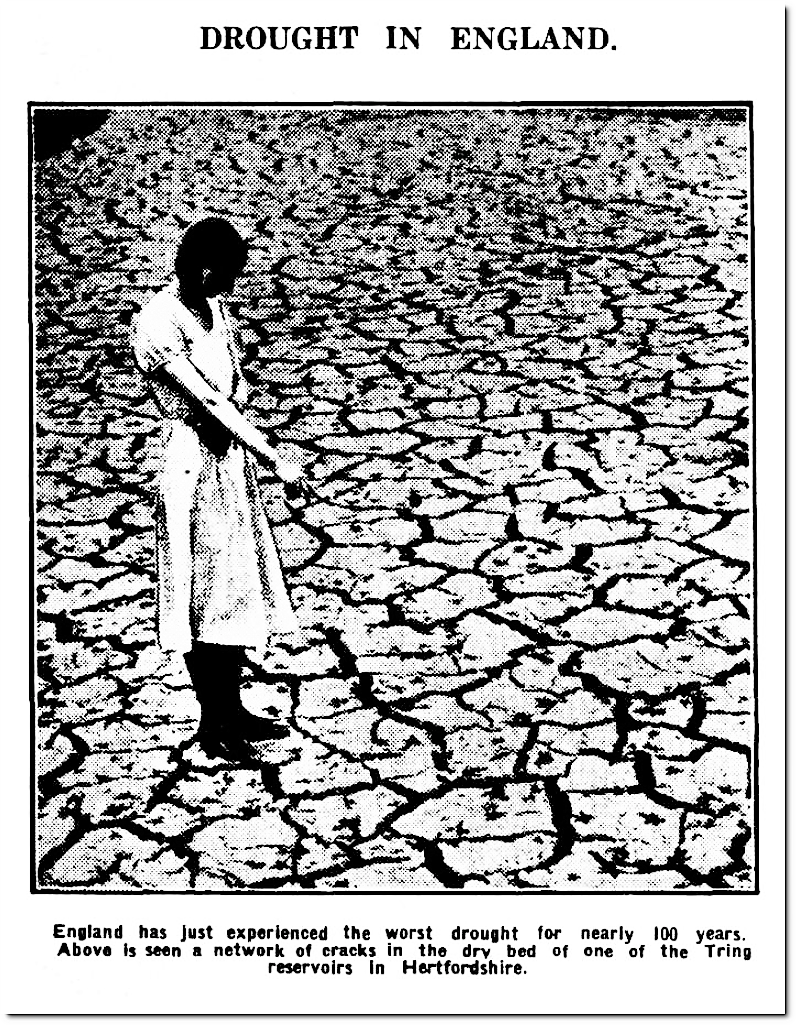
19 Jul 1934 – DROUGHT IN ENGLAND. – Trove
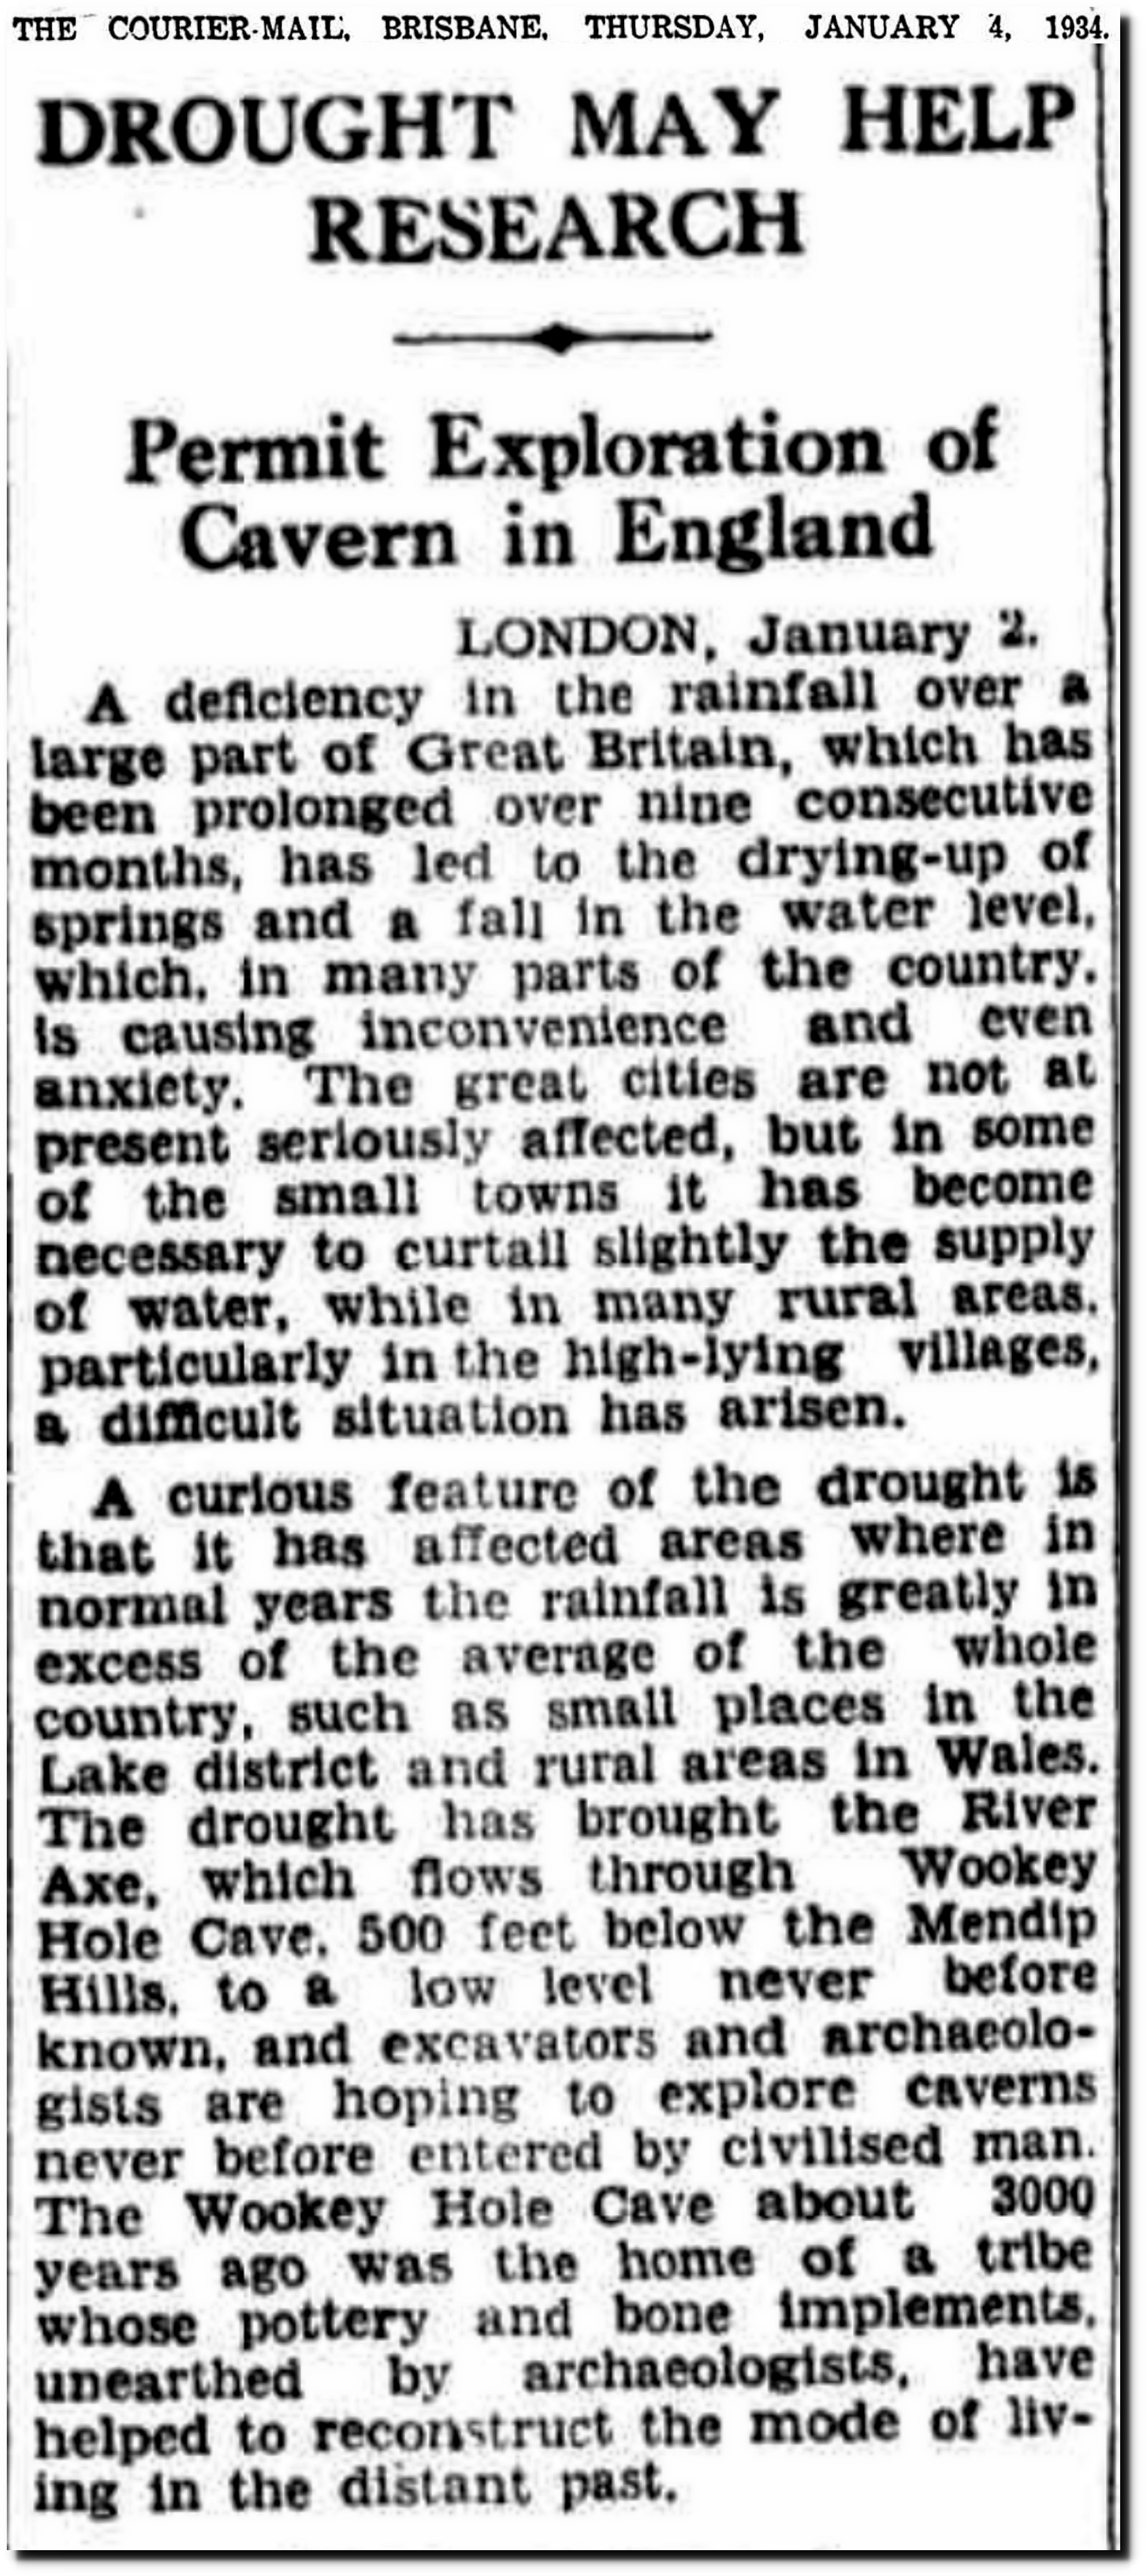
04 Jan 1934 – DROUGHT MAY HELP RESEARCH – Trove
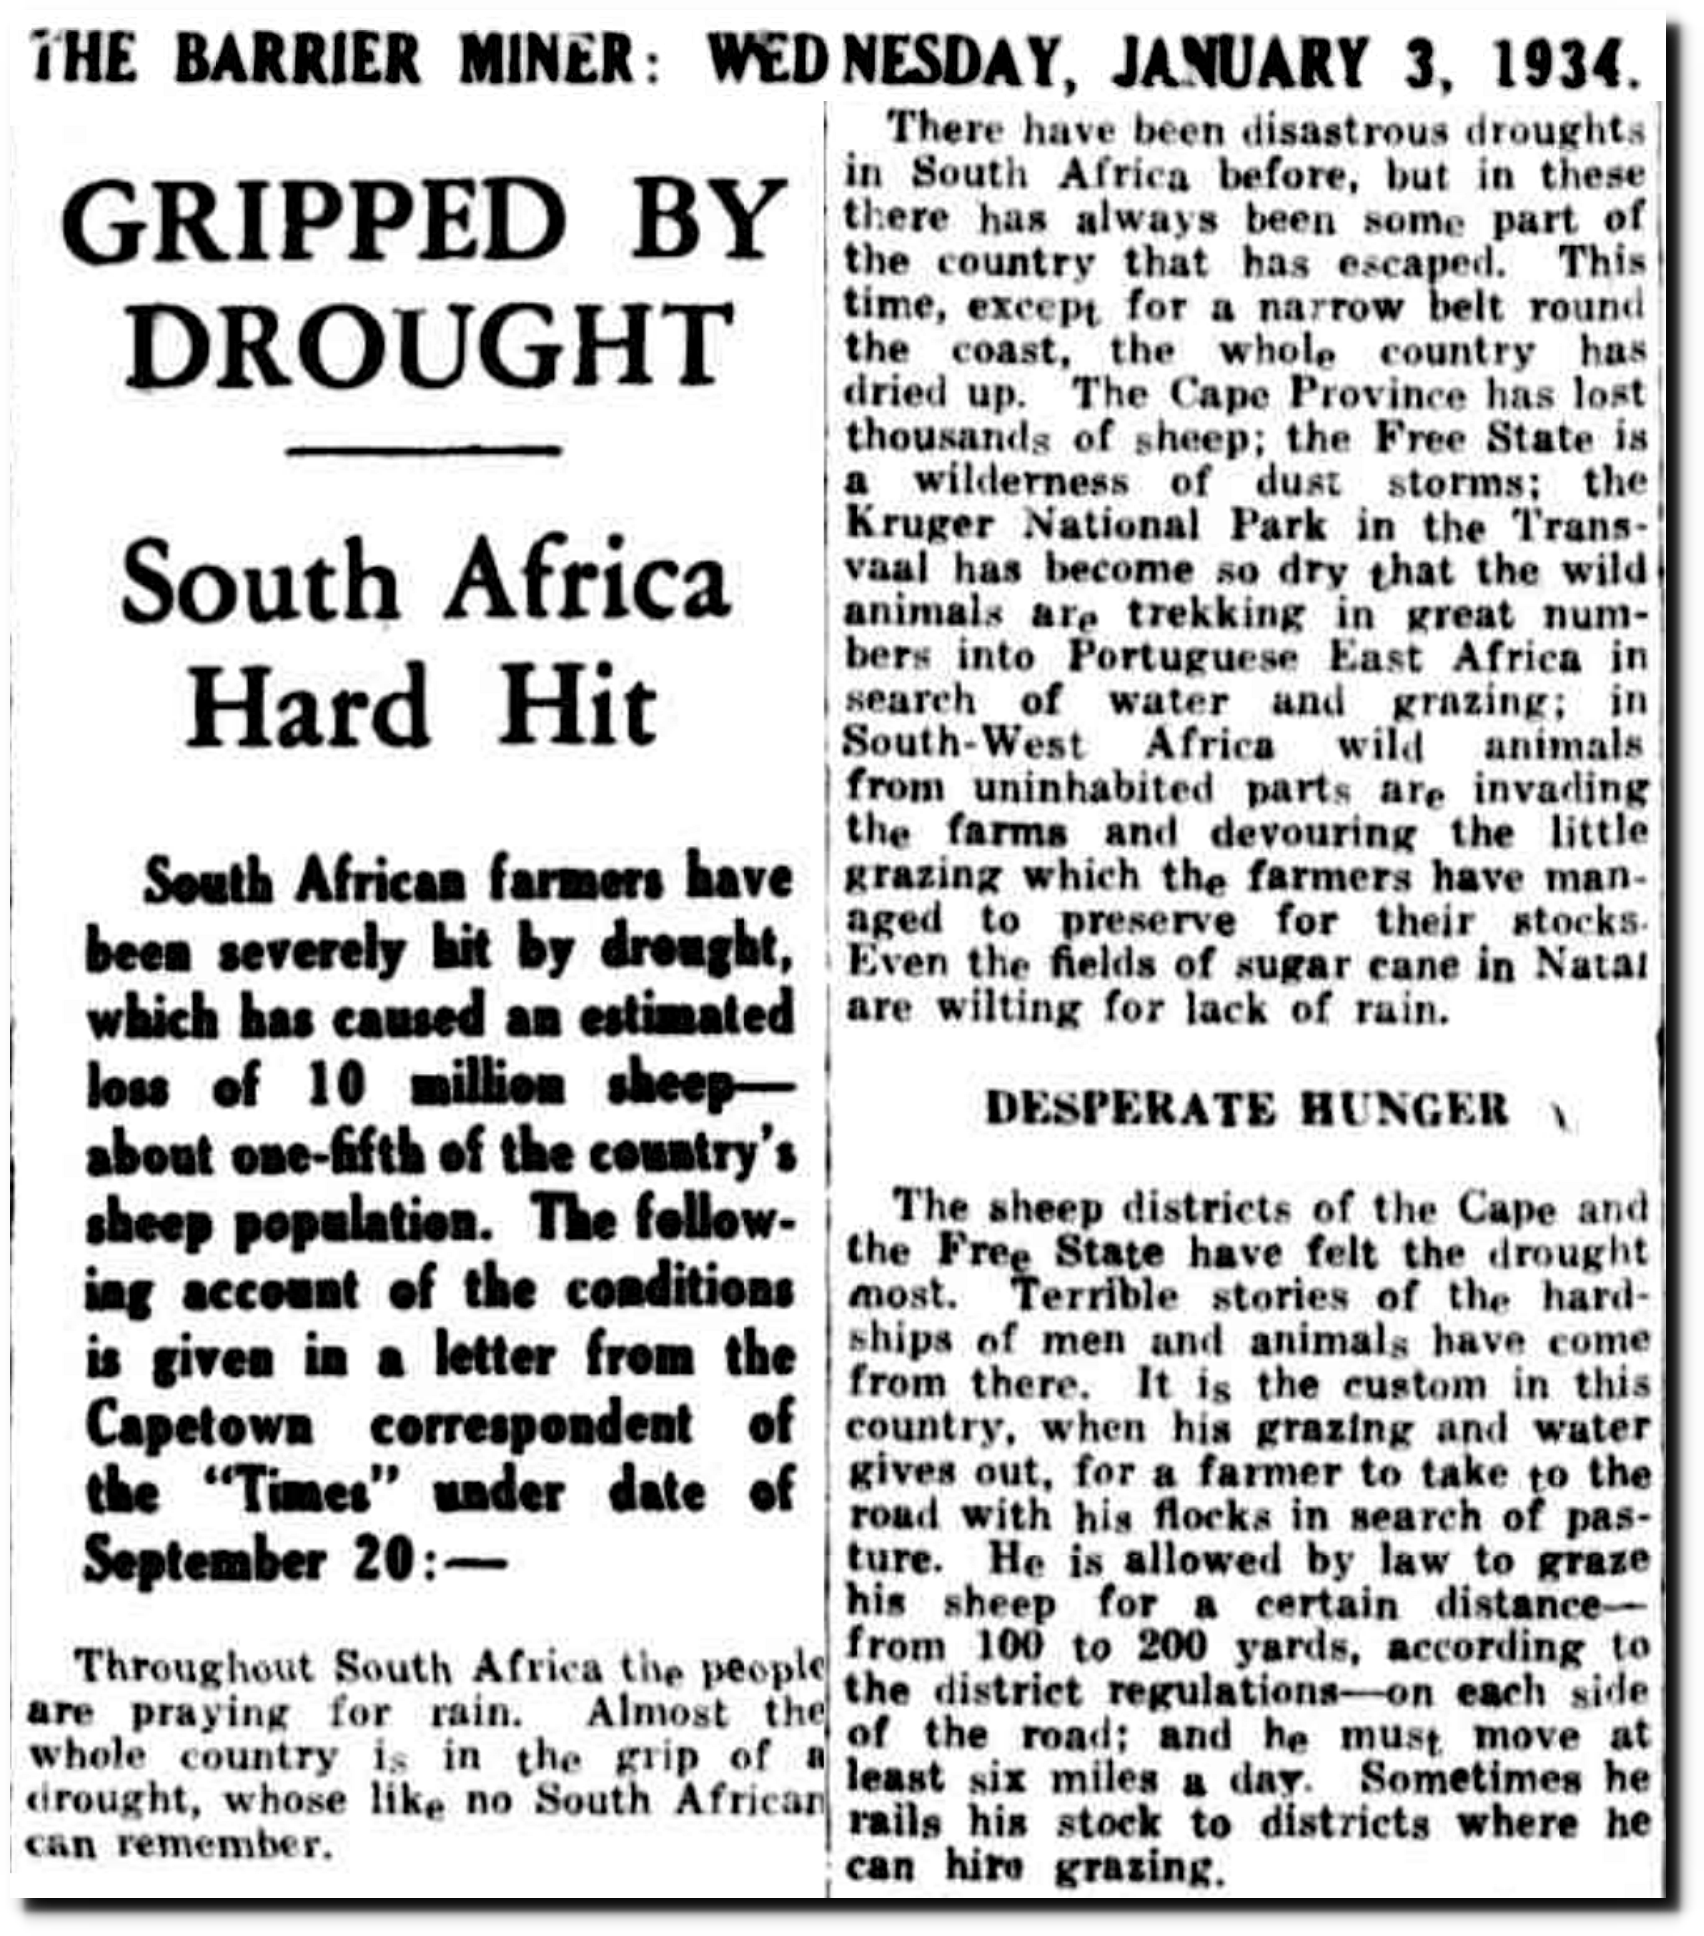
03 Jan 1934 – GRIPPED BY DROUGHT – Trove
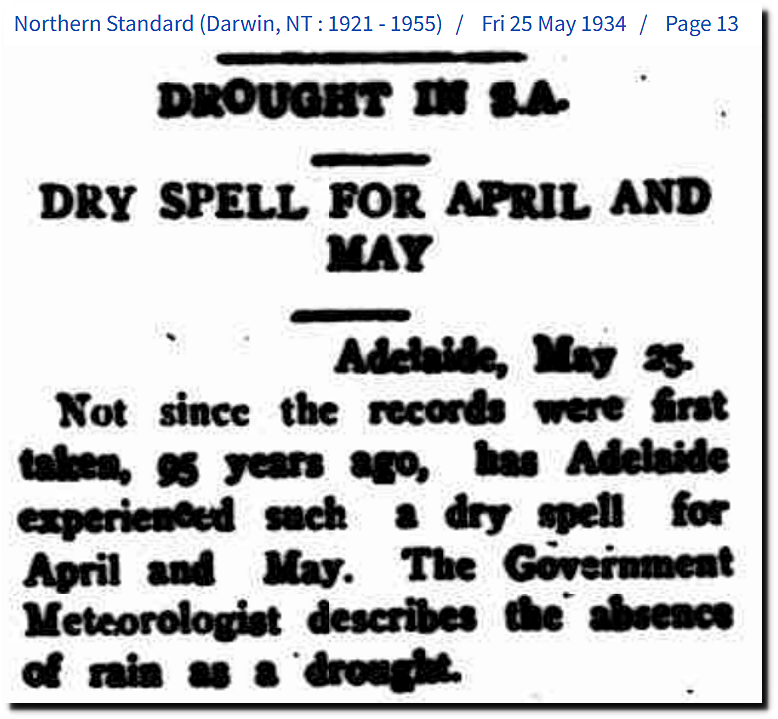
25 May 1934 – DROUGHT IN S.A. – Trove

31 May 1934 – CROP FAILURES IN RUSSIA – Trove

500,000 STARVING IN CHINA’S DROUGHT- The New York Times
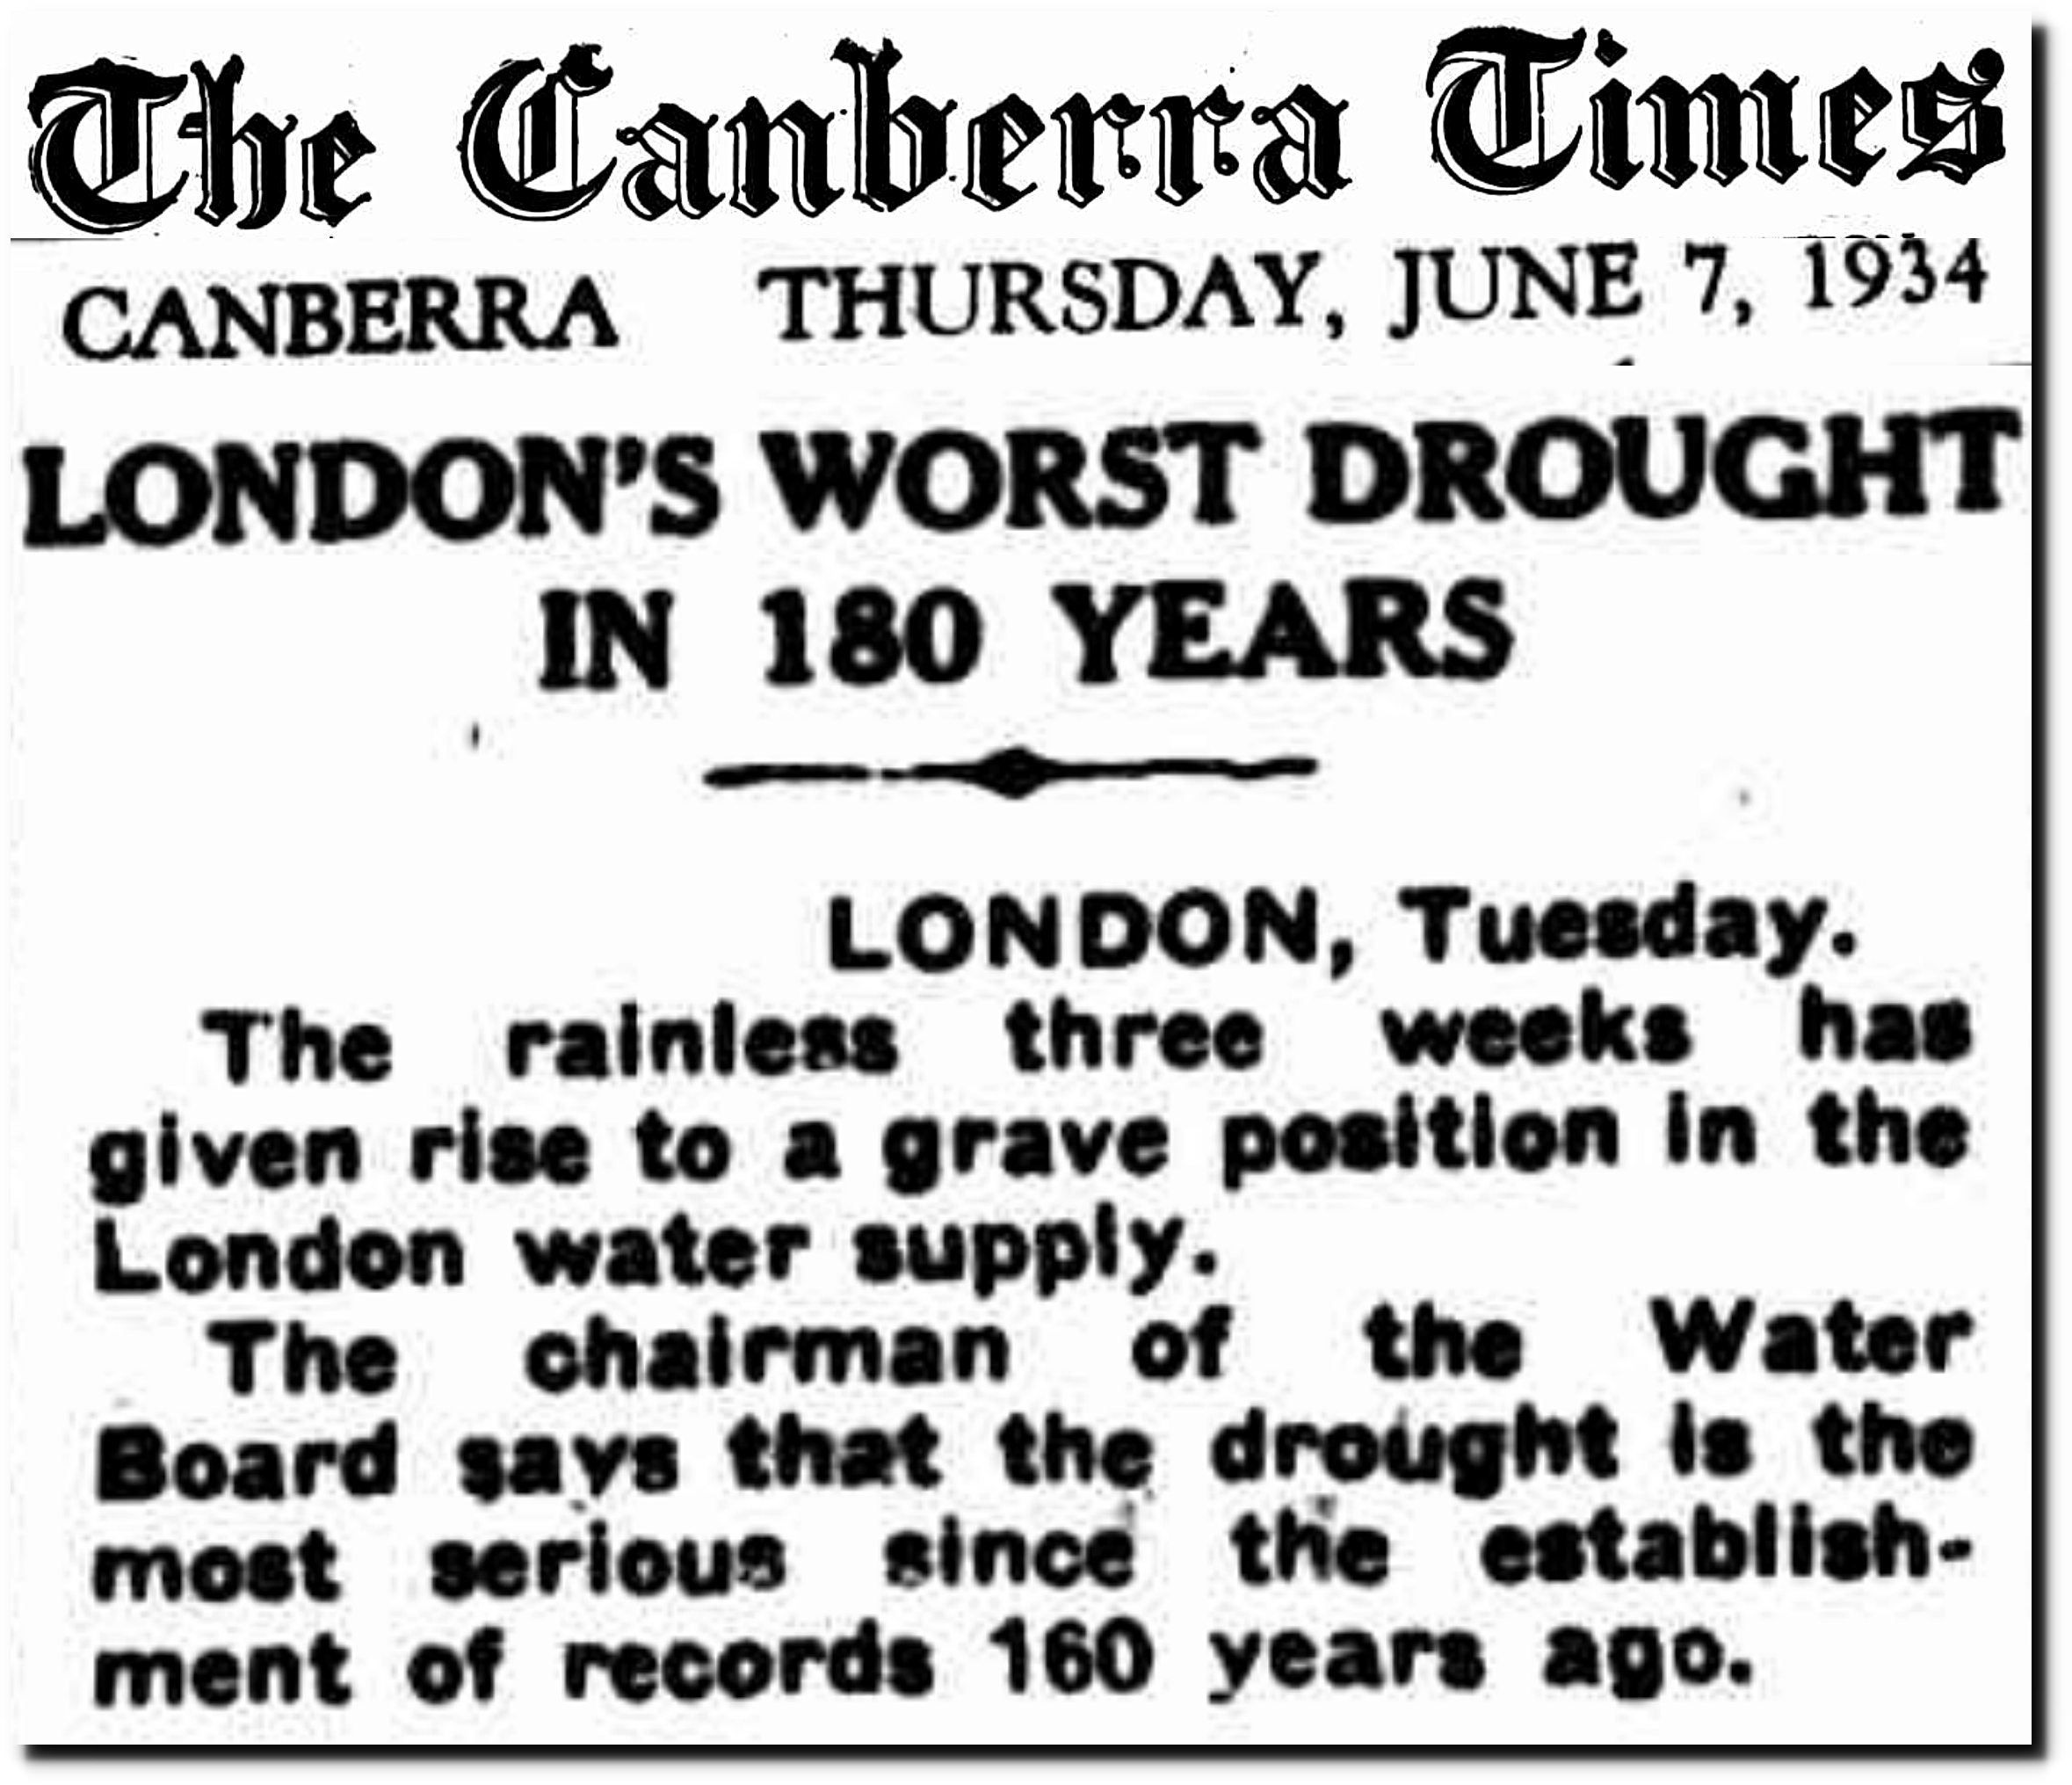 07 Jun 1934 – LONDON’S WORST DROUGHT IN 180 YEARS – Trove
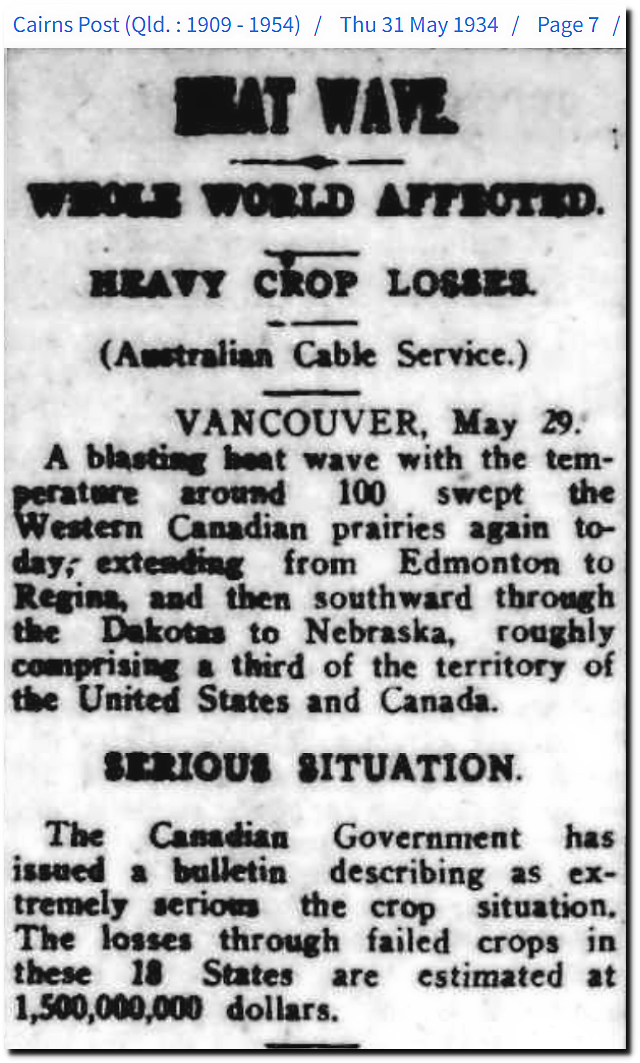
31 May 1934 – [?] WAVE. WHOLE WORLD AFFECTED. – Trove
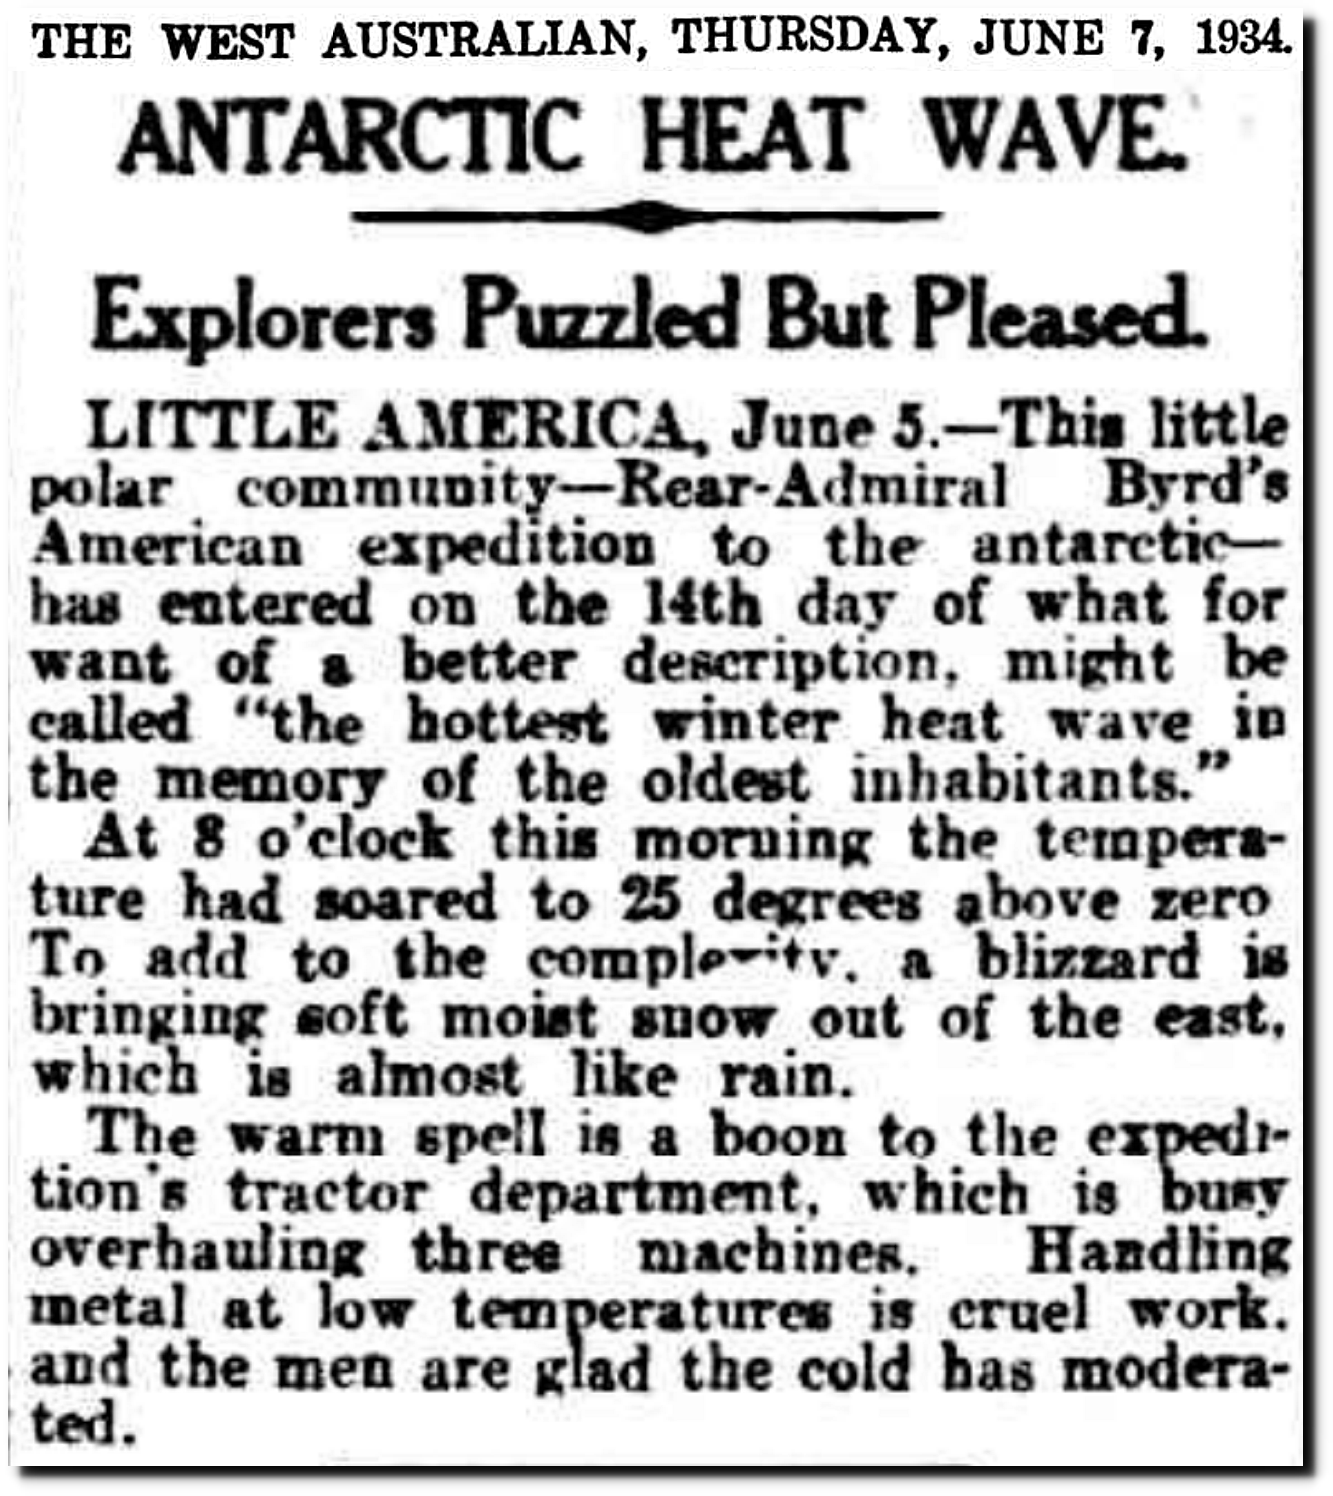 07 Jun 1934 – ANTARCTIC HEAT WAVE. – Trove
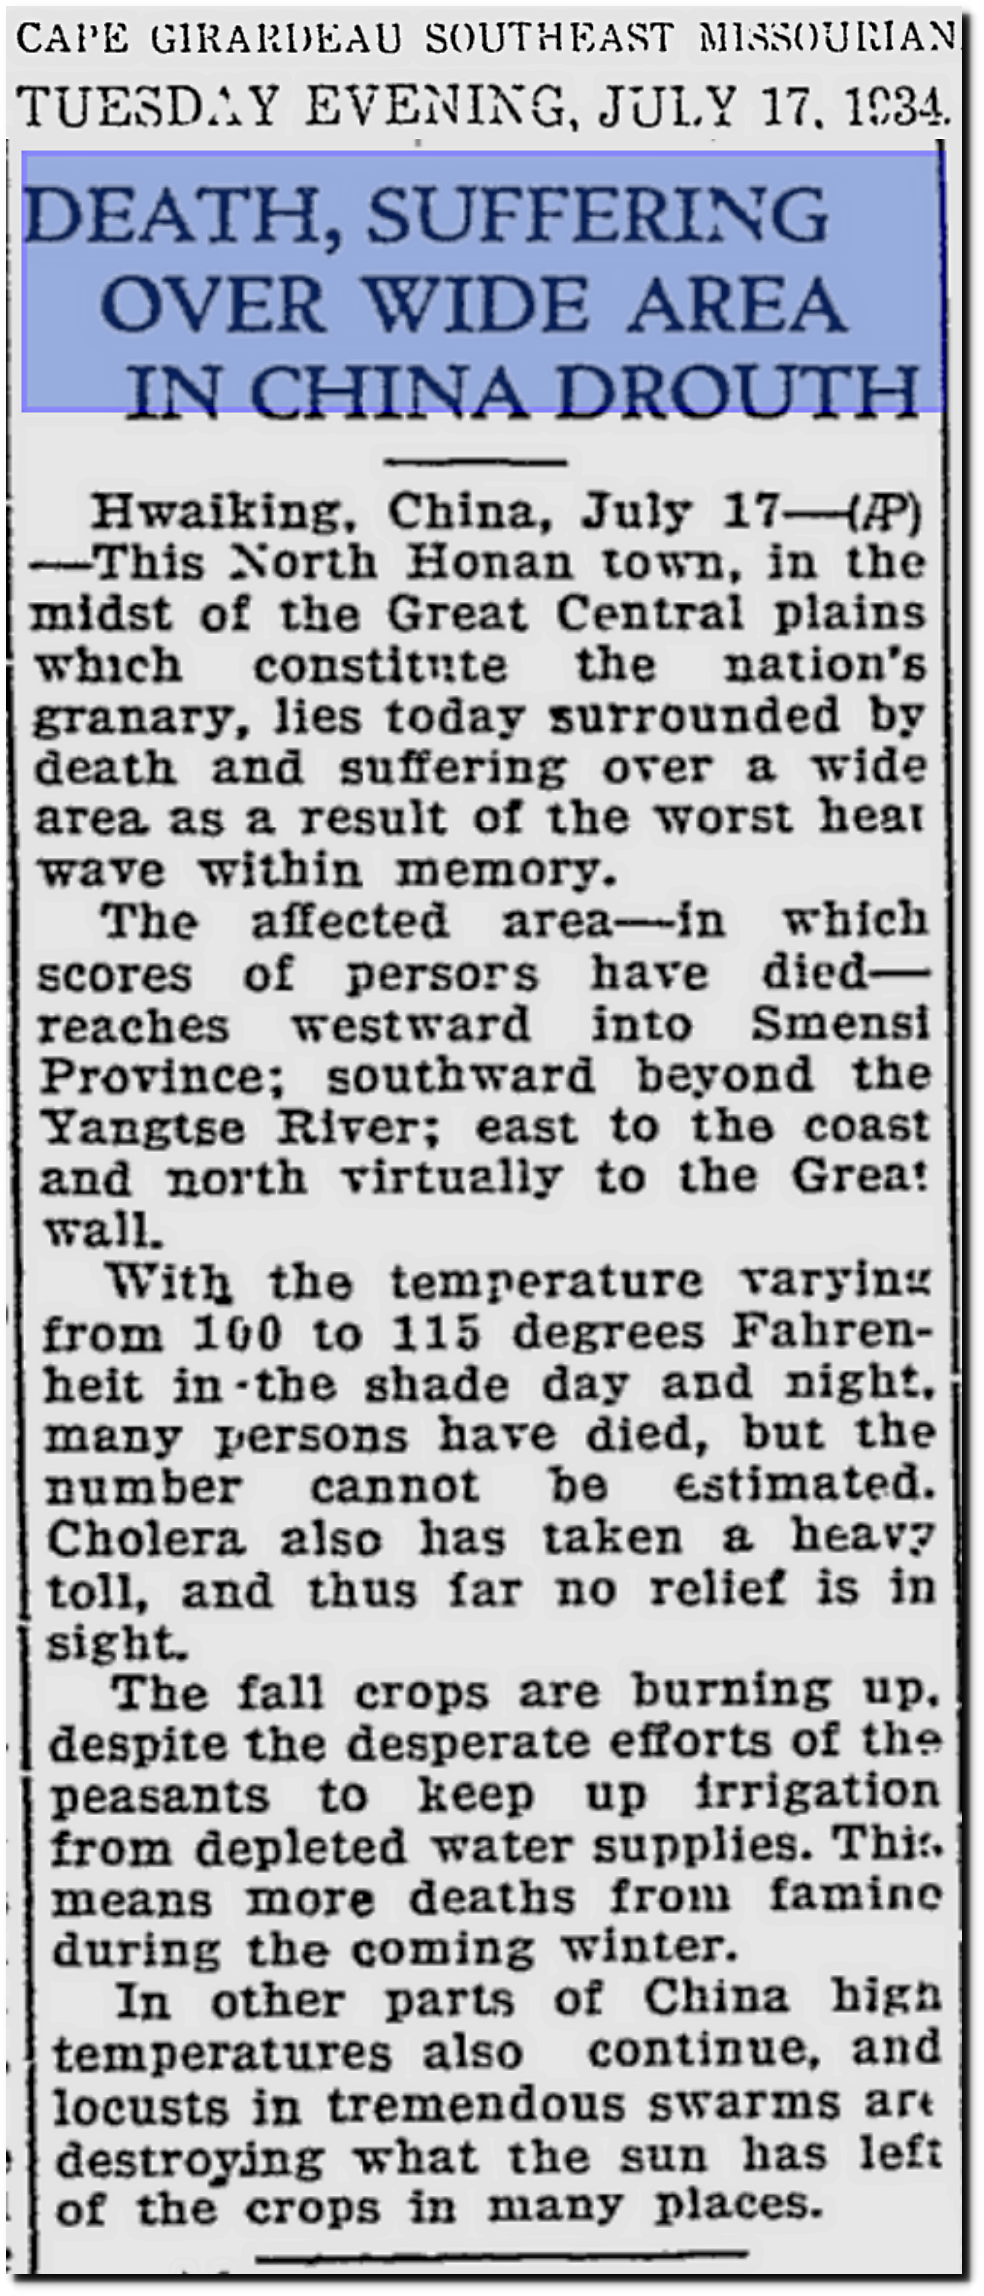
The Southeast Missourian – Google News Archive Search
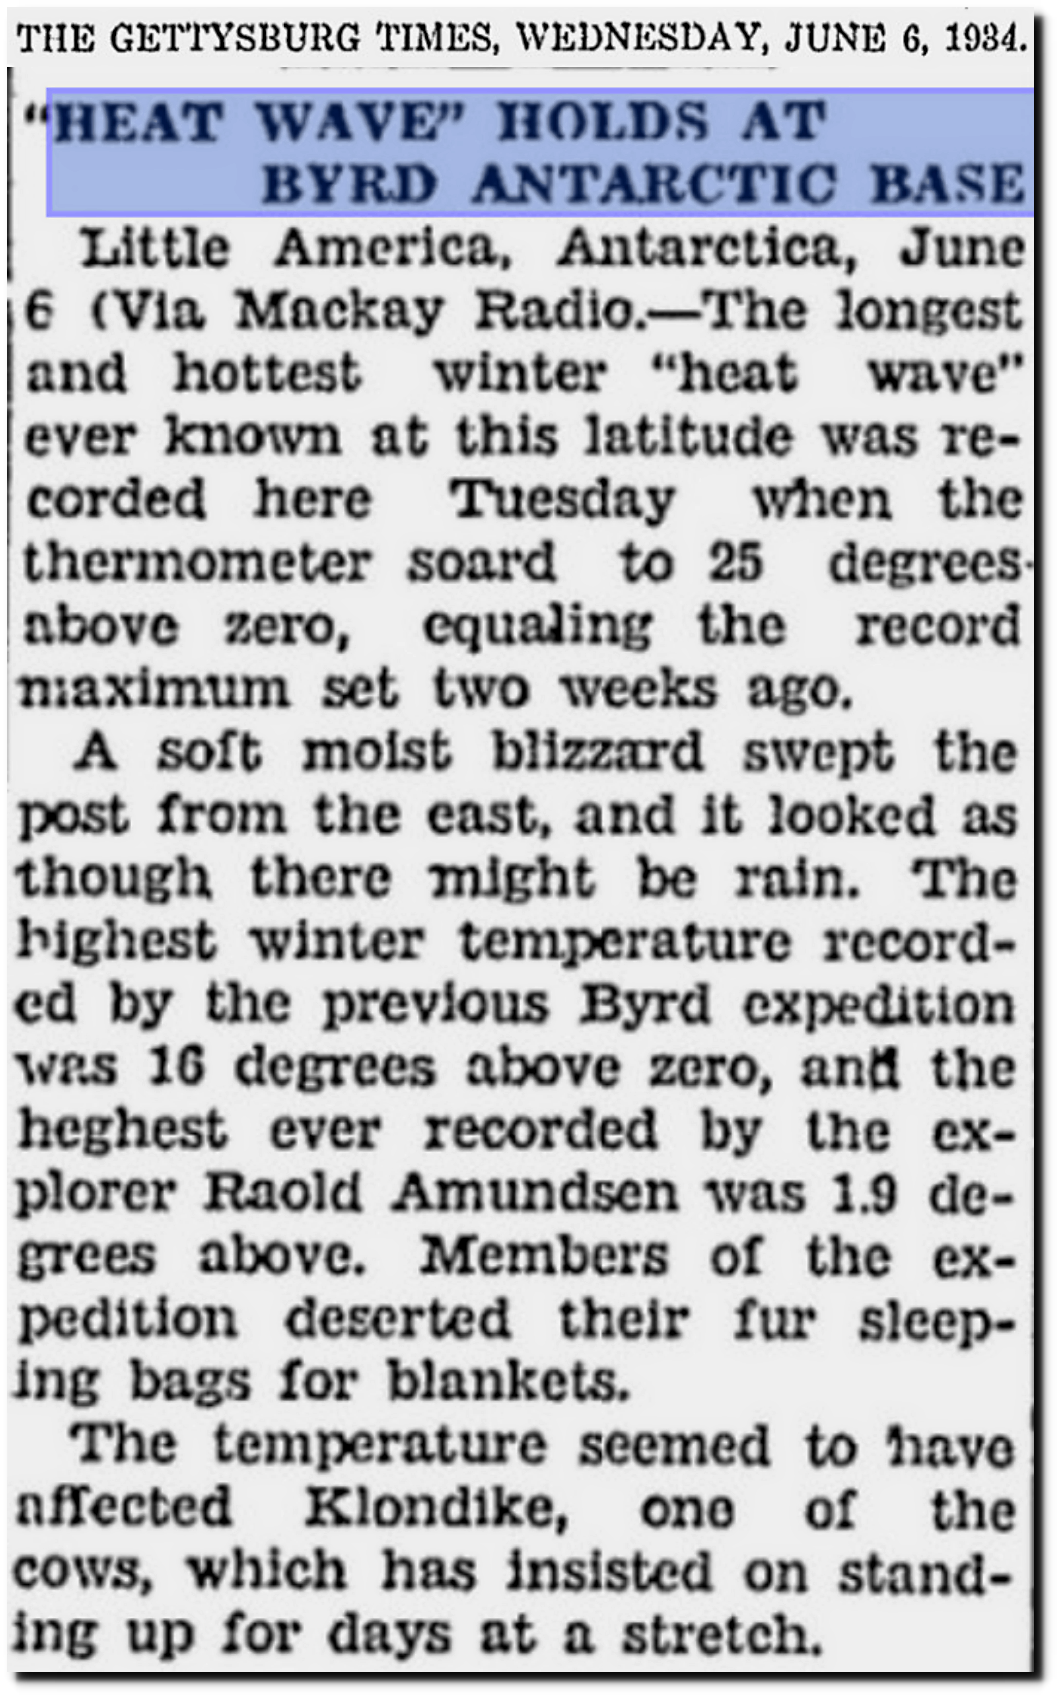 Gettysburg Times – Google News Archive Search
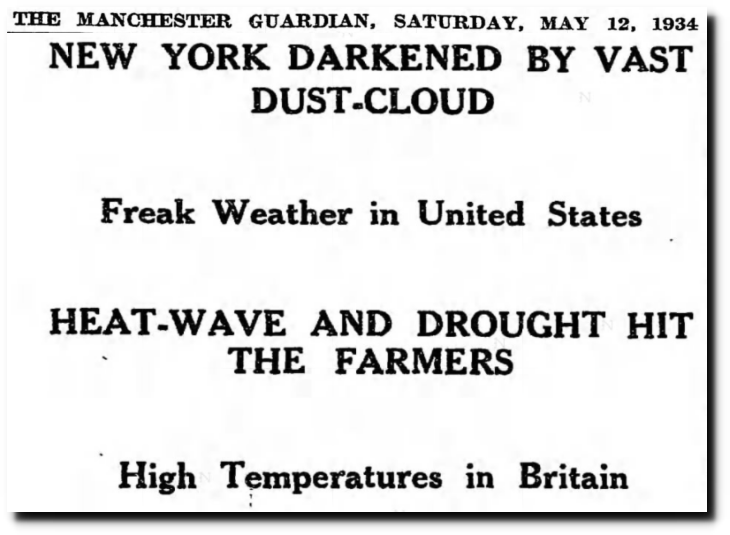
12 May 1934, 13 – The Guardian at Newspapers.com
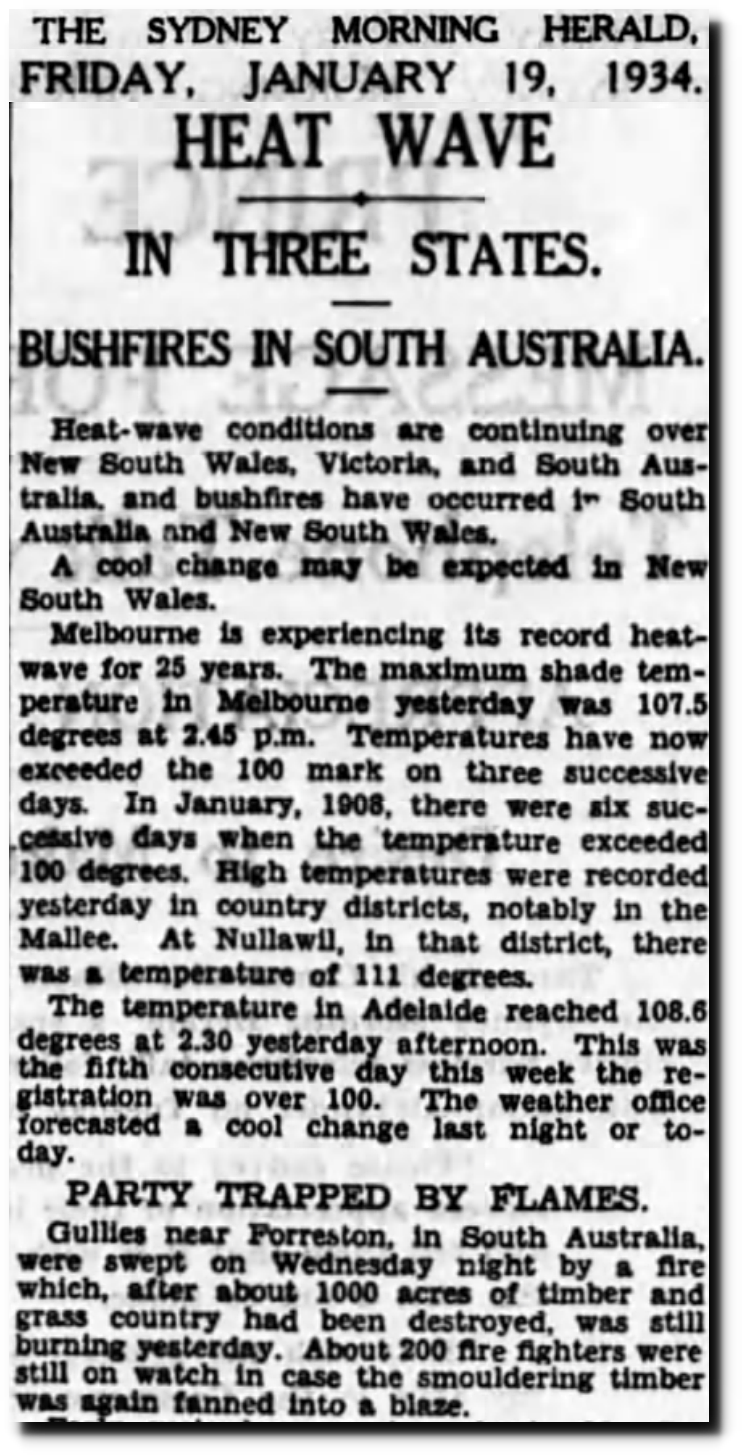
19 Jan 1934, Page 10 – The Sydney Morning Herald at Newspapers.com
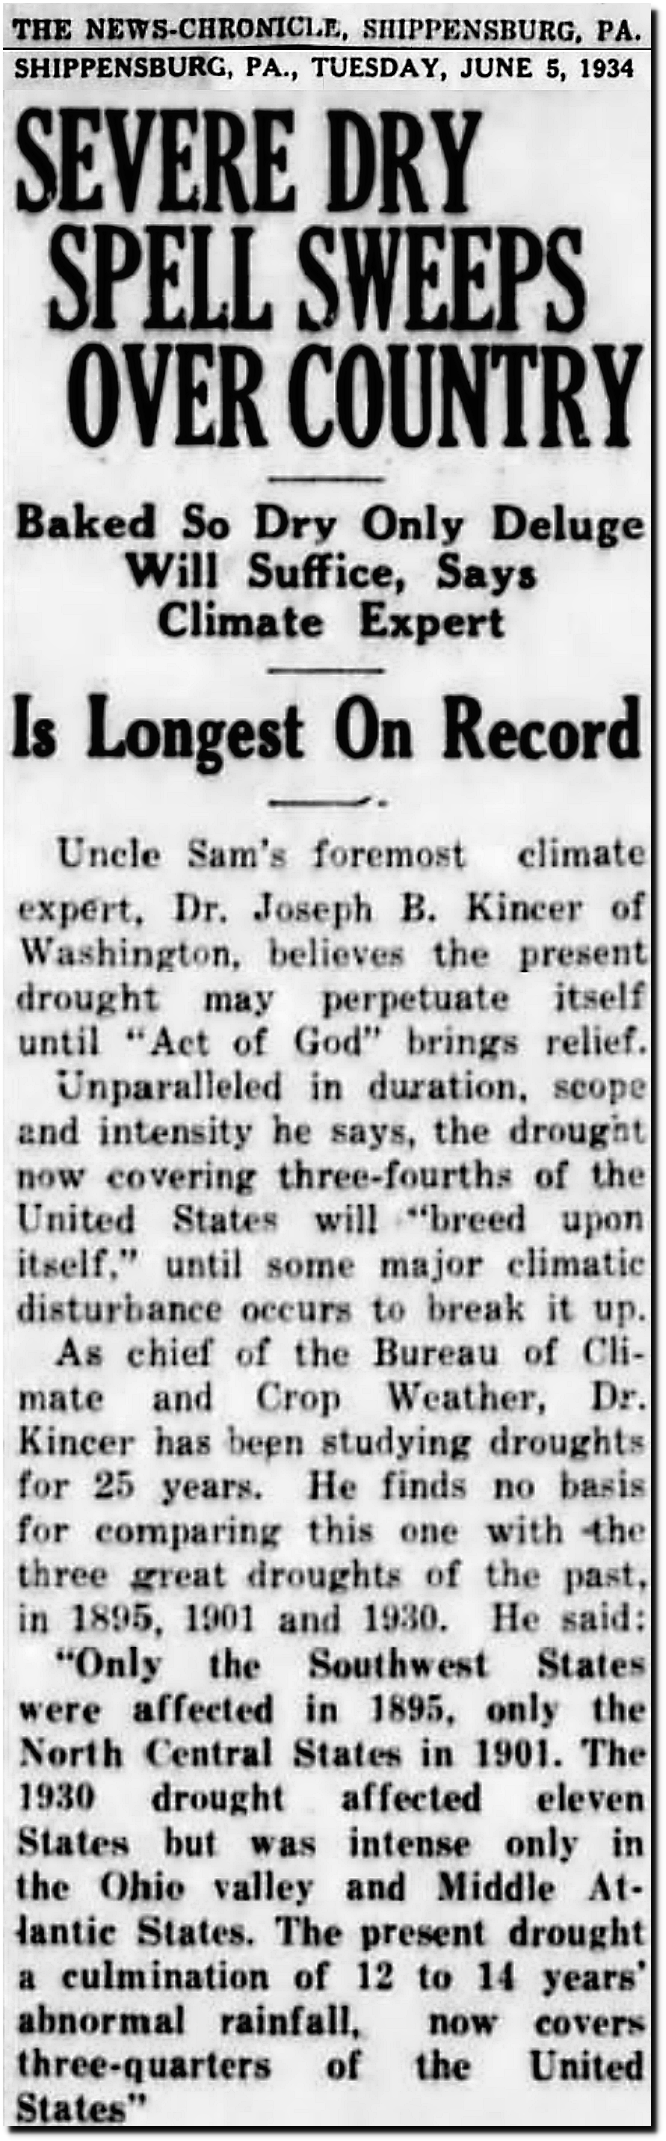
05 Jun 1934, Page 5 – The News-Chronicle at Newspapers.com
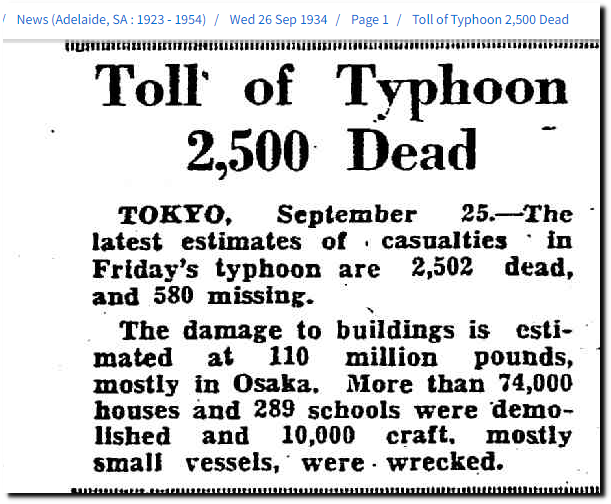
26 Sep 1934 – Toll of Typhoon 2,500 Dead – Trove
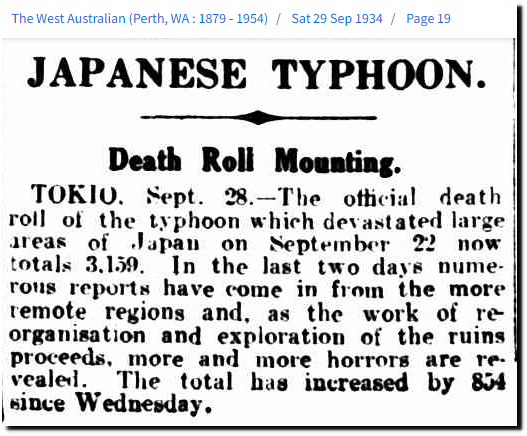
29 Sep 1934 – JAPANESE TYPHOON. – Trove
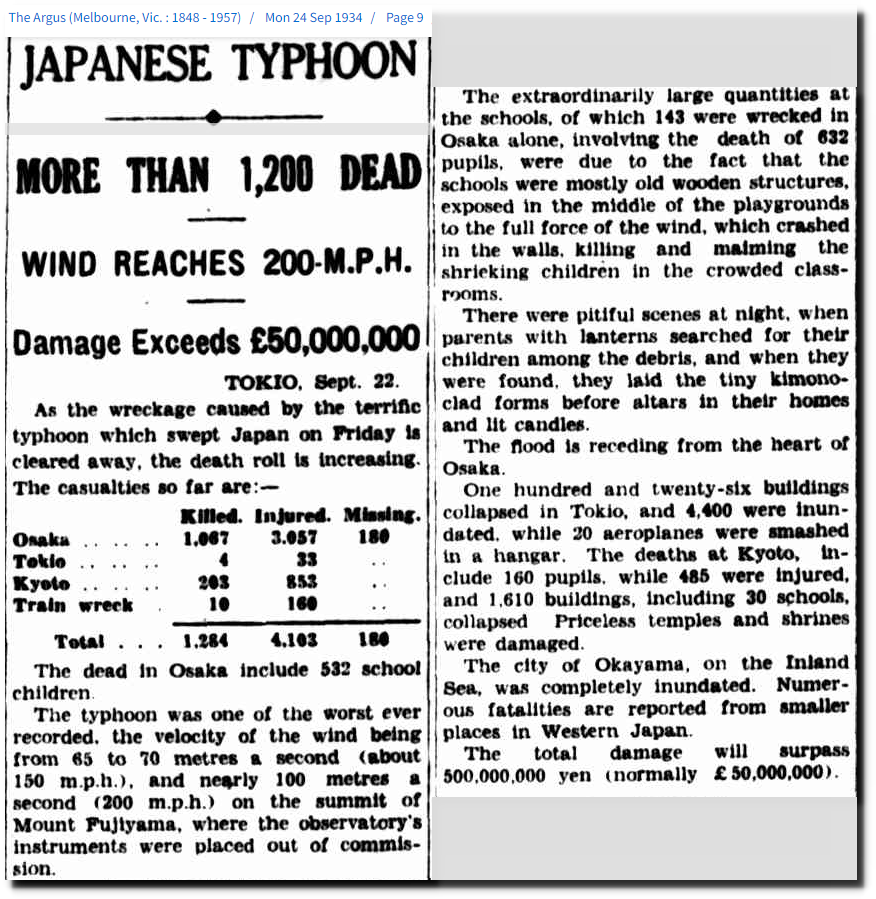
24 Sep 1934 – JAPANESE TYPHOON – Trove
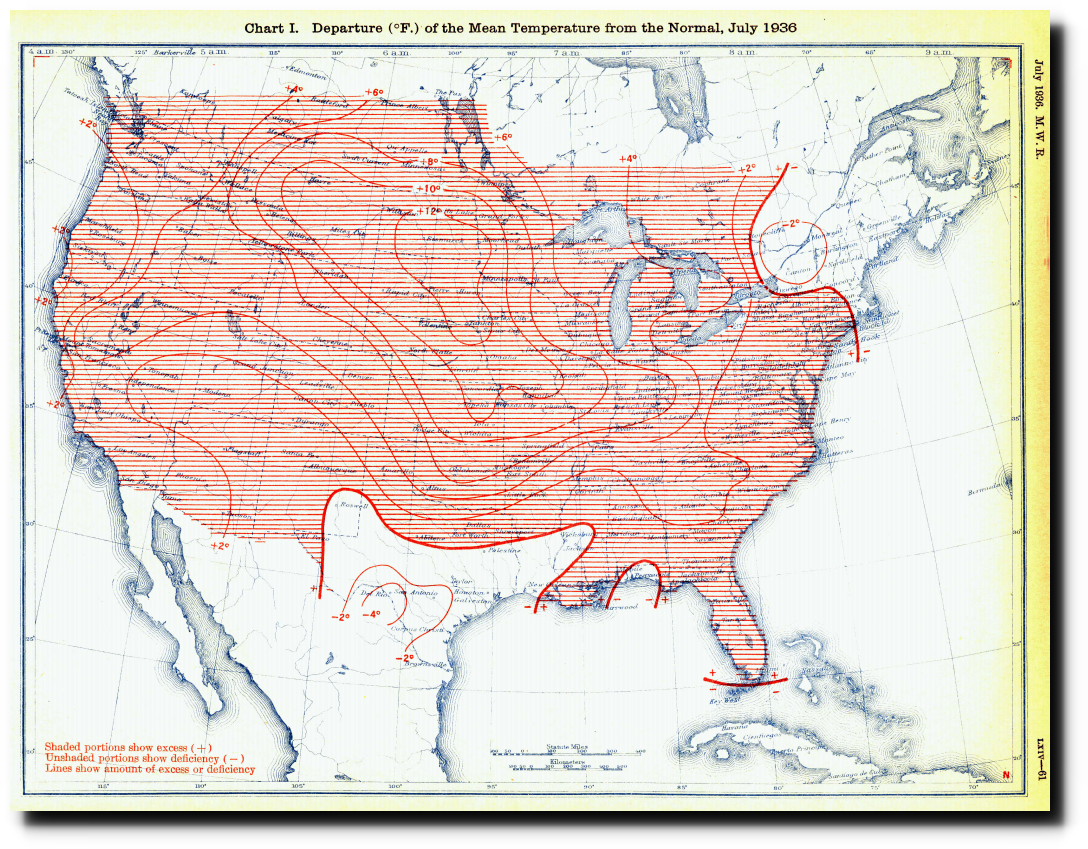
July, 1936 was the hottest month on record in the US.
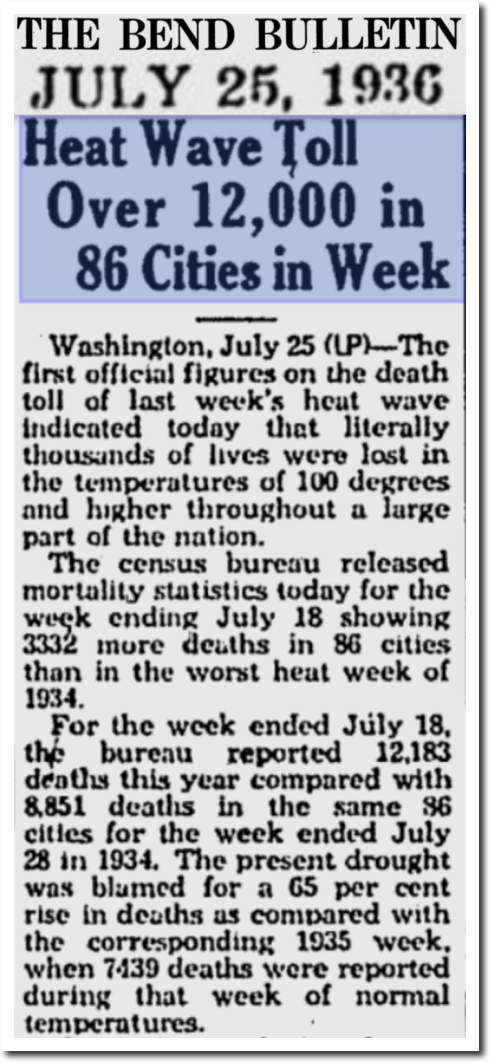
The Bulletin – Google News Archive Search
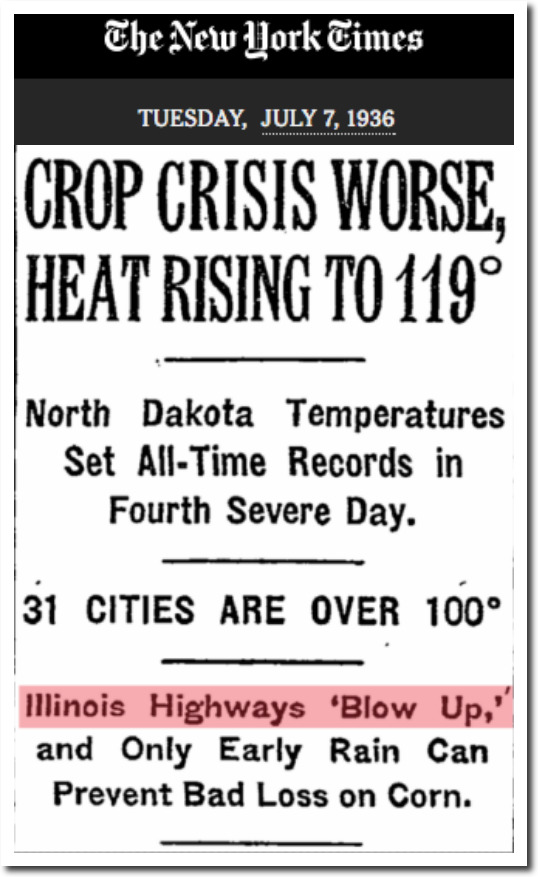
TimesMachine: July 7, 1936 – NYTimes.com
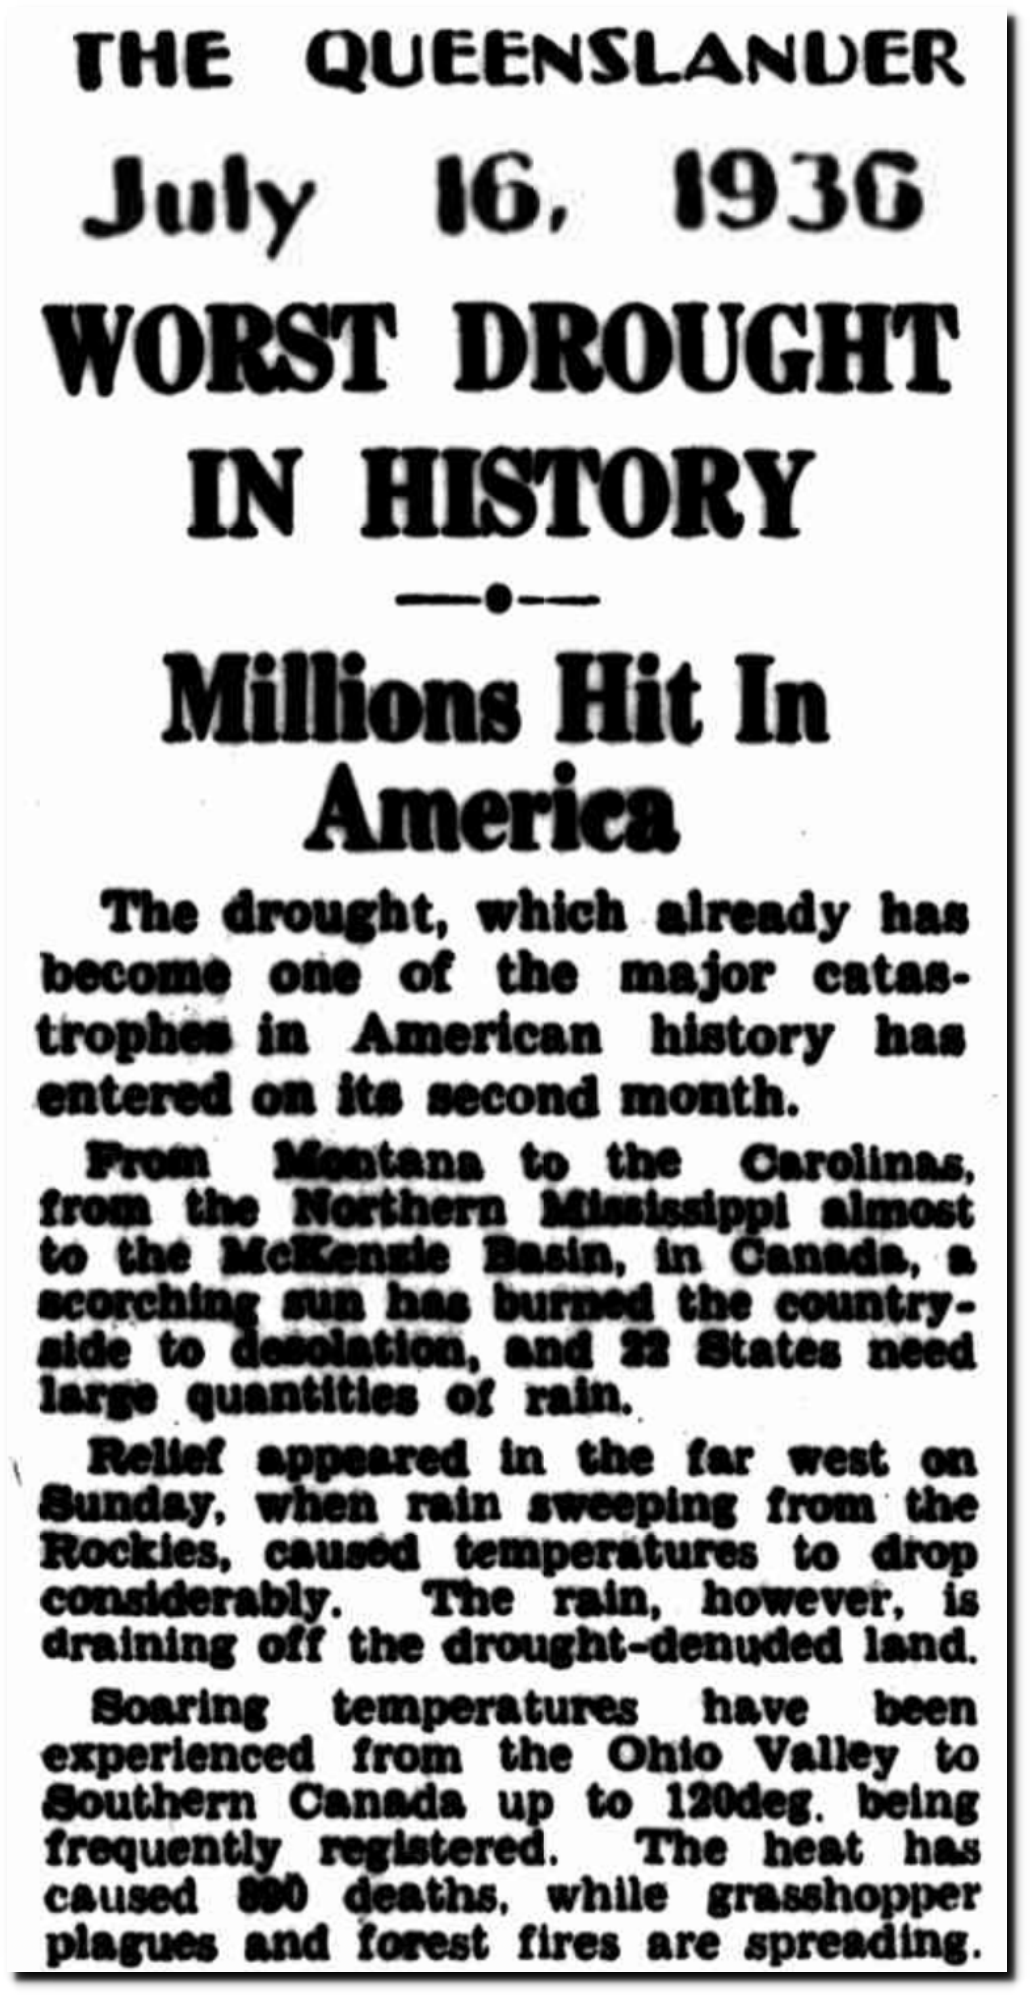
16 Jul 1936 – WORST DROUGHT IN HISTORY – Trove
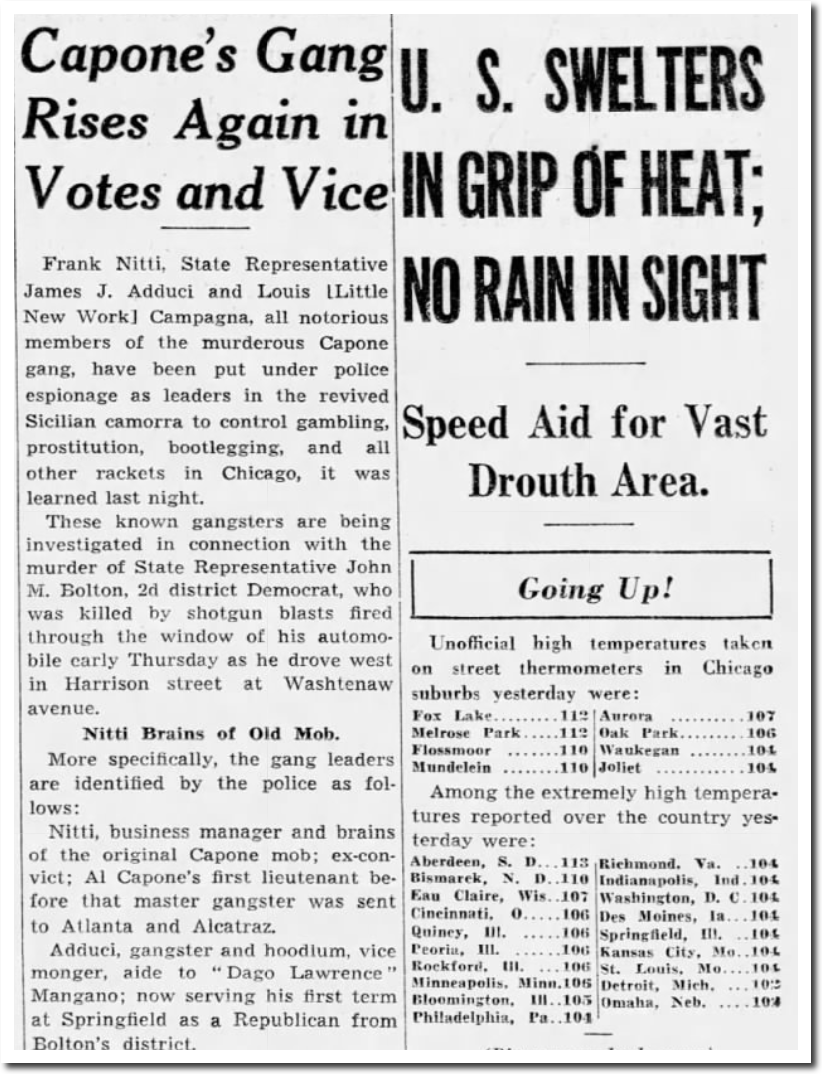
11 Jul 1936, 1 – Chicago Tribune at Newspapers.com
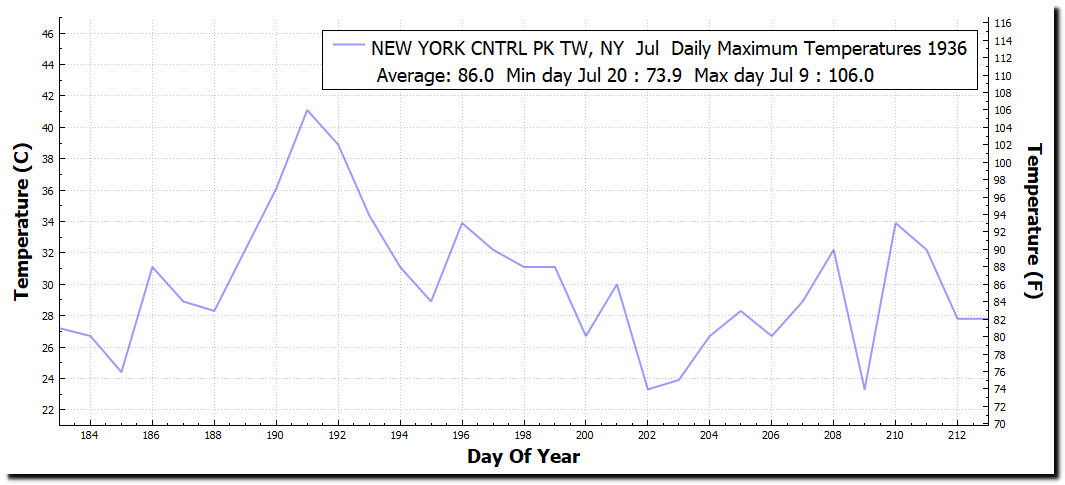
The hottest temperature ever recorded in New York City (106F) occurred on July 9, 1936.
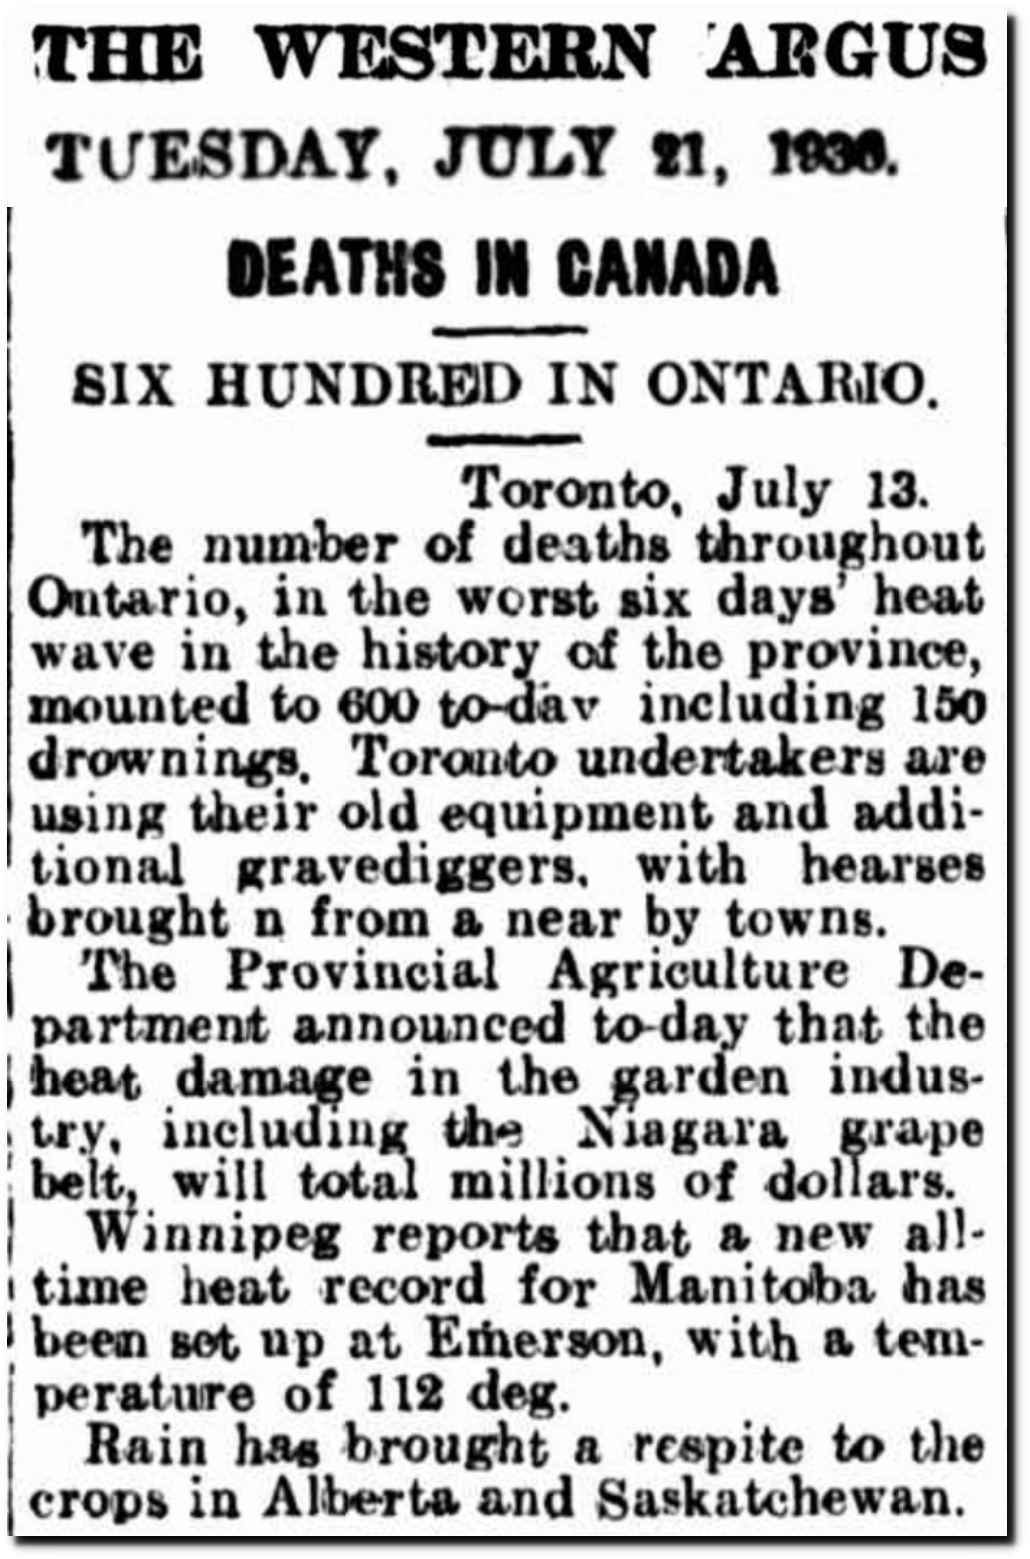
21 Jul 1936 – DEATHS IN CANADA – Trove
Page 1 – Carroll Daily Herald at Newspapers.com
#

