https://www.epa.gov/climate-indicators/climate-change-indicators-heat-waves#%20
Start your climate analysis in 1961 and you get to show a big increase in heat waves. This type of tactic is very supportive of the man-made climate narrative. But the EPA also reveals that If you go back further in the “heatwave” record, their entire man-made climate change analysis falls apart.
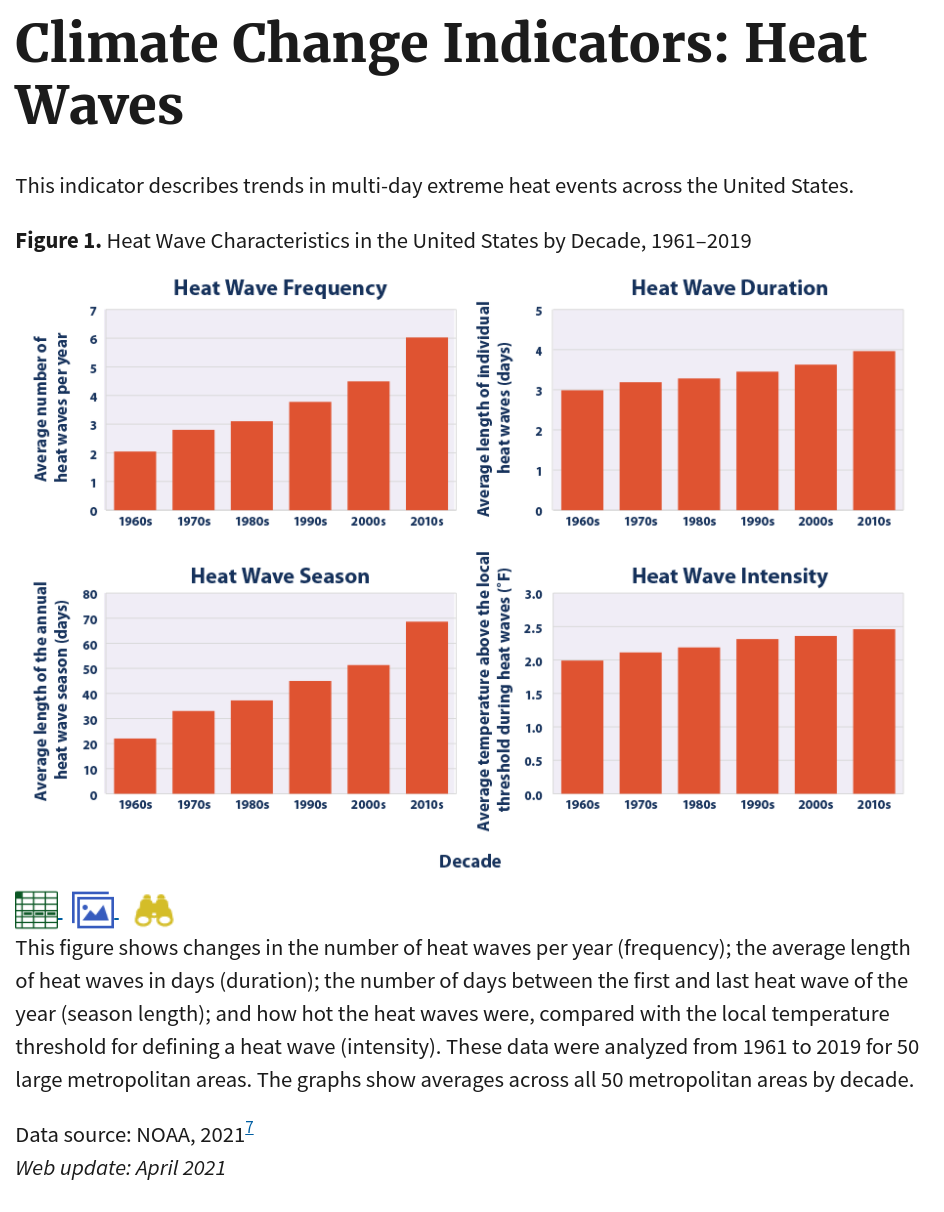
From EPA website: “This figure shows changes in the number of heat waves per year (frequency); the average length of heat waves in days (duration); the number of days between the first and last heat wave of the year (season length); and how hot the heat waves were, compared with the local temperature threshold for defining a heat wave (intensity). These data were analyzed from 1961 to 2019 for 50 large metropolitan areas. The graphs show averages across all 50 metropolitan areas by decade.”
Data source: NOAA, 20217
Web update: April 2021
EPA also seems to bury this chart available on another page that is linked.
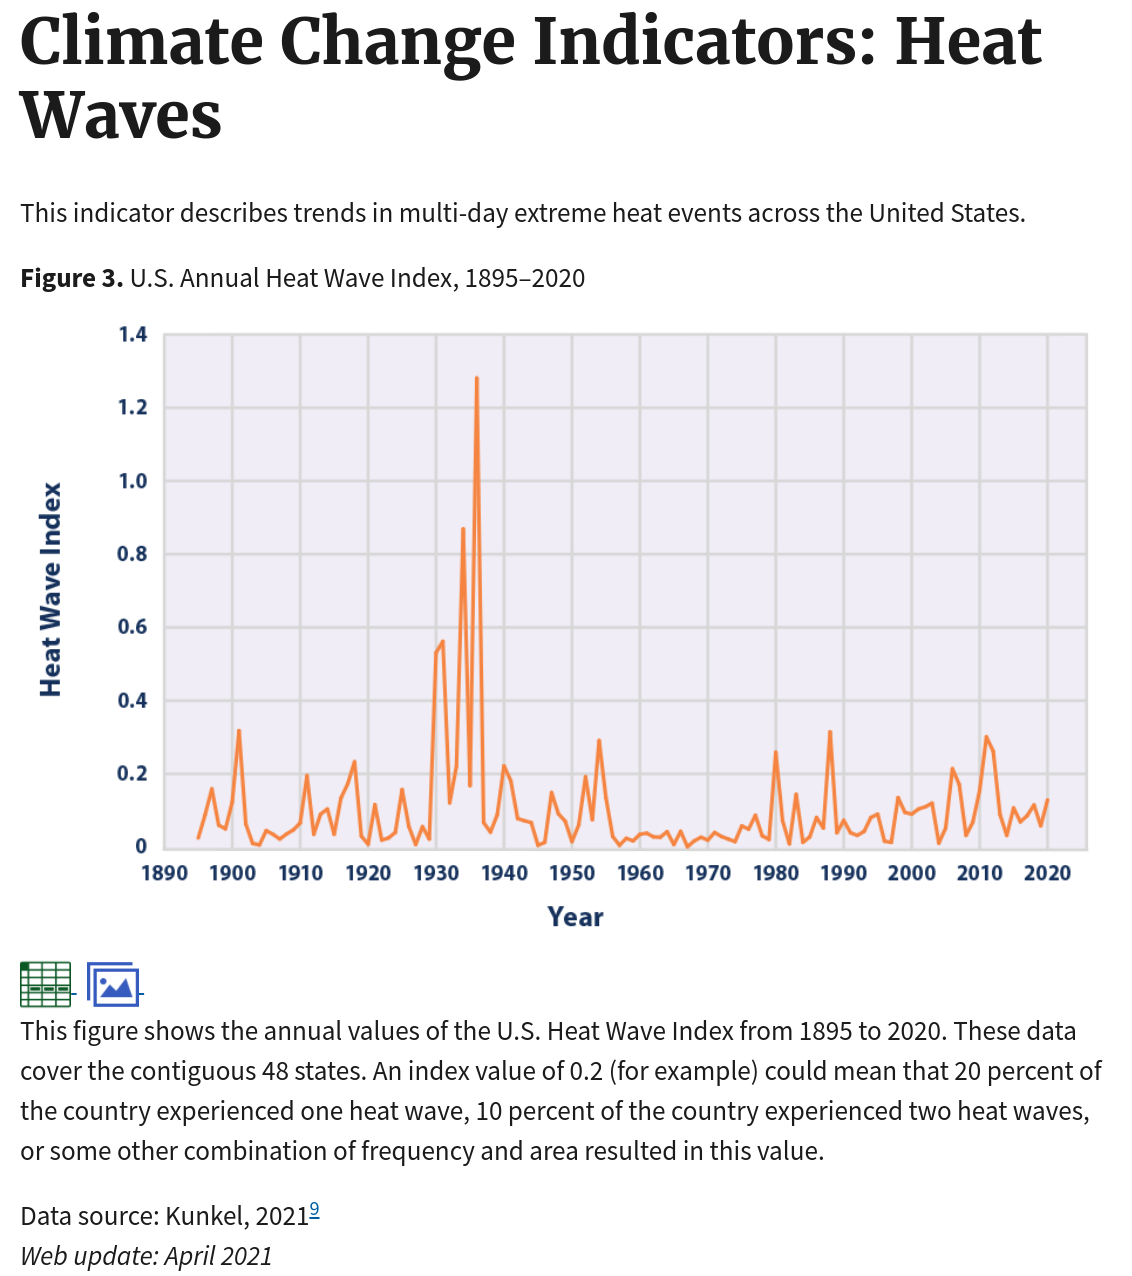
EPA website: “This figure shows the annual values of the U.S. Heat Wave Index from 1895 to 2020. These data cover the contiguous 48 states. An index value of 0.2 (for example) could mean that 20 percent of the country experienced one heat wave, 10 percent of the country experienced two heat waves, or some other combination of frequency and area resulted in this value.”
Data source: Kunkel, 20219
Web update: April 2021
#
Wow! Please take a look at the incredible EPA propaganda here:https://t.co/OOvR0OlZbX
They desperately hope you'll accept cherrypicked cool 1960s as a starting point, only admitting in the last of 6 "key points" that 1930s heatwaves were much worse. @ClimateDepot pic.twitter.com/ISKxxd9pjc
— Tom Nelson (@tan123) January 30, 2022
Flashback 2021: EPA Disappears More Inconvenient Climate Data, Including the 1930s U.S. Dust Bowl
“It’s Like a Heat Wave!”
Multiple studies find that long-term data show extreme heat waves in the United States have decreased since the 1930s.79 A study published in the Journal of Applied Meteorology and Climatology found that extreme heatwaves in the United States decreased from 1930 to 2010. According to the authors, “Several daily maximum [extreme heat events] near the 1930s led to 1930-2010 trends of daily maximum [extreme heat events] decreasing.” The overall trend of U.S. heat waves saw a decline from the 1930s until the 1970s global cooling and the coming–ice age scare, followed by a warming with temperatures still not up to levels seen in the 1930s in the U.S.80
University of Alabama climate scientist John Christy’s research has found that “about 75% of the states recorded their hottest temperature prior to 1955, and over 50 percent of the states experienced their record cold temperatures after 1940.”81
Data from the Environmental Protection Agency agree. The EPA website features a 2016 chart labeled “the U.S. Heat Wave Index from 1895 to 2015,” and it reveals that the worst U.S. heat waves by far happened in the 1930s.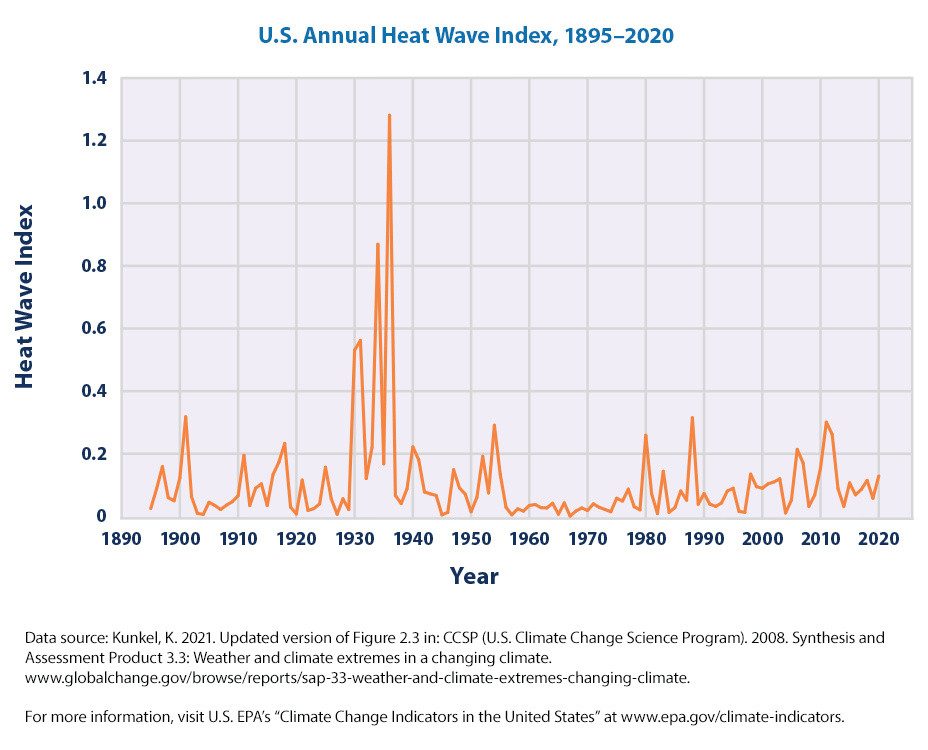


Climatologist John Christy has explained why the extreme weather claims are unscientific: “The non-falsifiable hypotheses can be stated this way, ‘whatever happens is consistent with my hypothesis.’ In other words, there is no event that would ‘falsify’ the hypothesis. As such, these assertions cannot be considered science or in any way informative since the hypothesis’ fundamental prediction is ‘anything may happen.’ In the example above if winters become milder or they become snowier, the non-falsifiable hypothesis stands. This is not science.”
KRTH Radio Houston – July 8, 2021
“It’s absurd, everywhere there’s a record hot temperature they claim this evidence of global warming” said Marc Morano, author of a great new book titled “Green Fraud: Why The Green New Deal Is Even Worse Than You Think”. … The real motive? Green, from the ‘green new deal’. “This is what happens when you have people with a vested interest in pushing an agenda” Morano told KTRH, “Every single weather event is now more of a reason to push the new green deal. They’re using the weather for their own personal lobbying interests, and we’ve seen this now for decades.”
But it’s not funny. Why? Because the next move? “We are facing the morphing of Covid lockdowns to Climate lockdowns” Morano said. “They’re going to be limiting our freedoms in order to save the climate.”
Expert Analysis: ‘Climate Change’ Had No Significant Role in Pacific Northwest Heatwave