By Physicist Dr. Ralph Alexander
The climate doomsday machine makes much more noise about warming-induced melting of Greenland’s ice sheet than Antarctica’s, even though the Greenland sheet holds only about 10% as much ice. That’s because the smaller Greenland ice sheet is melting at a faster rate and contributes more to sea level rise. But the melt rate is no faster today than it was 90 years ago and appears to have slowed over the last few years.

The ice sheet, 2-3 km (6,600-9,800 feet) thick, consists of layers of compressed snow built up over at least hundreds of thousands of years. Melting takes place only during Greenland’s late spring and summer, the meltwater running over the ice sheet surface into the ocean, as well as funneling its way down through thick glaciers, helping speed up their flow toward the sea.
In addition to summer melting, the sheet loses ice at its edges from calving or breaking off of icebergs, and from submarine melting by warm seawater. Apart from these losses, a small amount of ice is gained over the long winter from the accumulation of compacted snow at high altitudes in the island’s interior. The net result of all these processes at the end of summer melt in August is illustrated in the adjacent figure, based on NASA satellite data.
The following figure depicts the daily variation, over the past year, of the estimated surface mass balance of the Greenland ice sheet – which includes gains from snowfall and losses from melt runoff, but not sheet edge losses – as well as the mean daily variation for the period from 1981 to 2010. The loss of ice during the summer months of June, July and August is clearly visible, though the summer loss was smaller in 2021 than in many years. An unusual, record-setting gain can also be seen in May 2021.

The next figure shows the average annual gain or loss of both the surface mass balance (in blue) and a measure of the total mass balance (in black), going all the way back to 1840. Most of the data comes from meteorological stations across Greenland. The total mass balance in this graph includes the surface mass balance, iceberg calving and submarine melting (combined in the gray dashed line), and melting from basal sources underneath the ice sheet, but not peripheral glaciers – glaciers that contribute 15 to 20% of Greenland’s total mass loss.

It can be seen that the rate of ice loss excluding glaciers has increased since about 2000. But it’s also clear from the graph that high short-term loss rates have occurred more than once in the past, notably in the 1930s and the 1950s – so the current shrinking of the Greenland ice sheet is nothing remarkable. There’s no obvious correlation with global temperatures, since the planet warmed from 1910 to 1940 but cooled from 1940 to 1970.
The total ice loss (not its rate) since 1972 is displayed in more detail in the final figure below. The slightly different estimates of the total mass are because some estimates include losses from peripheral glaciers and basal melting, while others don’t. Nevertheless, the insert showing mass loss from 2010 to 2020 reveals clearly that the rate of loss may have slowed down since about 2015.
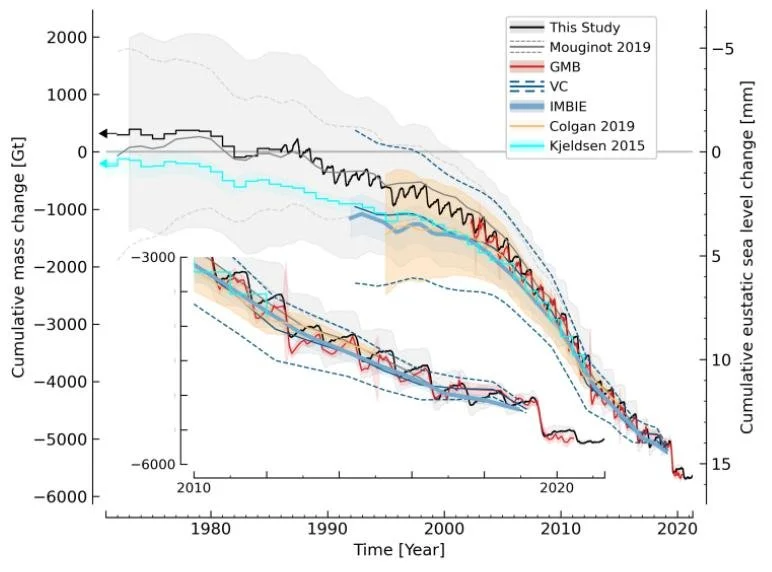
The 2020 loss was 152 gigatonnes (168 gigatons), much lower than the average annual losses of 258 gigatonnes (284 gigatons) and 247 gigatonnes (272 gigatons) from 2002 to 2016 and 2012 through 2016, respectively. The 2020 loss also pales in comparison with the record high losses of 458 gigatonnes (505 gigatons) in 2012 and 329 gigatonnes (363 gigatons) in 2019. The 2021 loss is on track to be similar to 2020, according to estimates at the end of the summer melt season.
The Sixth Assessment Report of the UN’s IPCC (Intergovernmental Panel on Climate Change) maintains with high confidence that, between 2006 and 2018, melting of the Greenland ice sheet and peripheral glaciers was causing sea levels to rise by 0.63 mm (25 thousandths of an inch) per year. This can be compared with a rise of 0.37 mm (15 thousandths of an inch) per year from melting of Antarctic ice. However, the rate of rise from Greenland ice losses may be falling, as discussed above.
If the rate of Greenland ice loss were to remain at its 2012 to 2016 average of 247 gigatonnes (272 gigatons) per year, which is an annual loss of about 0.01% of the total mass of the ice sheet, it would take another 10,000 years for all Greenland’s ice to melt. If the rate stays at the 2020 value of 152 gigatonnes (168 gigatons) per year, the ice sheet would last another 17,000 years.