By Kenneth Richard
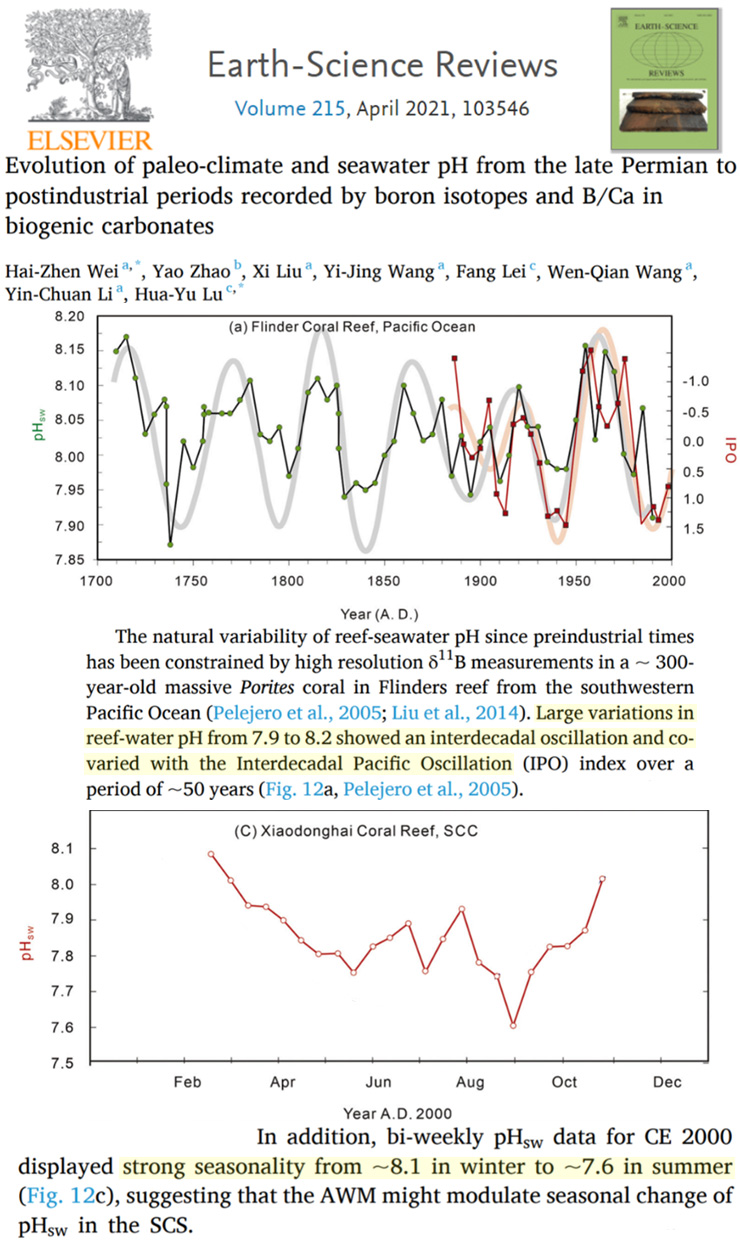
A new study shows ocean pH (“acidification”) levels naturally vary seasonally and decadally at rates and magnitudes far exceeding those attributed to anthropogenic activity.
In recent decades the oceans’ average pH level has fallen to 8.1 according to NOAA. This pH value is said to be about one-tenth of a unit lower than it was before modern industrialization (8.2).
Because the oceans are less alkaline than they were at one point in time, the directionality of these pH changes is referred to as an ocean acidification process. Of course, humans are said to be responsible for this. We are allegedly acidifying the oceans, or facilitating the 8.2 to 8.1 decline over the course of the last few centuries, because we humans have caused atmospheric CO2 levels to rise from 280 ppm to 415 ppm since 1750. That’s the allegation, anyway.
But these assumptions seem to be challenged by the results shown in studies authored by the very scientists promoting the human-caused ocean acidification narrative.
For example, a new study shows pH levels were lower in the 1730s and 1930s-’40s than in 2000, and that the highest pH levels (i.e., less acidic) of the last 300 years occurred in the 1960s to 1980s. Anthropogenic CO2 emissions were negligible to non-existent in the 1730s, and by the 1930s they were only hovering around 1 GtC/year. In the late 20th century, human emissions rates reached about 5 or 6 GtC/year, and yet it was these decades that had the highest pH levels since the early 18th century.
Further, seawater pH in the South China sea varies seasonally, or from about 8.1 in winter to 7.6 in summer. So, within a span of months, the ocean pH varies far more than it allegedly has due to human activity over centuries.

Image Source: Wei et al., 2021
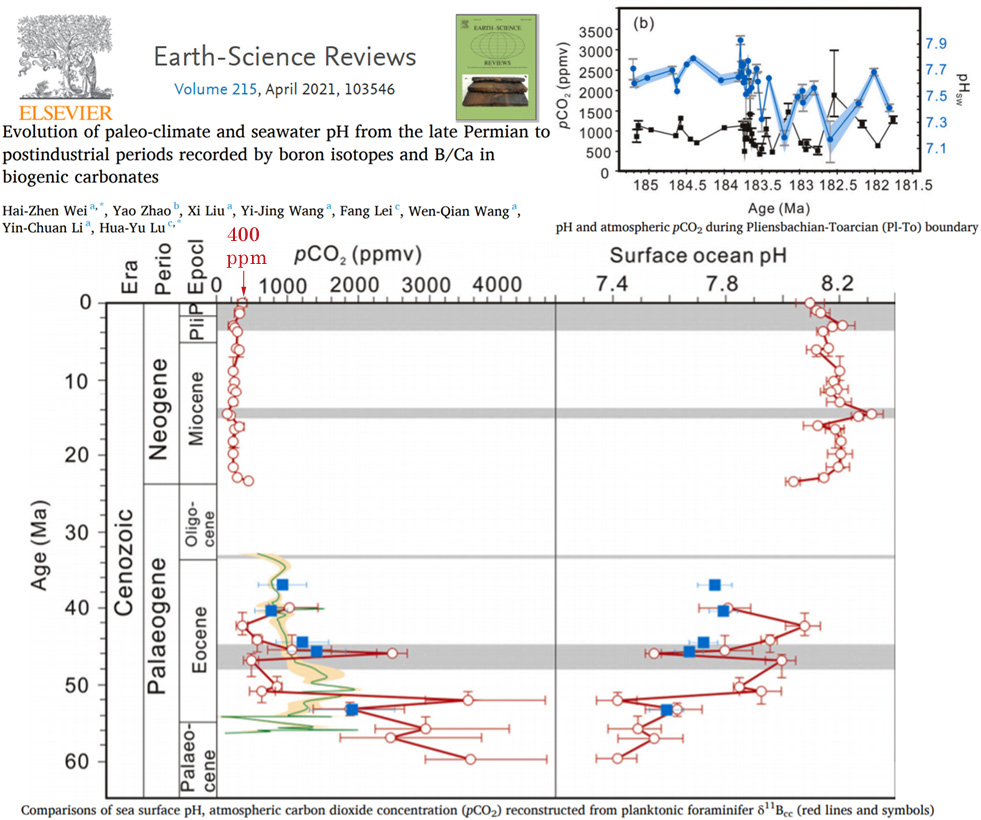
A few other graphs from the Wei et al. (2021) paper show just how ordinary and unexceptional the modern atmospheric CO2 and ocean pH levels are relative to the past.
In the main graph from the below image, notice how minuscule a 400 ppm atmospheric CO2 level and 8.2 to 8.1 pH change (circles on the top left and right) look relative to the changes over the last 25 million years (Ma).
Then notice the wild variations in CO2 reaching 2500 to 3500 ppm between 40 to 60 Ma, and the pH values dipping to 7.4 or 7.5 during this same era. The top right graph shows pH levels dipping to 7.2 and atmospheric CO2 fluctuating by ±1000 ppm from about 182 to 185 Ma.

Image Source: Wei et al., 2021
Given today’s alarmism about ocean acidification driven by high atmospheric CO2 levels, these images beg the question:
How did marine animals manage to survive in such “acidified” waters (7.2 to 7.5) if it’s believed the modern biosphere is threatened by a pH value of 8.1?


