Inconvenient…40 new scientific publications in 2020 Show NO SEA LEVEL RISE ALARM. Sea levels used to be meters higher, paging @IPCC_CH @GretaThunberg @DNC @GOP @ClimateDepot @tan123 @ClimateRealists @Fridays4future @PIK_Klima Follow ALL the science! https://t.co/1HmeXcIbTo pic.twitter.com/tG4jk0Cxkg
— Pierre L. Gosselin (@NoTricksZone) January 4, 2021
Huge Database Of Studies Documenting Meters-Higher Mid-Holocene Sea Levels Swells Again In 2020
During the last interglacial (~116 to 128 thousand years ago), when CO2 peaked at just 280 ppm but surface temperatures were so much warmer that much less water was locked up on land as ice, sea levels were “at least ~7 m to ~9 m above present” and they “could have been as high as 11-13 m above present” at some locations (Muh et al., 2020).
“Corals with closed-system histories collected from patch reefs on NPI have ages of 128-118 ka and ooids/peloids from beach ridges have closed-system ages of 128-116 ka. Elevations of patch reefs indicate a LIG paleo-sea level of at least ∼7 m to ∼9 m above present. Beach ridge sediments indicate paleo-sea levels of ∼5 m to ∼14 m (assuming subsidence, ∼7 m to ∼16 m) above present during the LIG. …. Results of this study show that at the end of the LIG paleo-sea levels could have been as high as 11-13 m above present (at localities close to North American ice sheets) to as little as 5-8 m above present (at localities distant from North American ice sheets).”
During the Mid-Holocene sea surface temperatures were also considerably warmer despite CO2 levels only reaching ~265 ppm. Yet at that time sea levels were about 2 or more meters higher than they are today according to an ever-accumulating body of paleo-evidence.
Since 2019, over 40 new studies have been added to the NoTricksZone sea level database:
Holocene Sea Levels 2+ Meters Higher
Below is a sampling from this past year’s additions.
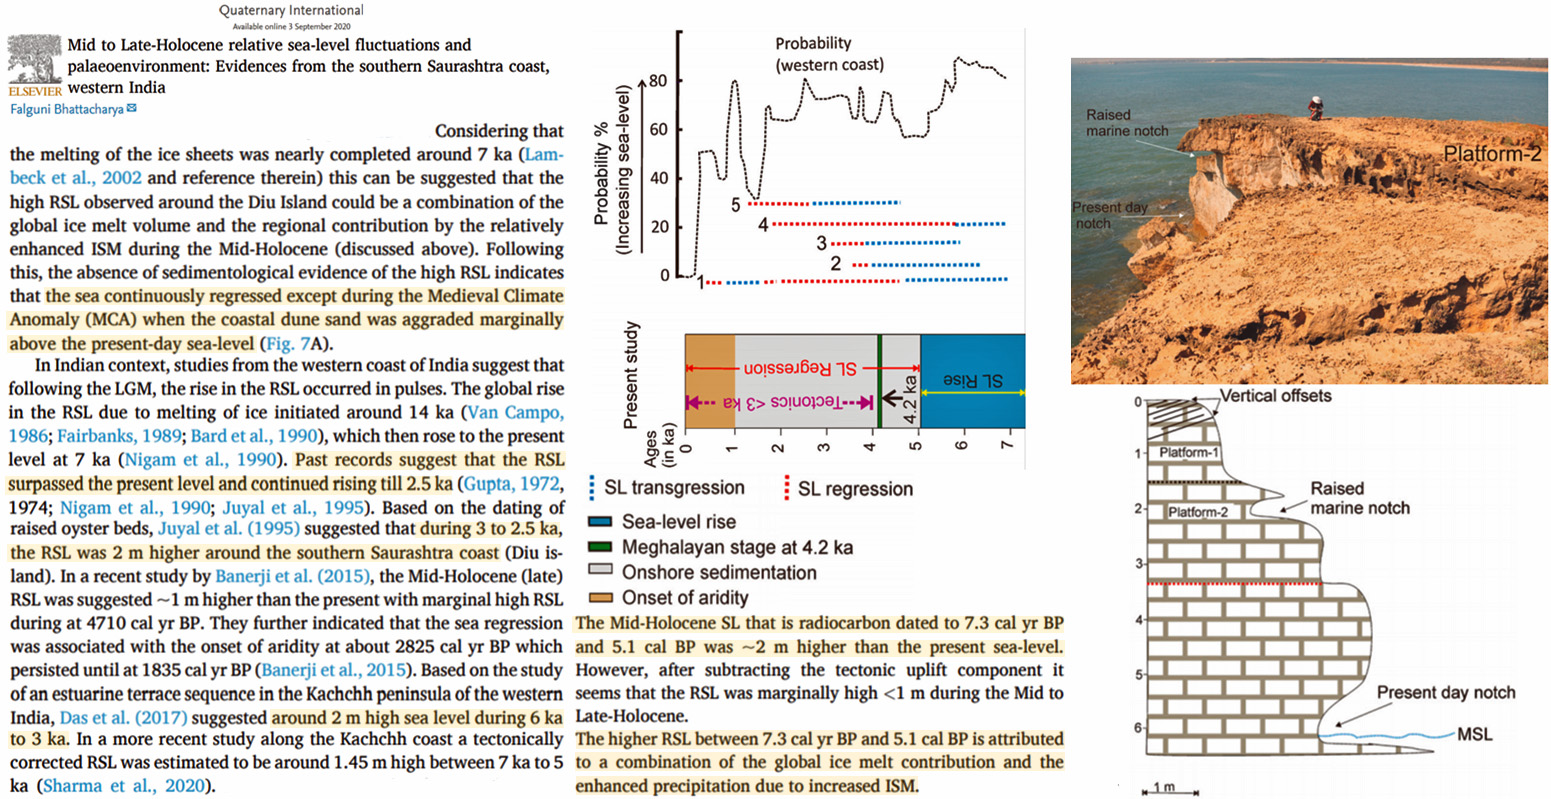
Bhattacharya, 2020 Western India, +2 m higher than present
“The Mid-Holocene SL [sea level] that is radiocarbon dated to 7.3 cal yr BP and 5.1 cal BP was ~2 m higher than the present sea level.”
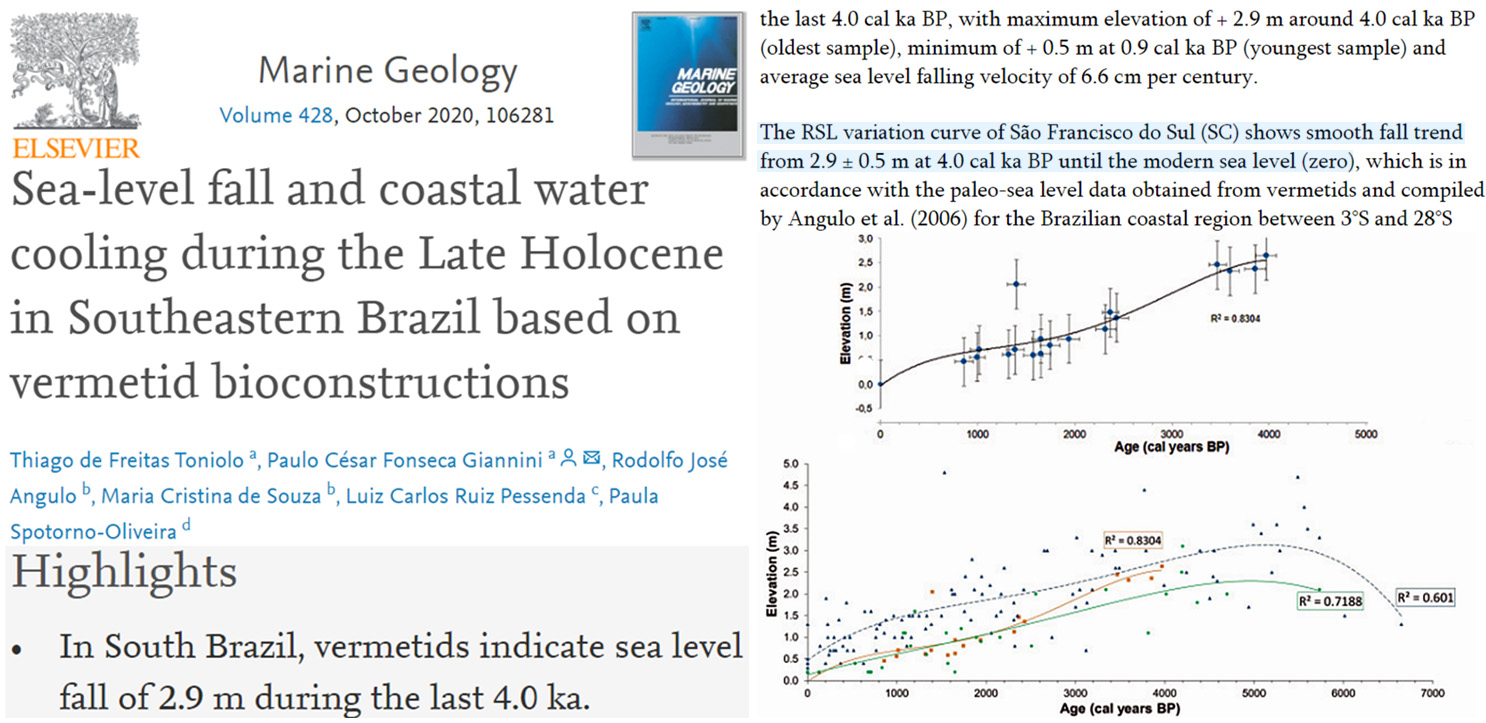
Toniolo et al., 2020 Brazil, +2.9 m higher than present
“In South Brazil, vermetids indicate sea level fall of 2.9 m during the last 4.0 ka. … [T]he last 4.0 cal ka BP, with maximum elevation of + 2.9 m around 4.0 cal ka BP (oldest sample), minimum of + 0.5 m at 0.9 cal ka BP (youngest sample) and average sea level falling velocity of 6.6 cm per century. … The RSL variation curve of São Francisco do Sul (SC) shows smooth fall trend from 2.9 ± 0.5 m at 4.0 cal ka BP until the modern sea level (zero), which is in accordance with the paleo-sea level data obtained from vermetids and compiled by Angulo et al. (2006) for the Brazilian coastal region between 3°S and 28°S (Fig. 6).”
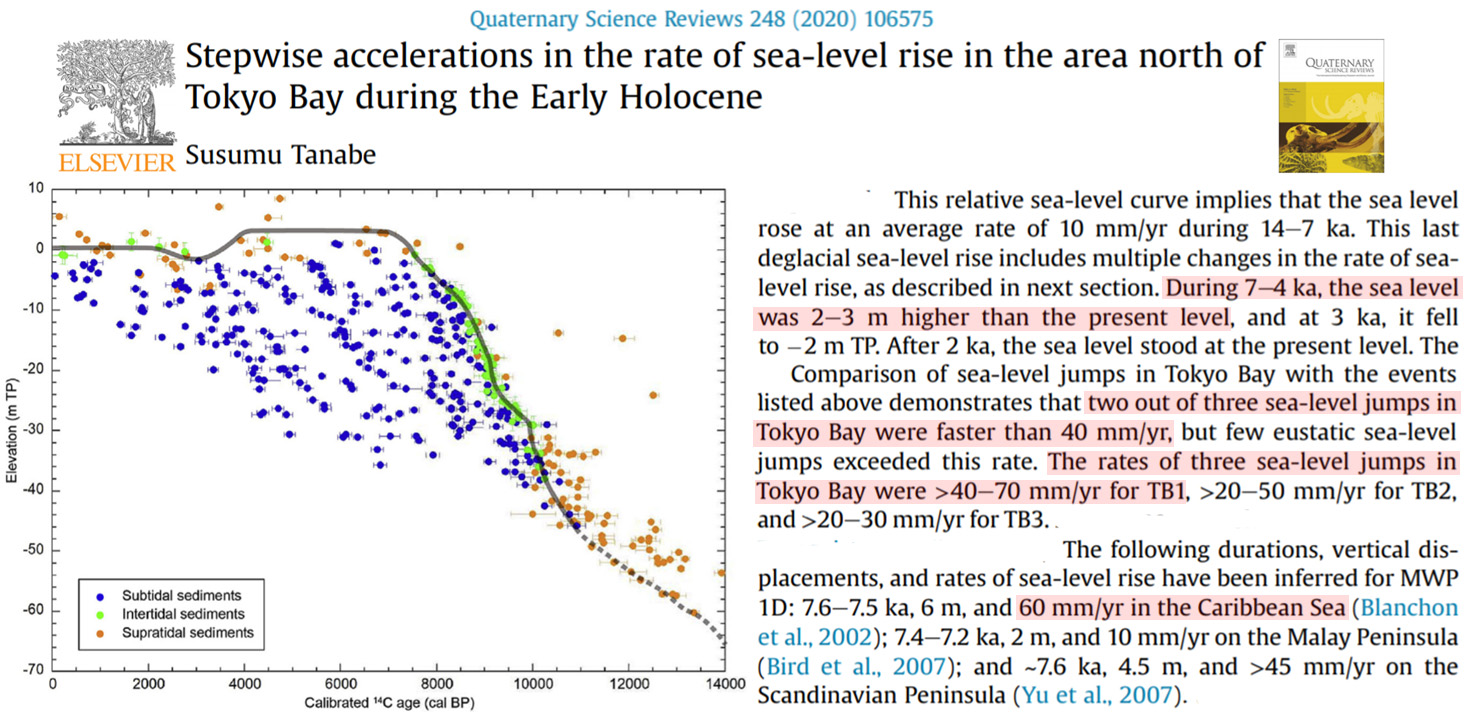
Tanabe, 2020 Japan, +2-3 m higher than present (rate: 40-70 mm/yr)
“During 7-4 ka, the sea level was 2-3 m higher than the present level, and at 3 ka, it fell to -2 m TP. After 2 ka, the sea level stood at the present level. … The following durations, vertical displacements, and rates of sea-level rise have been inferred for MWP1D: 7.6-7.5 ka, 6 m, and 60 mm/yr in the Caribbean Sea (Blanchon et al., 2002) … The rates of three sea-level jumps in Tokyo Bay were >40-70 mm/yr for TB1, >20-50 mm/yr for TB2, and >20-30 mm/yr for TB3.”
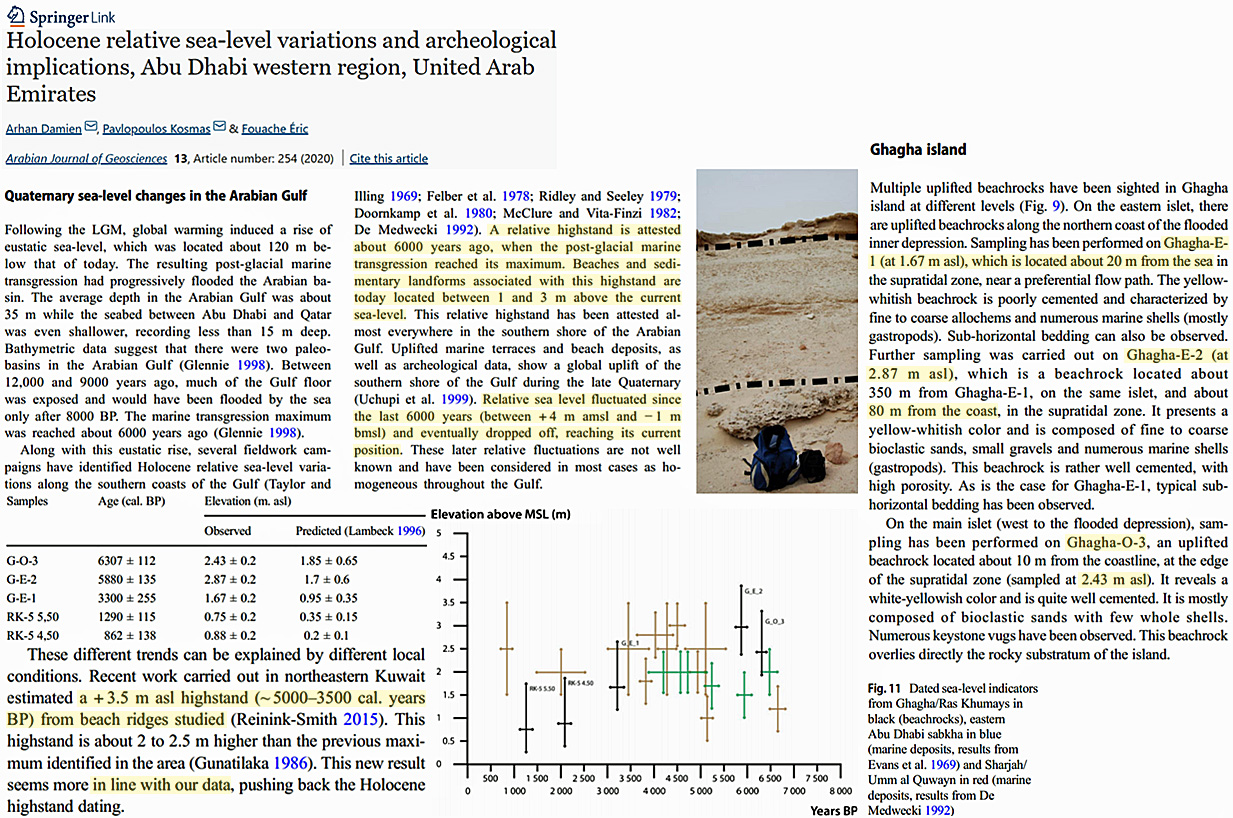
Damien et al., 2020 Arabian Gulf, +2.5 m higher than present
“These different trends can be explained by different local conditions. Recent work carried out in northeastern Kuwait estimated a +3.5 m asl [higher than present] highstand (~ 5000–3500 cal. years BP) from beach ridges studied (Reinink-Smith 2015). This highstand is about 2 to 2.5 m higher than the previous maximum identified in the area (Gunatilaka 1986). This new result seems more in line with our data, pushing back the Holocene highstand dating. … [L]andforms associated with this highstand [about 6000 years ago] are today located between 1 and 3 m above the current sea-level.”
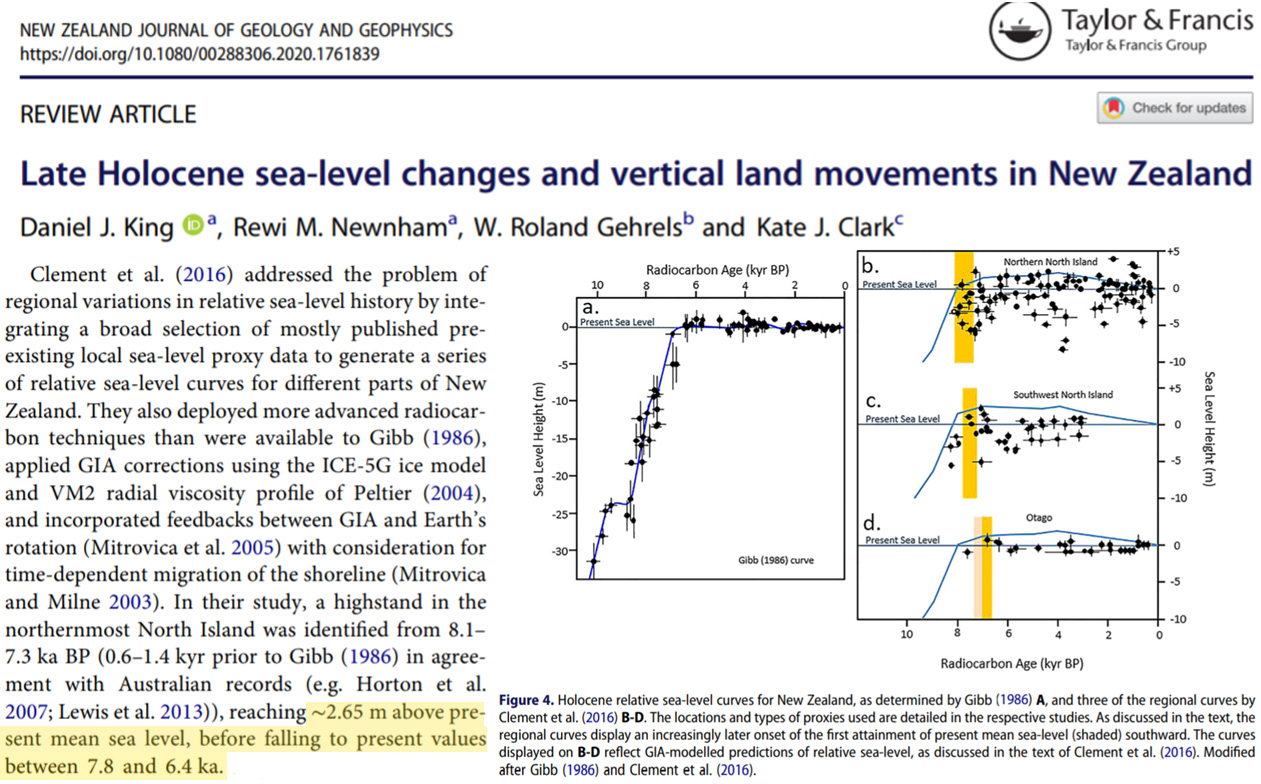
King et al., 2020 New Zealand, +2.65 m above present
“Regional tectonics dominate the relative sea-level signature across much of New Zealand, and trends of uplift and subsidence can vary significantly depending on the timescale of analysis. … Clement et al. (2016) addressed the problem of regional variations in relative sea-level history by integrating a broad selection of mostly published preexisting local sea-level proxy data to generate a series of relative sea-level curves for different parts of New Zealand. … In their study, a highstand in the northernmost North Island was identified from 8.1–7.3 ka BP (0.6–1.4 kyr prior to Gibb (1986) in agreement with Australian records (e.g. Horton et al. 2007; Lewis et al. 2013)), reaching ∼2.65 m above present mean sea level, before falling to present values between 7.8 and 6.4 ka.”
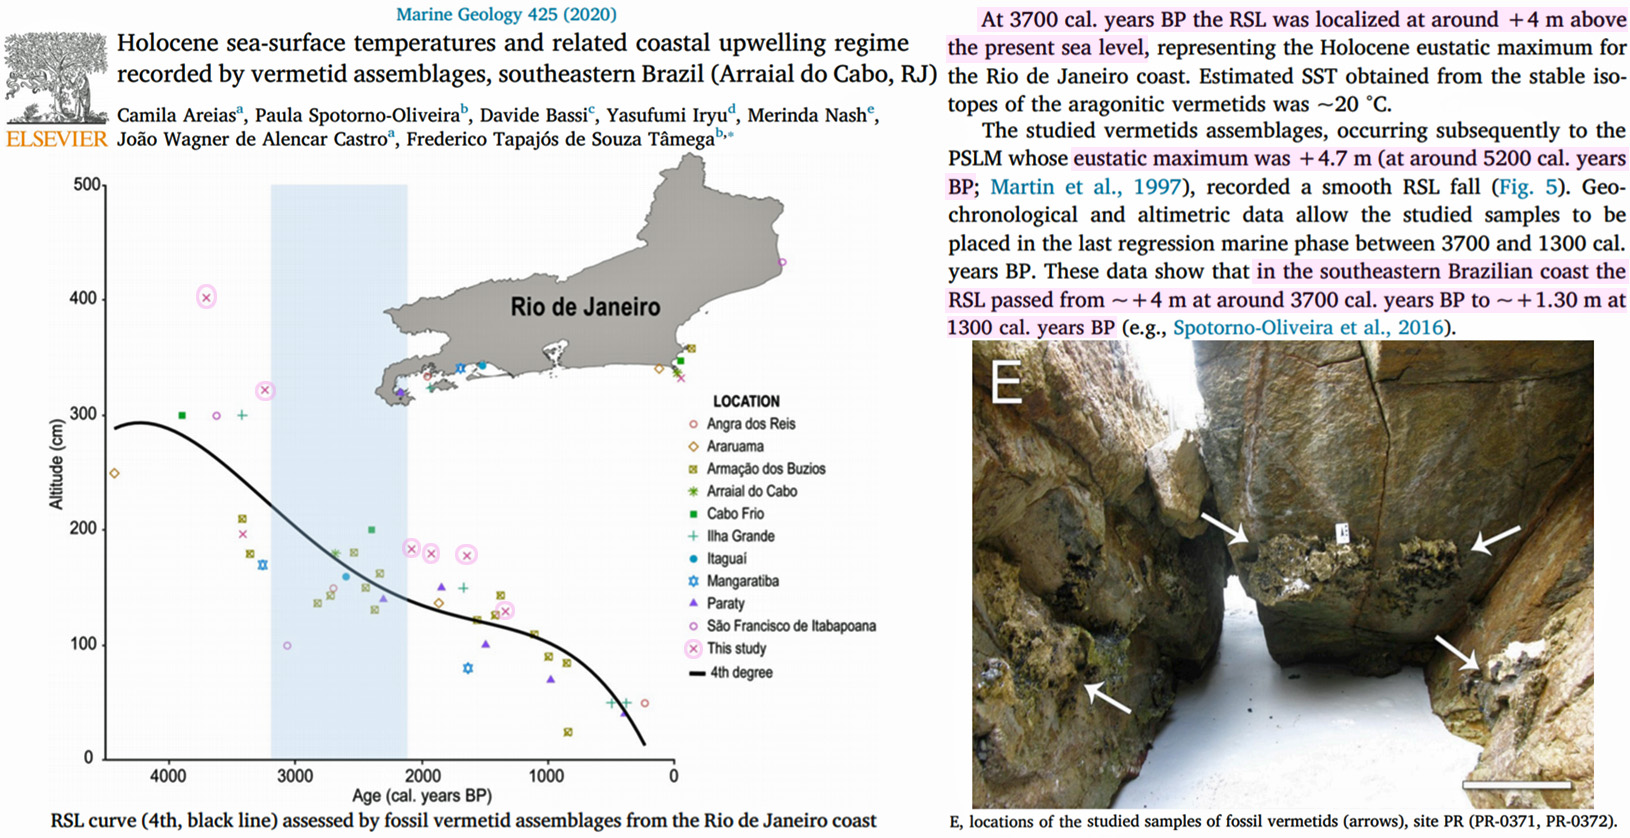
Areias et al., 2020 Brazil, +4 m higher than present
“At 3700 cal. years BP the RSL was localized at around +4 m above the present sea level, representing the Holocene eustatic maximum for the Rio de Janeiro coast. Estimated SST obtained from the stable isotopes of the aragonitic vermetids was ~20 °C. At ~3300 cal. years BP during the RSL fall the SST reached its upper-Holocene maximum temperature of ~22 °C. At ~2000 cal. years BP, the RSL was +2 m and an intensification of the upwelling events brought about lower SST (~17 °C) in the intertidal/supratidal settings than offshore. … The following period (from ~1900 to ~1300 cal. years BP), characterized by a continuous sea-level fall, recorded a SST of ~20.5 °C, higher than before. … These data show that in the southeastern Brazilian coast the RSL passed from ~ + 4 m at around 3700 cal. years BP to ~ + 1.30 m at 1300 cal. years BP (e.g., Spotorno-Oliveira et al., 2016).”
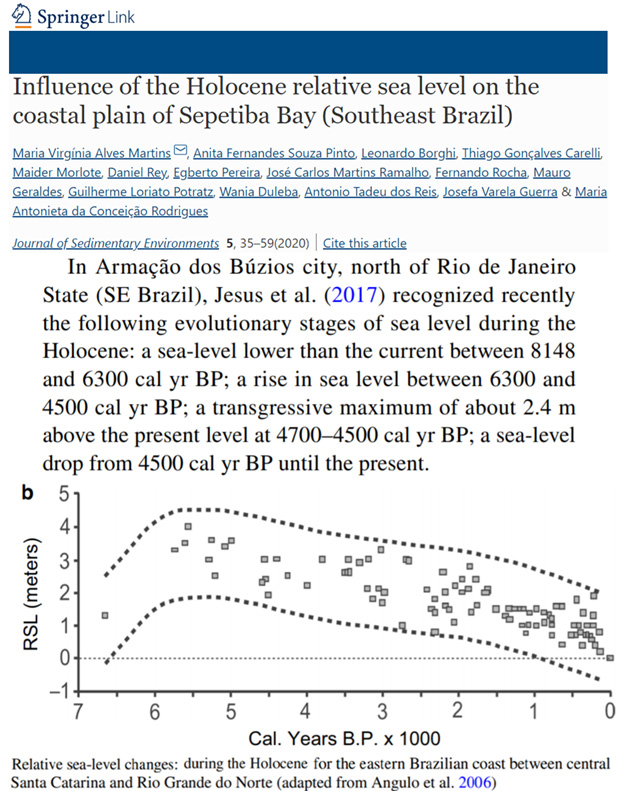
Martins et al., 2020 SE Brazil, +2.4 m above present
“In Armação dos Búzios city, north of Rio de Janeiro State (SE Brazil), Jesus et al. (2017) recognized recently the following evolutionary stages of sea level during the Holocene: a sea-level lower than the current between 8148 and 6300 cal yr BP; a rise in sea level between 6300 and 4500 cal yr BP; a transgressive maximum of about 2.4 m above the present level at 4700–4500 cal yr BP; a sea-level drop from 4500 cal yr BP until the present.”
Parker et al., 2020 East Saudi Arabia, +2.8 – 3.75 m higher than present
“The sediments record rapid transgression during the early Holocene with a mid-Holocene high-stand immediately prior to 6880-6560 cal. BP when the upper limit for the palaeo Mean Highest High tide water (MHHW) was 2.8-3.10 m above present day mean sea level. Transgression continued until shortly after 5575-5310 cal. BP with an upper limit to the palaeo-MHHW of 3.75 m above present sea levels.”
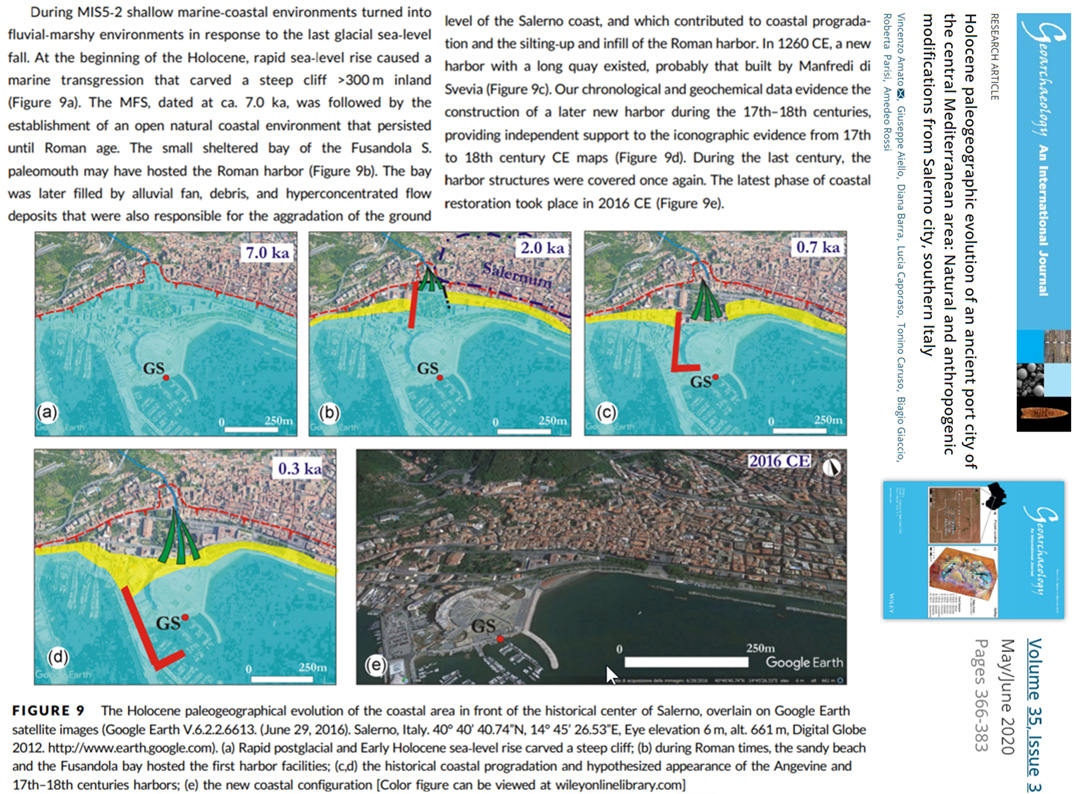
Amato et al., 2020 Italy, current coast still underwater just 300 years ago (0.3 ka)
“During MIS5‐2 shallow marine‐coastal environments turned into fluvial‐marshy environments in response to the last glacial sea‐level fall. At the beginning of the Holocene, rapid sea‐level rise caused a marine transgression that carved a steep cliff >300 m inland (Figure 9a). The MFS, dated at ca. 7.0 ka, was followed by the establishment of an open natural coastal environment that persisted until Roman age. The small sheltered bay of the Fusandola S. paleomouth may have hosted the Roman harbor (Figure 9b). … In 1260 CE, a new harbor with a long quay existed, probably that built by Manfredi di Svevia (Figure 9c). Our chronological and geochemical data evidence the construction of a later new harbor during the 17th–18th centuries, providing independent support to the iconographic evidence from 17th to 18th century CE maps (Figure 9d). During the last century, the harbor structures were covered once again. The latest phase of coastal restoration took place in 2016 CE (Figure 9e).”