By Paul Homewood
John Curtin, Executive Director at the Environment Agency, gleefully posted this on Twitter last week.
It was intended to persuade us that there is a “climate emergency”. Instead, it serves as a damning verdict on the Environment Agency’s incompetence, as we shall now see.

https://twitter.com/johncurtinEA/status/1231851017937047554
The claim that last month’s were made worse by climate change has been made many times, and hinted at in this latest EA press release:
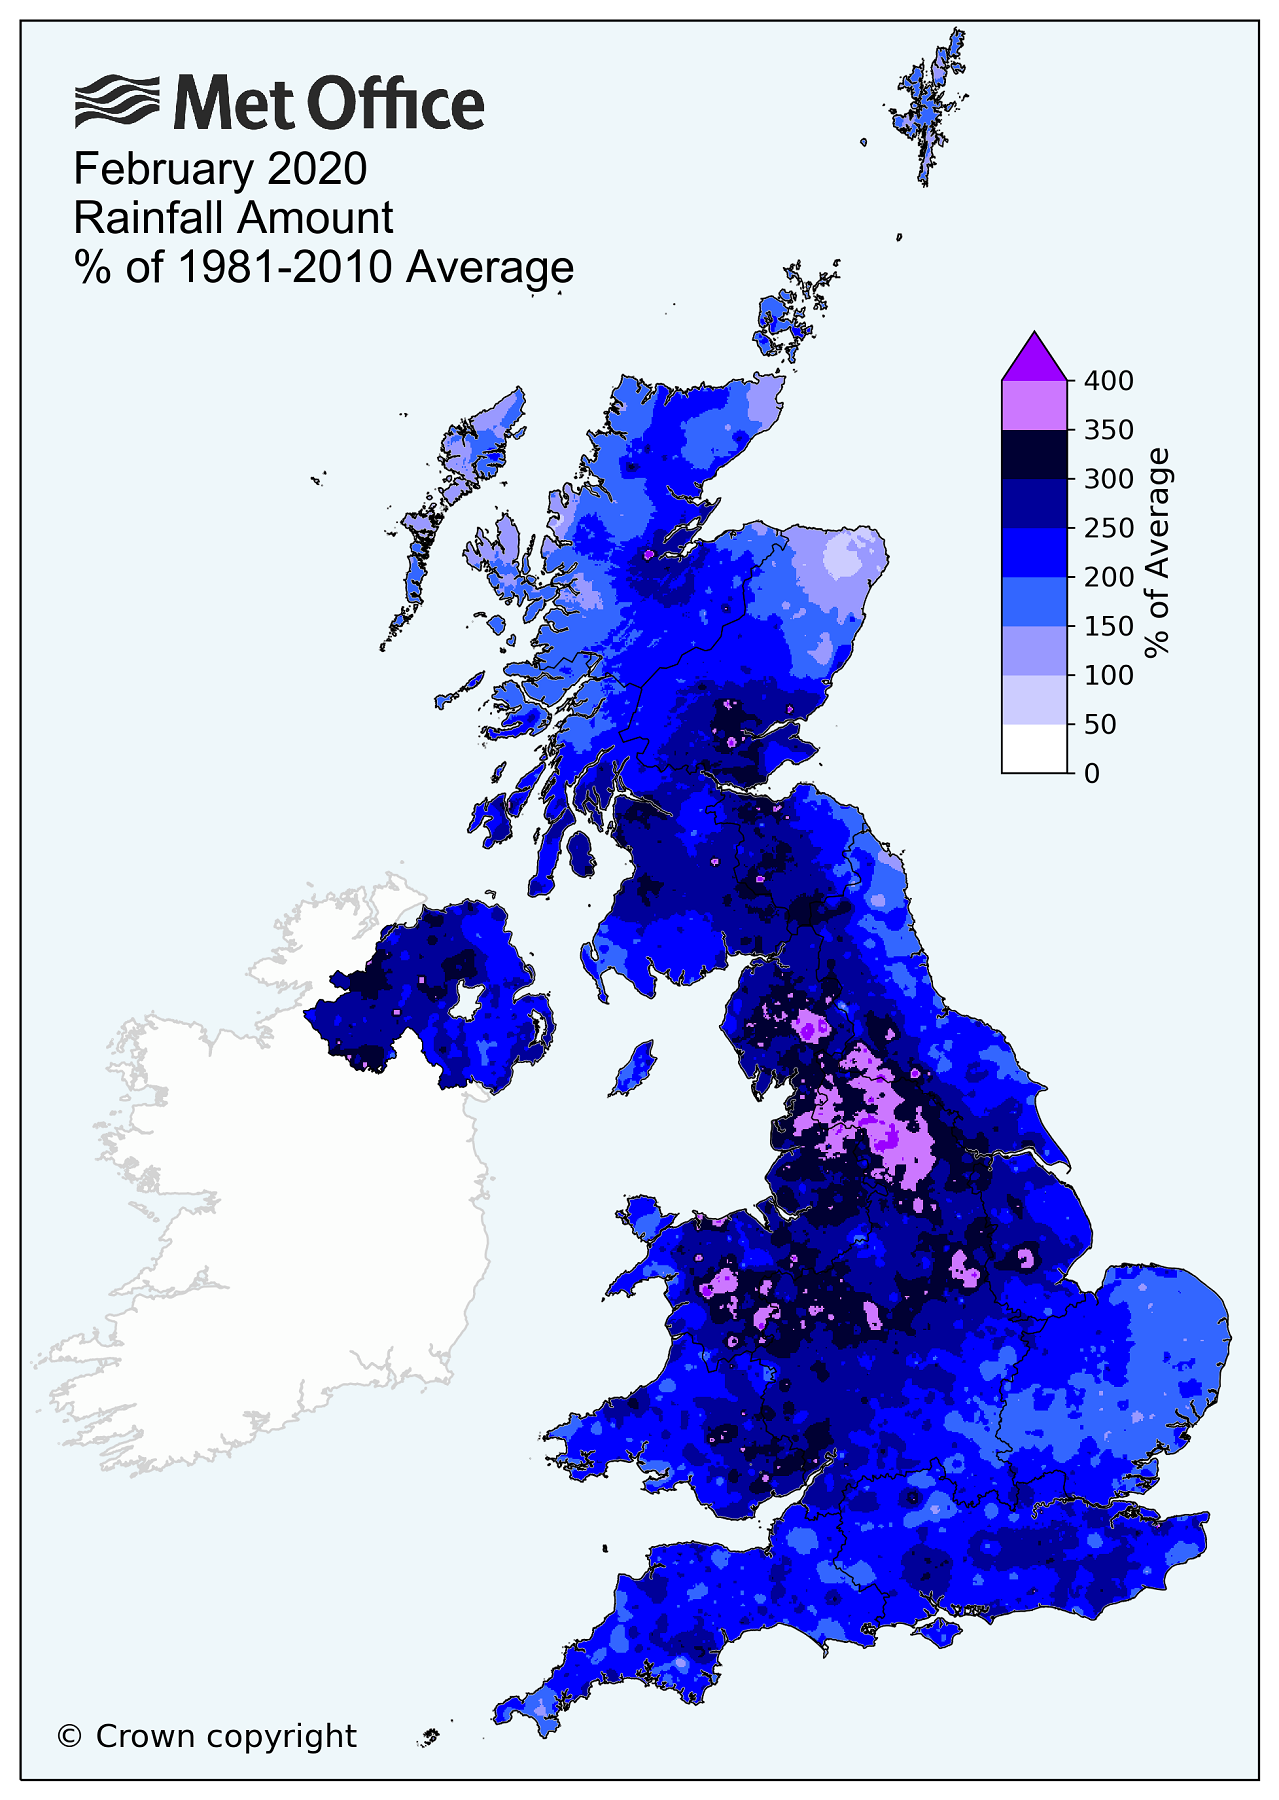
According to new Met Office statistics, February 2020 has been the wettest February on record for England. It has also been the fifth wettest of any calendar month since 1862. Provisional figures show that 15 rivers in the Midlands, Yorkshire and Lancashire recorded their highest ever levels during or triggered by Storm Ciara and Storm Dennis.
In fact, as I pointed out the other day, last month’s rainfall was a long way from being unprecedented, even though it was a record for February. In England, it was not the fifth wettest of any calendar month, as the EA wrongly claim, but the 24th wettest. The wettest month on record was all the way back in 1903.
Similarly in Wales, where heavy rainfall has led to flooding on the Severn and Wye, it was only 14th wettest, with the record month long ago in 1929.
Whilst the England figure could disguise ups and downs across the country, the Wales graph is particularly relevant, as rain over the Brecons caused bad flooding in the S Wales valleys, and long the River Wye. At the same time rain in the north of Wales fed down into the Severn Valley. In other words, pretty much the whole of Wales took the brunt of Storm Dennis that day.


https://www.metoffice.gov.uk/research/climate/maps-and-data/uk-and-regional-series
This leads us to the question of why the floods were so bad that they set so many records.
The first thing to note is that December and January were pretty much average for rainfall in the regions most badly affected by the floods, notably South Wales, the Severn Valley and NW England. So the severity of the flooding was not due to cumulative rainfall over the winter as a whole.


https://www.metoffice.gov.uk/research/climate/maps-and-data/uk-actual-and-anomaly-maps
And as we have seen, the rainfall in February does not appear to have been that unusual.
Even in the NW of England & N Wales, where rainfall was the worst of all in terms of average, Feb 2020 was well down the list of wettest months:

https://www.metoffice.gov.uk/hadobs/hadukp/data/monthly/HadNWEP_monthly_qc.txt
But what about extreme daily rainfall? Has this led to record flooding?
To answer this question, we will need to look at the two main storms individually:
Storm Ciara
It was Ciara, of course, which led to the flooding in the Calder Valley. Although various claims were touted about of the “one month’s rainfall in a day” variety, these were based on high altitude sites in the Pennines, against which we have no comparative data.
We do, however, have regionally averaged daily rainfall from the Met Office’s HADUKP database.
The Calder floods would have been largely the result of rainfall in the North West, which would include most of the moorland which feeds that river.

https://www.metoffice.gov.uk/hadobs/hadukp/
According to HADUKP, rainfall in the North West averaged 32.6mm on the day that Ciara hit. (Rainfall the day before and after was insignificant):

https://www.metoffice.gov.uk/hadobs/hadukp/
Since 1931 alone, there have been thirteen days which have exceeded this figure. Given what we know about heavy rainfall months prior to 1931, there will certainly be many other such days previously.
I do, by the way, accept that localised rainfall may have been heavier in the Calder Valley area, but that would be weather, not climate change.
Storm Dennis

https://www.metoffice.gov.uk/hadobs/hadukp/data/download.html
Again with the proviso that Wales received the brunt of Storm Dennis, the daily rainfall for SW England & S Wales shows nothing extraordinary at all that day.
Average rainfall that day was 33.84mm, but there have been 13 wetter days since 1931. As I showed in a post at the time, 48-hour rainfall totals S Wales during Storm Dennis peaked at 157mm, but it is easy to find examples of higher rainfalls in that same area.
Wild claims have been made by the EA and Met Office that the floods last month are linked to climate change, yet neither has provided any detailed data to back up this assertion. All we get are soundbites about “wettest February on record”, “a month’s rain in 24 hours”, and so on.
If they have the data to back up their assertions, then let them publish.
But unless they can , we can only assume that the record floods are in fact due to poor river maintenance, and not record rainfall.
Finally, a bit of perspective.
At the last count, I understand about 3300 homes have been flooded. To have your home flooded is a terrible experience, but in overall terms, 3300 is not an abnormally high number. In the summer of 2007, for instance, 55000 homes were flooded.
Secondly, as the Met Office explain, the wet weather was due to the jet stream:

There is no evidence to link this phenomenon with climate change. And given the fact that there have been many wetter months a long time ago in both England and Wales, it is evident that this sort of weather has occurred before.
Which of course brings us back to the question of why so many river gauge records have been broken.
It clearly suits the Environment Agency to blame “climate change”, rather than admit to their own shortcomings and incompetence.