By Jo Nova
Hitting the presses today, the vacuous news that lots of companies picked huge numbers out of the air using broken models to guess hyperbolic climate losses coming in the next five years, counter to all the trends for the last hundred years which show declining losses on a GDP basis. The world got warmer but the disasters got less nasty. Less bushfire, less cyclones, less tornadoes, less death per capita. The trends are all good. The only thing that’s up is the number of panic merchants.
World’s biggest firms foresee $1 trillion climate cost hit
LONDON (Reuters) – More than 200 of the world’s largest listed companies forecast that climate change could cost them a combined total of almost $1 trillion, with much of the pain due in the next five years, according to a report published on Tuesday.
So hundreds of companies have offered the climate world a free hit for PR by making a guess. They fall into two kinds of companies –The badgered and harried and the profiteers. See below for examples. Firstly, here’s the only chart that matters.
Global Weather losses are down:
If CO2 causes climate events we need more of it. The costs of disasters is rising (like everything else) but it’s a smaller part of our GDP.
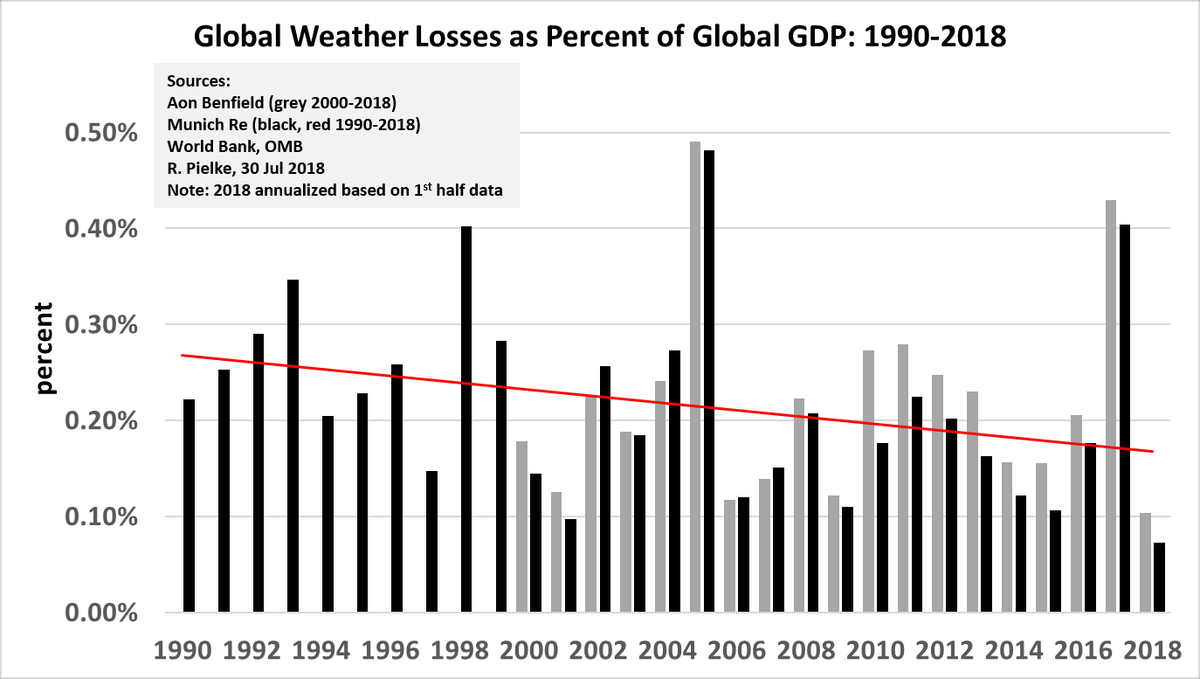
Global weather losses are decreasing (note the 2018 bars are only to June 30th 2018). Roger Pielke
In constant 2017 US dollars, both weather-related and non-weather related catastrophe losses have increased, with a 74% increase in the former and 182% increase in the latter since 1990. However, since 1990 both overall and weather/climate losses have decreased as proportion of global GDP, indicating progress with respect to the SDG indicator…
— See Pielke 2018 for more info or his blog ClimateFix or twitter account.
The Global Death Rate from natural disasters is down
Our World in Data shows deaths are down per capita from fire, landslide, storm, flood, extreme temperatures and drought.

Global death rate from disasters last century, per capita, per decade. Our World in Data. Hannah Ritchie and Max Roser.
Companies are adding up costs because they profit or they’re badgered
There are two types of companies responding to the activists.
1/ The badgered and harried who fear a legal or PR fail if they don’t “pick a number” and join the cheer squad. What CEO wants to fight this? It’s so much easier just to comply, and make something up. We know they don’t believe it or they’d be selling low-lying land, building sea walls, lobbying for nuclear power etc, which they’re not.
2/ The profiteers – The Green industry is worth at least $1.5 trillion annually (Climate Change Business Journal, 2015). The potential global carbon market is worth $7 trillion. That’s a lot of carrot.
There are four flavours of money-makers in this:
- Insurance companies. Wouldn’t they love to scare the customers. Tick yes. How can they lose?
- People who want to broker a global carbon market (that’s every financial house and banker known to man),
- Corporates that sell wind, solar, batteries, electric cars, etc (GE, Panasonic, Tesla, Vestas) It’s a $300b industry.
- Groups that have invested in renewables (like Google, Apple, even the BBC superannuation fund).
Storms, tornadoes, wildfires, they’re either the same or less common
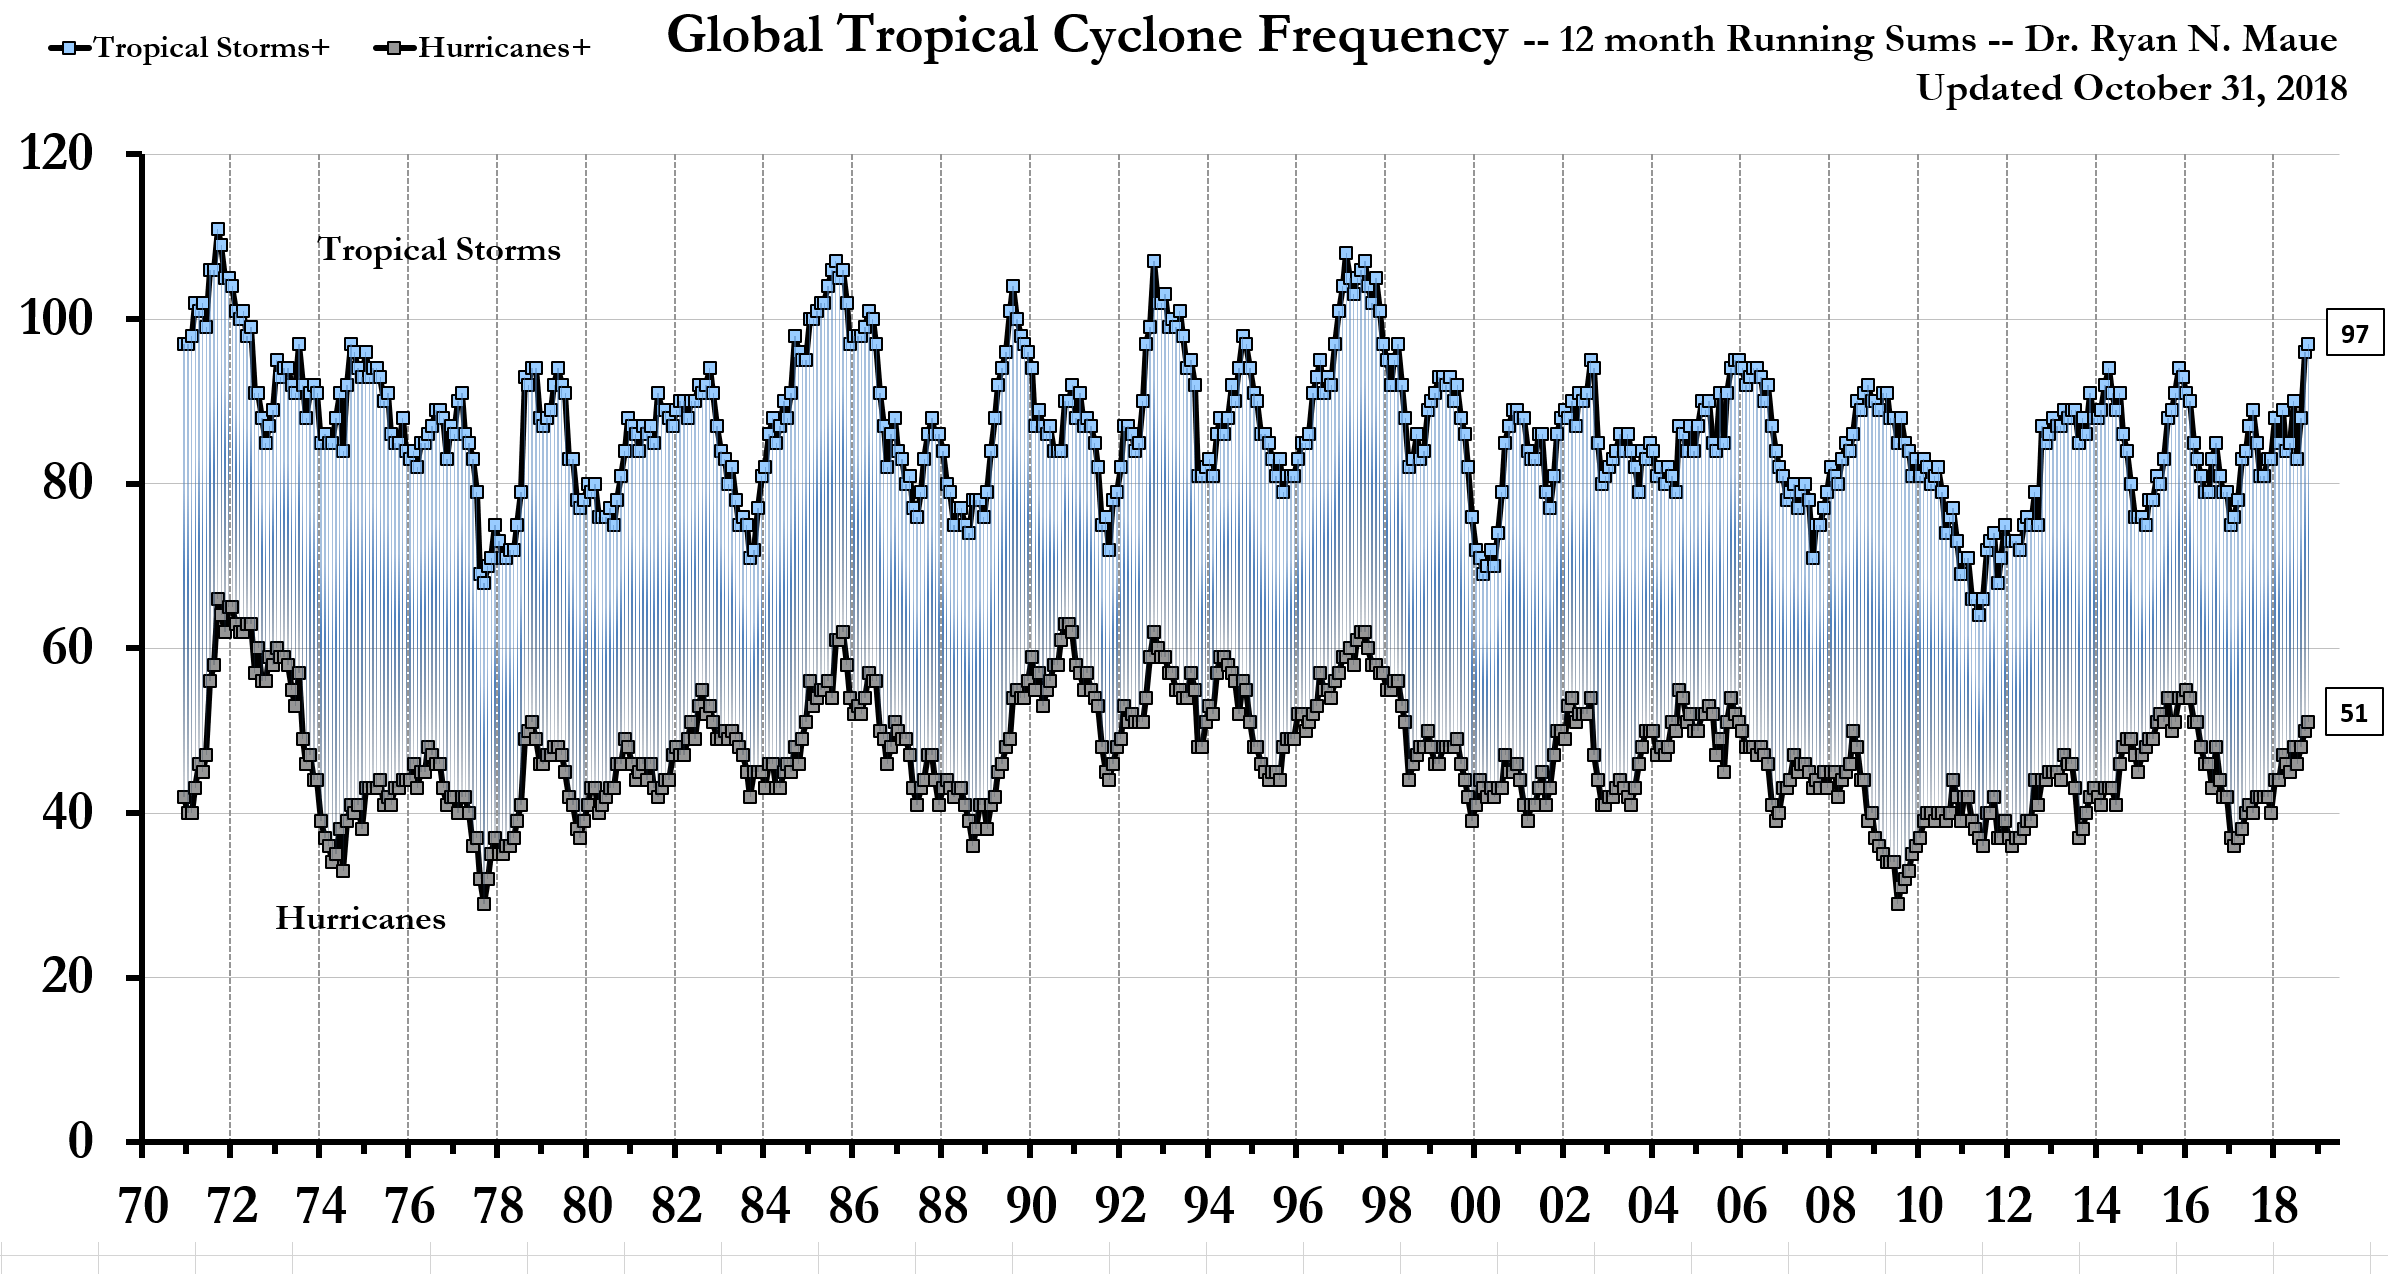
Tropical Cyclones, Global trends, Ryan Maue, ACE Index, October 2018. Graph
The trend in tornadoes is down, and when there are more its due to cold weather
Roy Spencer explains that the unusually cold mass of air over central USA means lately there are more tornadoes. It’s the strong wind shear at the border between warm and cold air bodies that causes it.

Tornadoes, 1954-2018, Graph. AEI. NOAA.
Global wildfires are decreasing
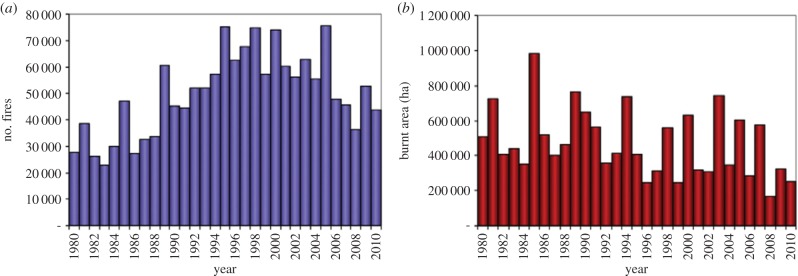
Figure 2. Wildfire occurrence (a) and corresponding area burnt (b) in the European Mediterranean region for the period 1980 – 2010. Source: San-Miguel-Ayanz et al. [37].
Global droughts unchanged in 60 years
REFERENCES
Pielke, J. (2018) Tracking Progress on the Economic Costs of Disasters Under the Indicators of the Sustainable Development Goals, Environmental Hazards. https://www.tandfonline.com/doi/full/10.1080/17477891.2018.1540343
Homewood, P. (2019) Tropical Hurricanes, In the age of Global Warming, GWPF.
Maue, R. (2019) Ahttps://policlimate.com/tropical/
Global trends in wildfire and its impacts: perceptions versus realities in a changing world. Philos Trans R Soc Lond B Biol Sci. 2016 Jun 5;371(1696). pii: 20150345. doi: 10.1098/rstb.2015.0345.
see also: NASA Detects Drop in Global Fires (GWPF)
Scientists find a surprising result on global wildfires: They’re actually burning less land (GWPF)
Global Wildfires are decreasing
h/t Dan M, and Pat