
Sun As Main Driver: Japanese Scientist Cites 7 Major Examples How Real Climatic Data Contradict AGW Claims
[email protected]
1. Warmer period of the 1930s
In 1998 D. Dahl-Jensen et al. pointed out in the journal Science that the 1930s is 0.5°K warmer than the present time based on a bore-hole study of Greenland ice sheet.
The following data support D. Dahl-Jensen’s findings, from Soon 2012.
Also heat waves were far worse across the USA in the 1930s:
More heat waves in the 1930s.
The strongest hurricane was the Labor Day hurricane, which hit in 1935. Hurricane Irma and Harvey had much higher central pressure at landfall. (U.S .National Hurricane Center):
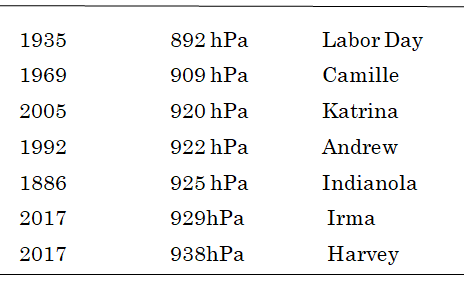
Strongest hurricane occurred in the 1930s.
2. Arctic temperature and sea ice extent
Parts of the Arctic were warmer in the 1930s:
Source: Real Climate Science.
Arctic sea ice levels were just as low in the 1930s as they are today:
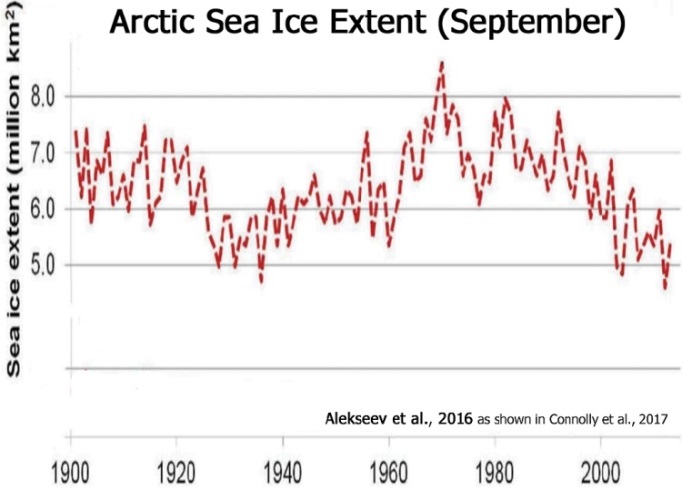
Read more here.
3. NASA & NOAA altered the data
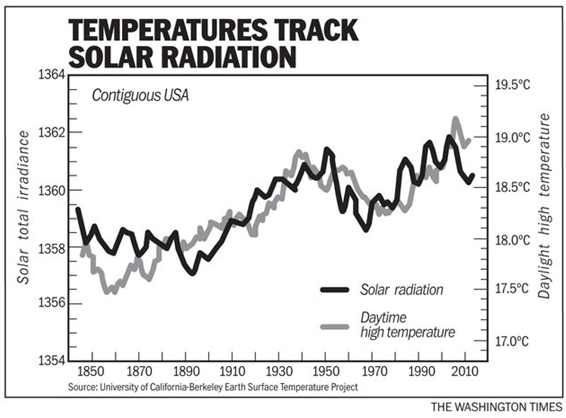
The climatic data above can be understood with solar activity change (aa Index) and ocean oscillation (Pacific Decadal Oscillation Index), see the 2 charts that follow.
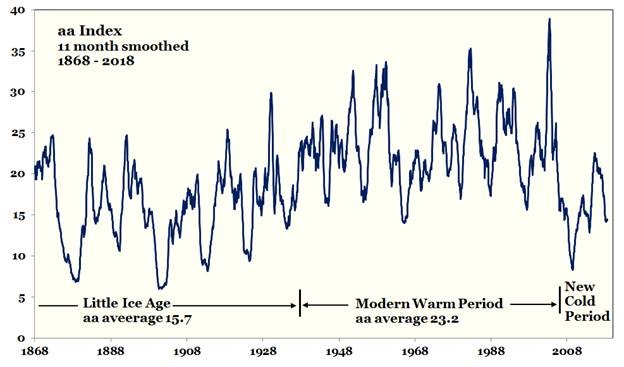
(Archibald)
The Pacific Decadal Oscillation (PDO) index was also in its warm phase during the 1930s:
PDO index was positive from1925 to1945. Data: Japan Meteorological Agency.
In summary, increasing solar activity with positive PDO index caused the warmer period of the 1930s. However, NASA and NOAA have made data tampering to stress recent warming.
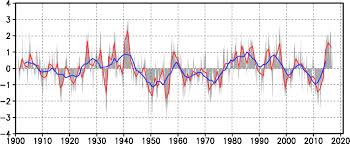
Recent temperature data shows strong influence of ocean oscillation (El Nino) and no relation with CO2 increase as follows:
Source: Climate4you
4. MWP & LIA caused by changes in solar activity
Solar activity proxies show the MWP & the LIA in Japan and China as follows:
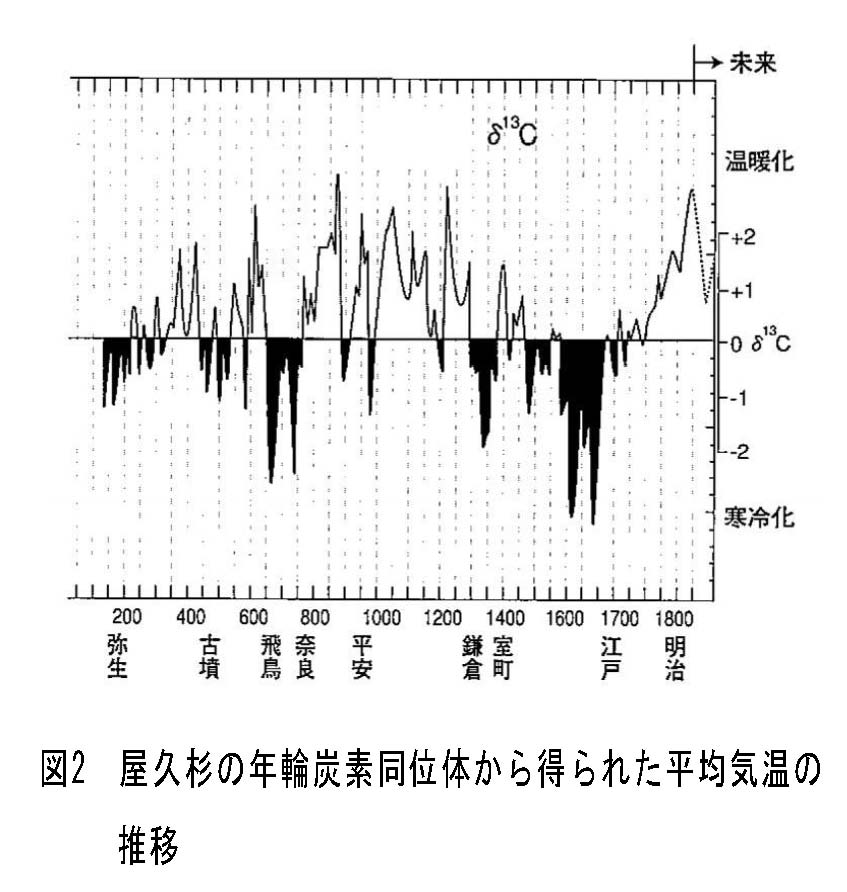
Chart above: Kitagawa, H. & Matsumoto, E., Geophysical Research Letters, Vol. 22, 2155-2158, 1995
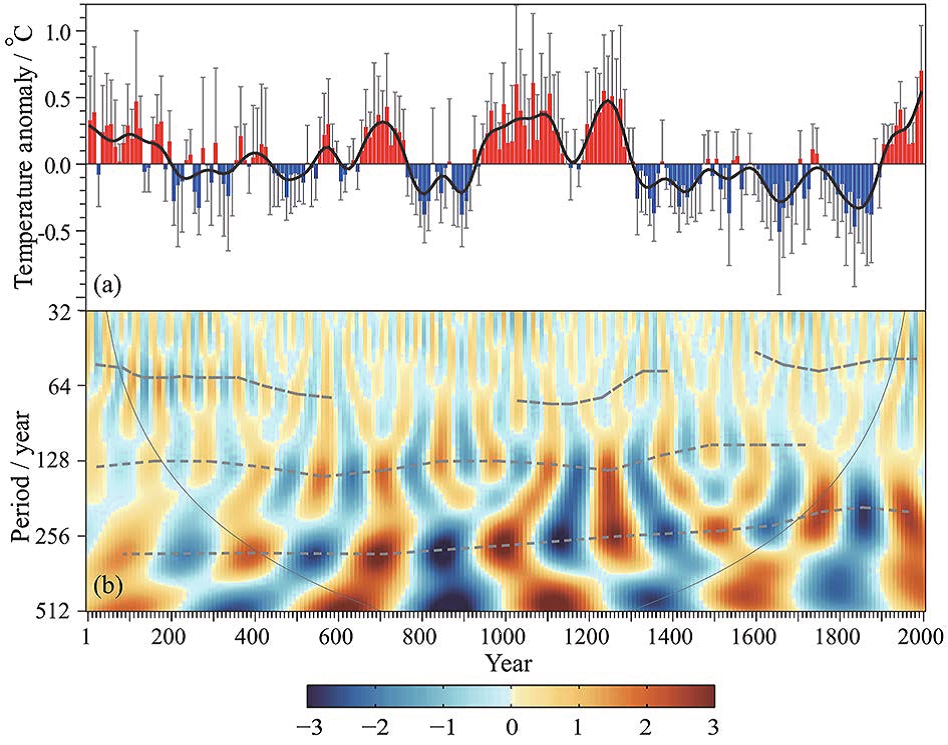
Graphic above: Quansheng GE. et al., Advances in atmospheric sciences, Vol. 34, 941-951, 2017.
There are hundreds of other proxies worldwide that support solar activity as the main climate driver.
5. Sea level rise
Almost 25-years of meticulous data gathered by the Australian Bureau of Meteorology displays no discernible sea-level rise for Solomon Islands and Nauru. See the two graphs that follow:
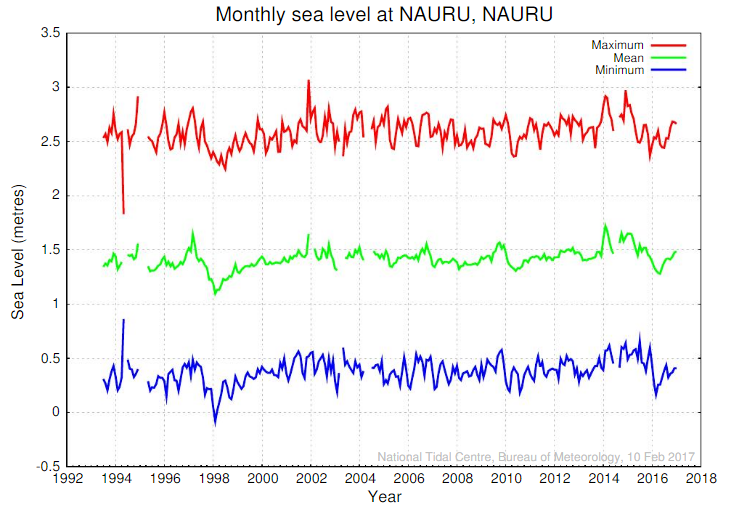
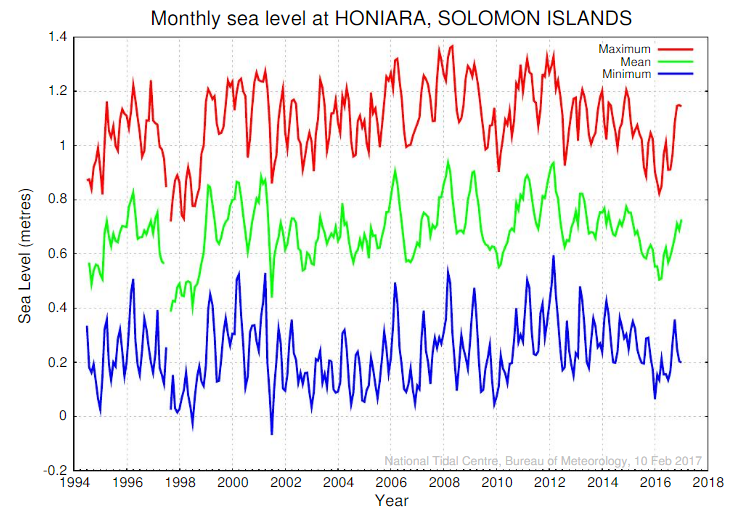
Source: WUWT.
6. El Nino linked to solar activity
A publication by Njau (2006) showed El Nino starts at the year of sunspot minimum or maximum, thus showing that solar activity has a major impact on oceanic oscillations, which in turn powerfully impact weather and climate.
7. Extreme weather and solar activity
Bucha (1988) showed decreased solar activity causes meandering of jet stream which produces extreme weather in broad area. Since 2006 decreased solar activity has been causing heat waves, wildfires and heavy rainfall and snowfall all over the world.

Bucha (1988)


