https://fabiusmaximus.com/2018/09/19/alabama-debunks-a-nyt-climate-story/
By Larry Kummer, Editor Science & Nature 19 September 2018
Summary: The NY Times gives a story with bold numbers, confidently stated. Too bad their fact-checkers did not notice that their numbers are grossly misleading. Propaganda pretending to be science. This does not help, even if well-intended. The State Climatologist of Alabama tells the real story.

The Alabama Climate Report, August 2018.
By John R. Christy, Alabama State Climatologist.
Also Professor of Atmospheric Science and Director of the Earth System Science Center
at the U of AL in Huntsville. Links added.
Meteorological summer (June, July and August) is over. It is time to check how the summer temperatures compare with other years. For a research project a few years ago we developed a statewide summer temperature index for four 100-mile diameter regions centered on the major cities of the state – Mobile, Montgomery, Birmingham and Huntsville – going back to 1883. This summer will go down in that database and in NOAA’s official records as being slightly cooler than average.
Somewhat related to this, a reader sent me a link to a New York Times interactive website that claims to provide the number of days above 90°F each year for cities across the country: “How Much Hotter Is Your Hometown Than When You Were Born?” The results are produced for the Times by Climate Impact Lab (some might call it an environmental pressure group).
Since I build numerous datasets of this type, I took a look. The website asks you for the town and year in which you were born, then provides a time series purportedly showing the number of 90°F days per year since your birth and how that has increased.
Though a native of California, I have lived in Huntsville more years than any other place, so I put in my birth year and Huntsville as my hometown. Immediately I became suspicious when their dataset started only recently in 1960 (and a few years after my birth). …
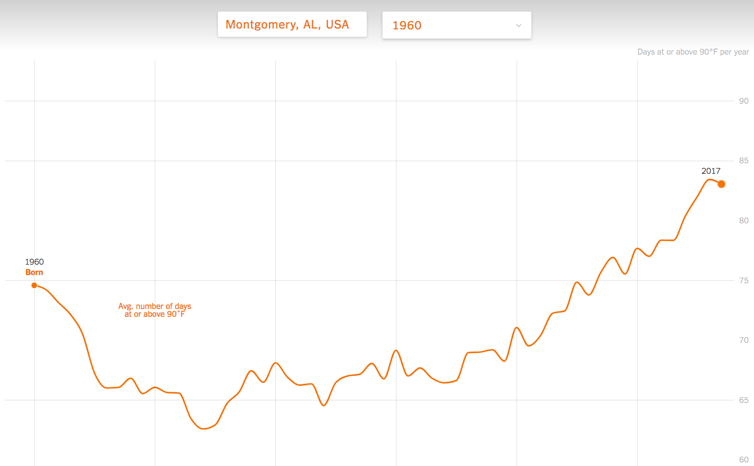
For Huntsville and Montgomery, here are their results. Quite scary. It appears that the number of 90°F days has risen to their highest levels ever. It says that in 1960 Huntsville had 45 days above 90°F, but by 2017 it was 57 days and rising.
Huntsville, Alabama.
Montgomery, Alabama.
Then, to make matters even scarier, they use climate model projections to 2090 to tell me that in 2040, when I’m 80, there will be 73 such hot days in Huntsville (as shown below). Yikes!
Huntsville’s future per RCP4.5!
Editor’s note – From the NYT website.
“For each year, the count of days at or above 90 degrees reflects a 21-year rolling average. Temperature observations for your hometown are averaged over an area of approximately 625 km² (240 square miles), and may not match single weather-station records.
“The time series is based on historical data for 1960-2000. The 2001-2020 period relies on a combination of historical data and future projections. After 2020, the data uses a mixed climate model that captures a broad range of extreme temperature responses. The “likely” future range reflects outcomes with 66 percent probability of occurrence in the RCP 4.5 scenario.”
The rest of the story
Before you sell your house and move to Canada, let’s take a look at the real story. Having built many climate datasets of Alabama, some starting as early as 1850, I knew the Times story was designed to create alarm and promote the claim that humans who use carbon-based energy (gasoline, natural gas, coal) to help them live better lives are making our summers ever more miserable. Be aware reader, this webtool is not designed to provide accurate information.
First of all, climate data for Alabama began in the 19th century, not 1960. In 2016 Dr. Richard McNider (Alabama’s former State Climatologist) and I published a carefully constructed time series of summer temperatures for the state starting from 1883. This used numerous station records, including some that the federal government had not archived into its databases (which are the most common source for outfits like the Climate Impacts Lab.)
“Time Series Construction of Summer Surface Temperatures for Alabama, 1883–2014, and Comparisons with Tropospheric Temperature and Climate Model Simulations” in the Journal of Applied Meteorology and Climatology, March 2016.
I’ve updated that work to include summer temperatures through 2018. The result is below. Not only are summer daytime temperatures not rising, they have actually fallen over the last 136 years. After looking at the graph, why do you suppose the Climate Impacts Lab decided to start their charts in 1960?
We went a step further in that paper and demonstrated that climate models failed completely to replicate the downward temperature trend in Alabama over the past 120 years: 76 different models with a 100% failure rate. Would you trust these same models to tell you about the future as the Times does? Why did they not check the models for validity?
Now, what about the number of “hot” (or in Alabama we would say “typical”) 90°F days? For Alabama and the nation, I’ve calculated the average value per station each year since 1895. The results below speak for themselves (there is no increase of days hotter than 90°F) and expose the misinformation provided through the Times.
Providing accurate information on Alabama’s climate is what we do in our office. In fact, using real data, I can’t even come close to reproducing the images that the Climate Impacts Lab did which show 2010’s as having the most 90°F days in Alabama. I’m guessing they are using some theoretical output rather than sticking with observations. …I’ll check and follow-up as I can, but something is fishy.
This is a great state in which people can enjoy life and in which businesses can operate. Our climate resources are one of the reasons we are doing so well in recruitment. Occasionally though the time comes when I must address claims made by those whose intention is not to inform but to promote false alarm. This usually happens when an environmental pressure group generates a press release whose dramatic statements are published by a willing media (without any fact-checking). This is one of those times, and I’m sure it will not be the last.
——————– End of article. ——————–
A look at the world’s summers
From NOAA’s interactive Climate At A Glance page. This shows summers back to 1880. Only land temperatures are shown, since ocean temperature measurements are less reliable for much of this period. Summer 2018 was the fifth warmest summer since 1880, coming off the record warmth of the 2015-16 El Niño.
“It is extremely likely (95 – 100% certain) that human activities caused more than half of the observed increase in global mean surface temperature from 1951 to 2010.”
— From the Summary for Policymakers of the IPCC’s Fifth Assessment Report.
———————————————————————–—————


