Only a fraction of the Arctic saw a large warm spike
The reality is that weather charts showed that only a minority fraction of the Arctic had briefly reached the melting temperature, while the vast remainder was stuck at its usual 25 – 40°C below zero.
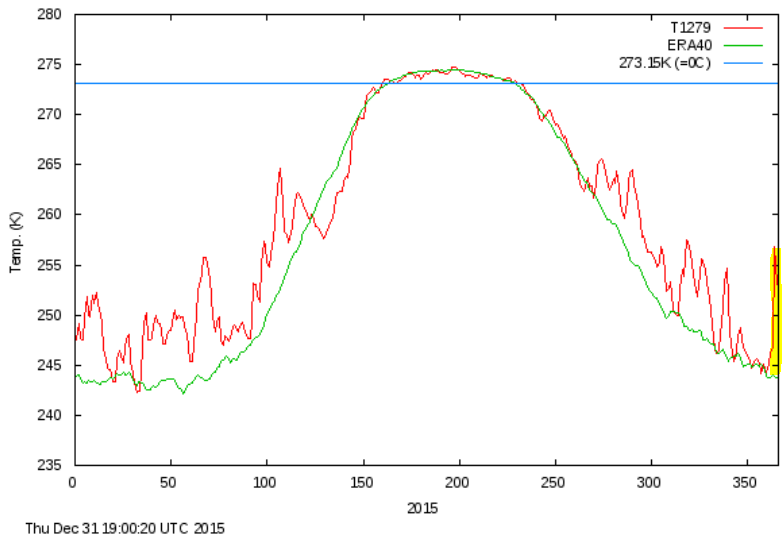
According to the Danish Meteorological Institute here, which has been systematically tracking Arctic temperatures north of 80° latitude since 1958, here’s what the 2015 “North Pole meltdown” really looked like (far right) once the whole Arctic region got factored in:
Chart: DMI.
The above figure shows that the temperature in the Arctic above 80°N was estimated to have risen only some 13°K during the event, and not 30°K as the WAPO tried having its readers think.
The fact is that only a small region near the North Pole saw a burst of warm southern air – lasting a few hours. The rest of the Arctic remained in it’s usual ice box. Almost immediately, temperatures at the North Pole position dropped back to -30°C.
Has a 13°K spike happened before?
Is it something weird and totally unusual that we need to worry about? Going back and looking at the DMI charts, we find that temperature spikes in the Arctic for the period early November to late March are nothing new.
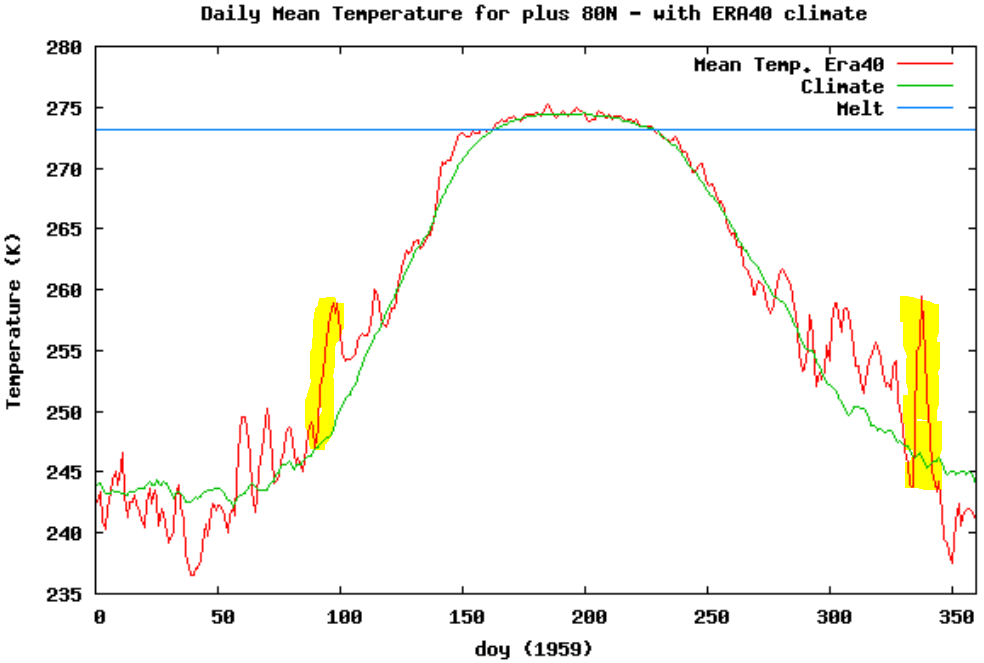
For example a look at the year 1959, the chart below shows that a similar temperature spike occurred not just once, but twice! (marked yellow).

Chart: DMI.
And examining all the years since 1958 we see that a temperature spike of some 12°K or more in a matter of a few days during the November – March deep winter period occurred more than 70 times!
In fact fluctuations of 10°K (i.e. similar to what just happened) are actually the norm for the North Pole region.
Also taking a look at the wild fluctuations seen in 1964, 1984, or 1990 – back when CO2 was at levels near the “safe” 350 ppm – we see they were far more extreme.
– See more at: http://notrickszone.com/2016/01/04/journalistic-fraud-north-pole-region-saw-similar-warm-spikes-before-over-70-times-in-last-58-years/#sthash.pjk3VsBf.dpuf


