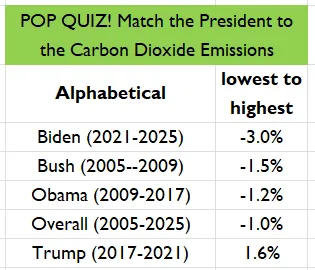
Do U.S. Presidents Matter for Carbon Dioxide Emissions Reduction? The answer is not what most people will expect April 29, 2024
Cheap Chinese EVs Pose a Threat to America’s Auto Industry – A China Made Electric Vehicle Is Coming to America This Summer April 29, 2024
Youth-led climate change lawsuits gain momentum with backing of liberal, dark money group – ‘Our Children’s Trust exploits kids, using them as political cover,’ Montana AG’s office reports April 29, 2024