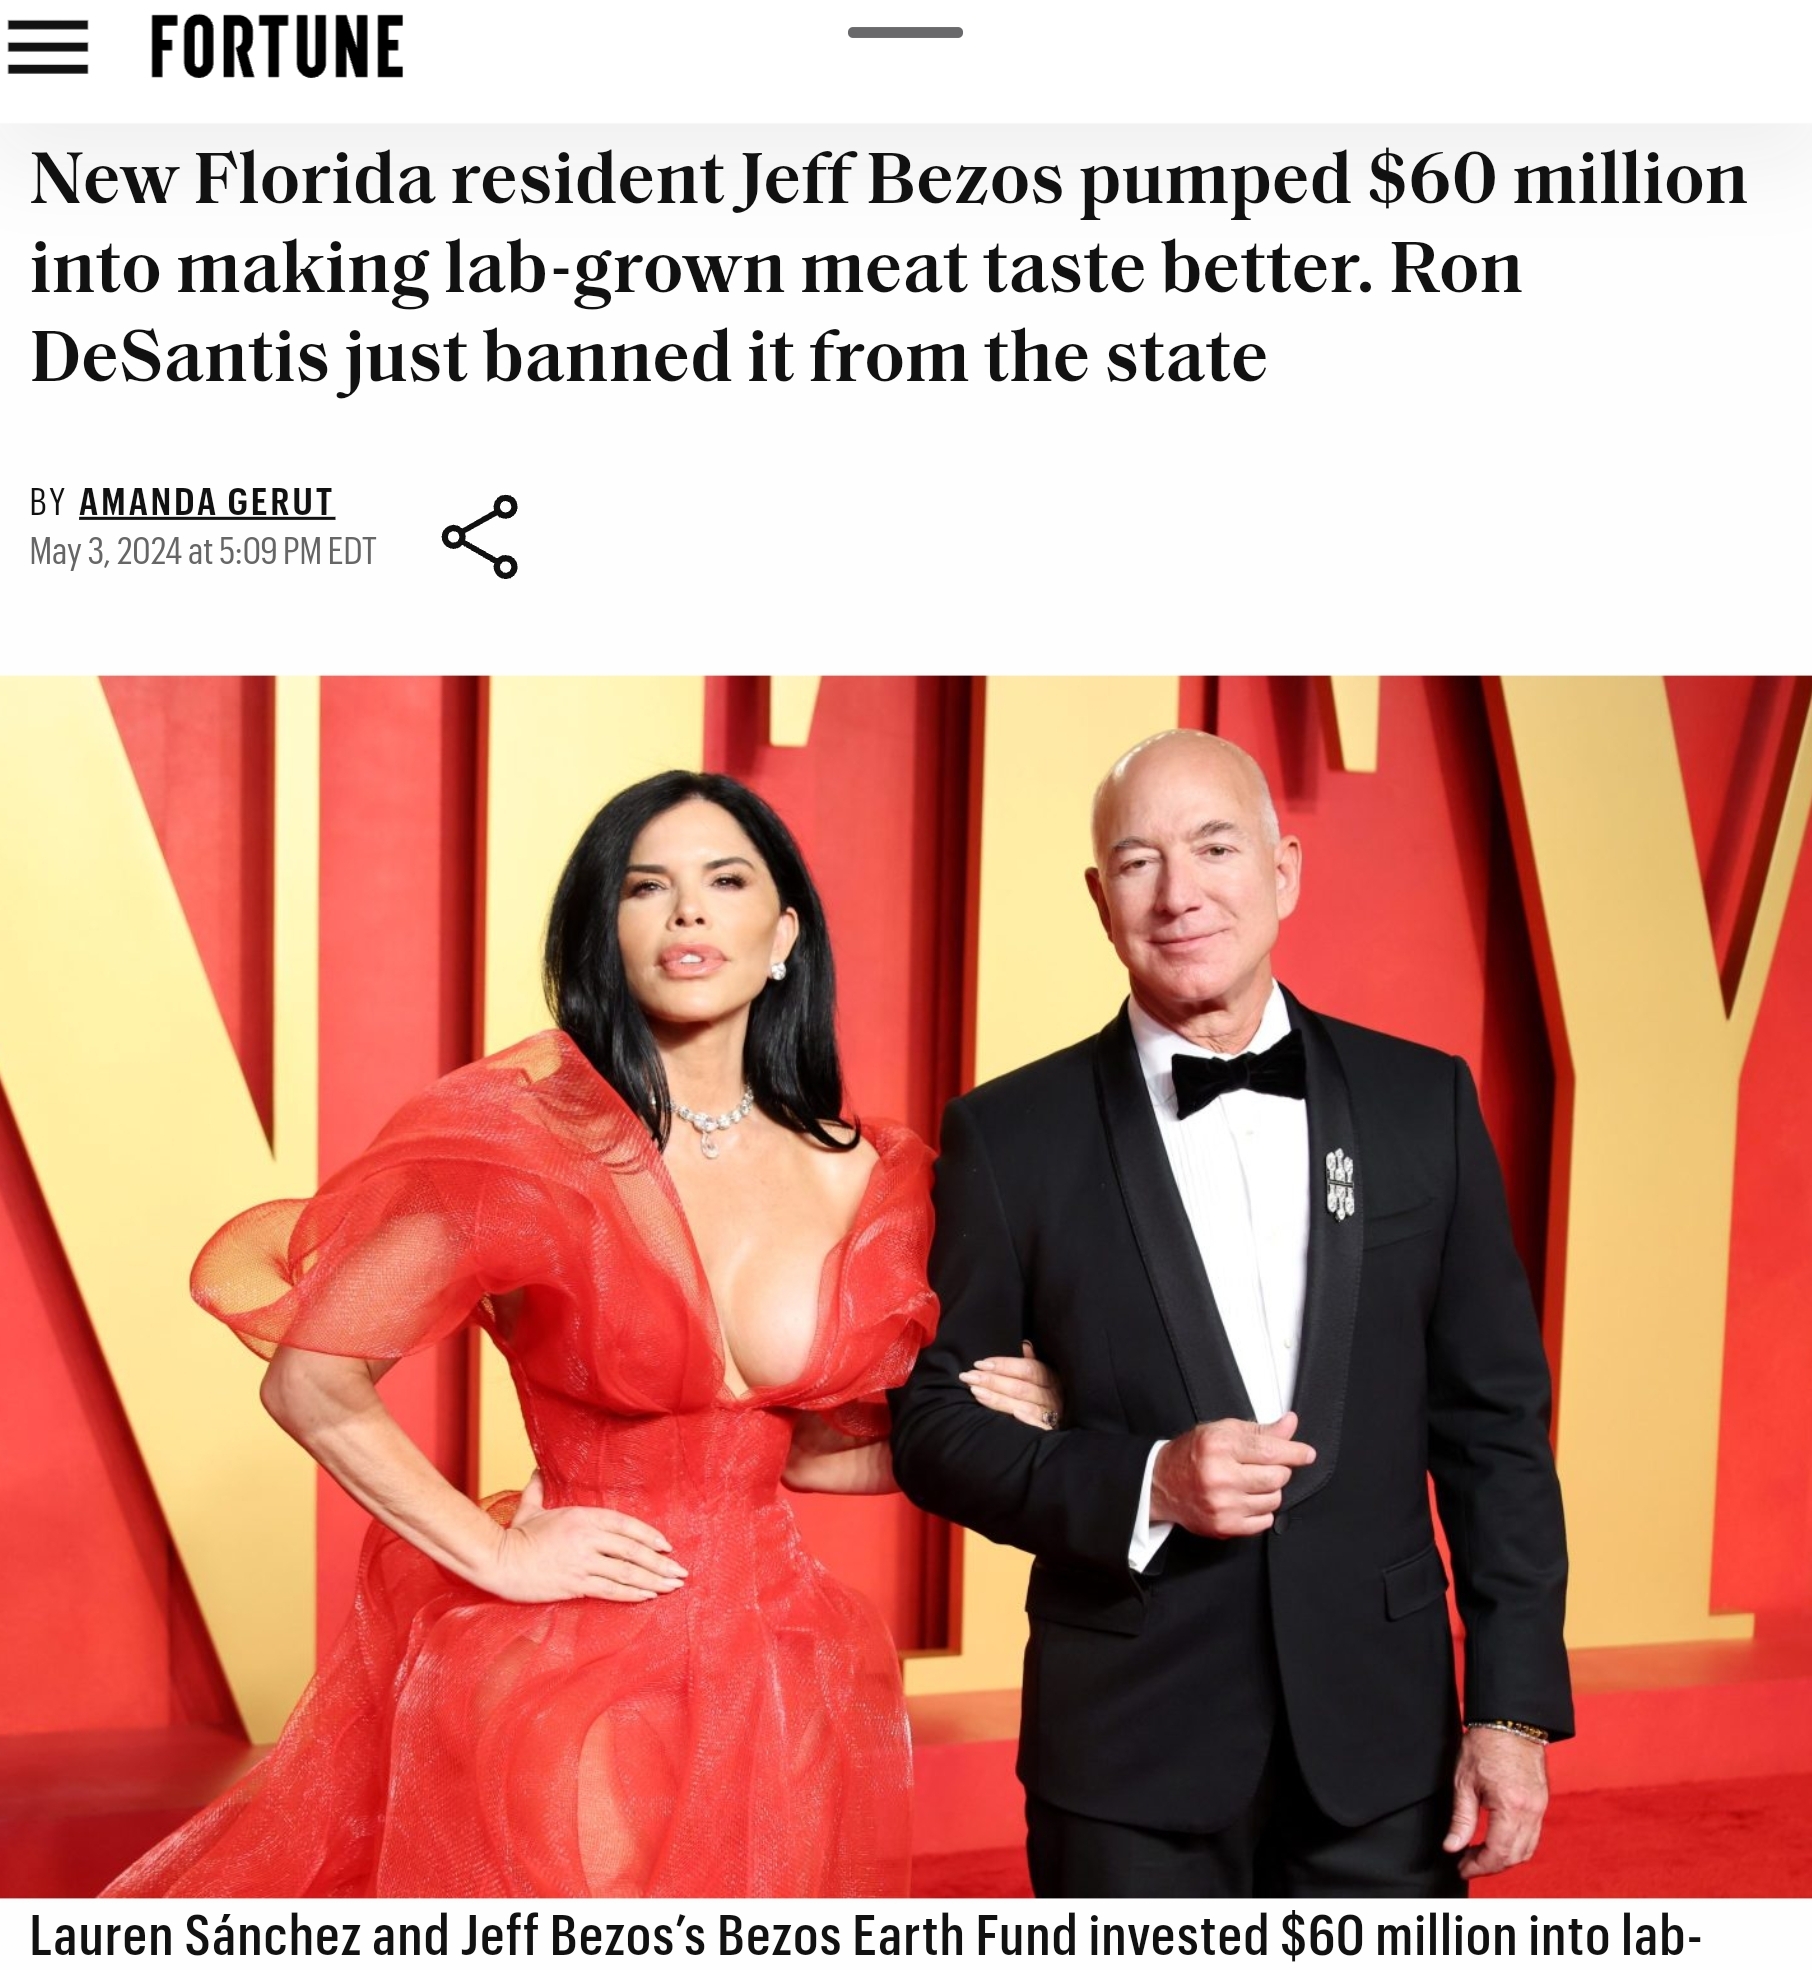
New Florida resident Jeff Bezos pumped $60 million into making lab-grown meat taste better. Ron DeSantis just banned it from the state May 4, 2024
South Carolina’s population growth creates ‘climate crisis’, says environmental scientist – ‘We face an issue of how human beings are going to live when there are 330 million of us in this country’ We can’t keep doing that. It is unsustainable. You’re robbing Peter to pay Paul.’ May 4, 2024
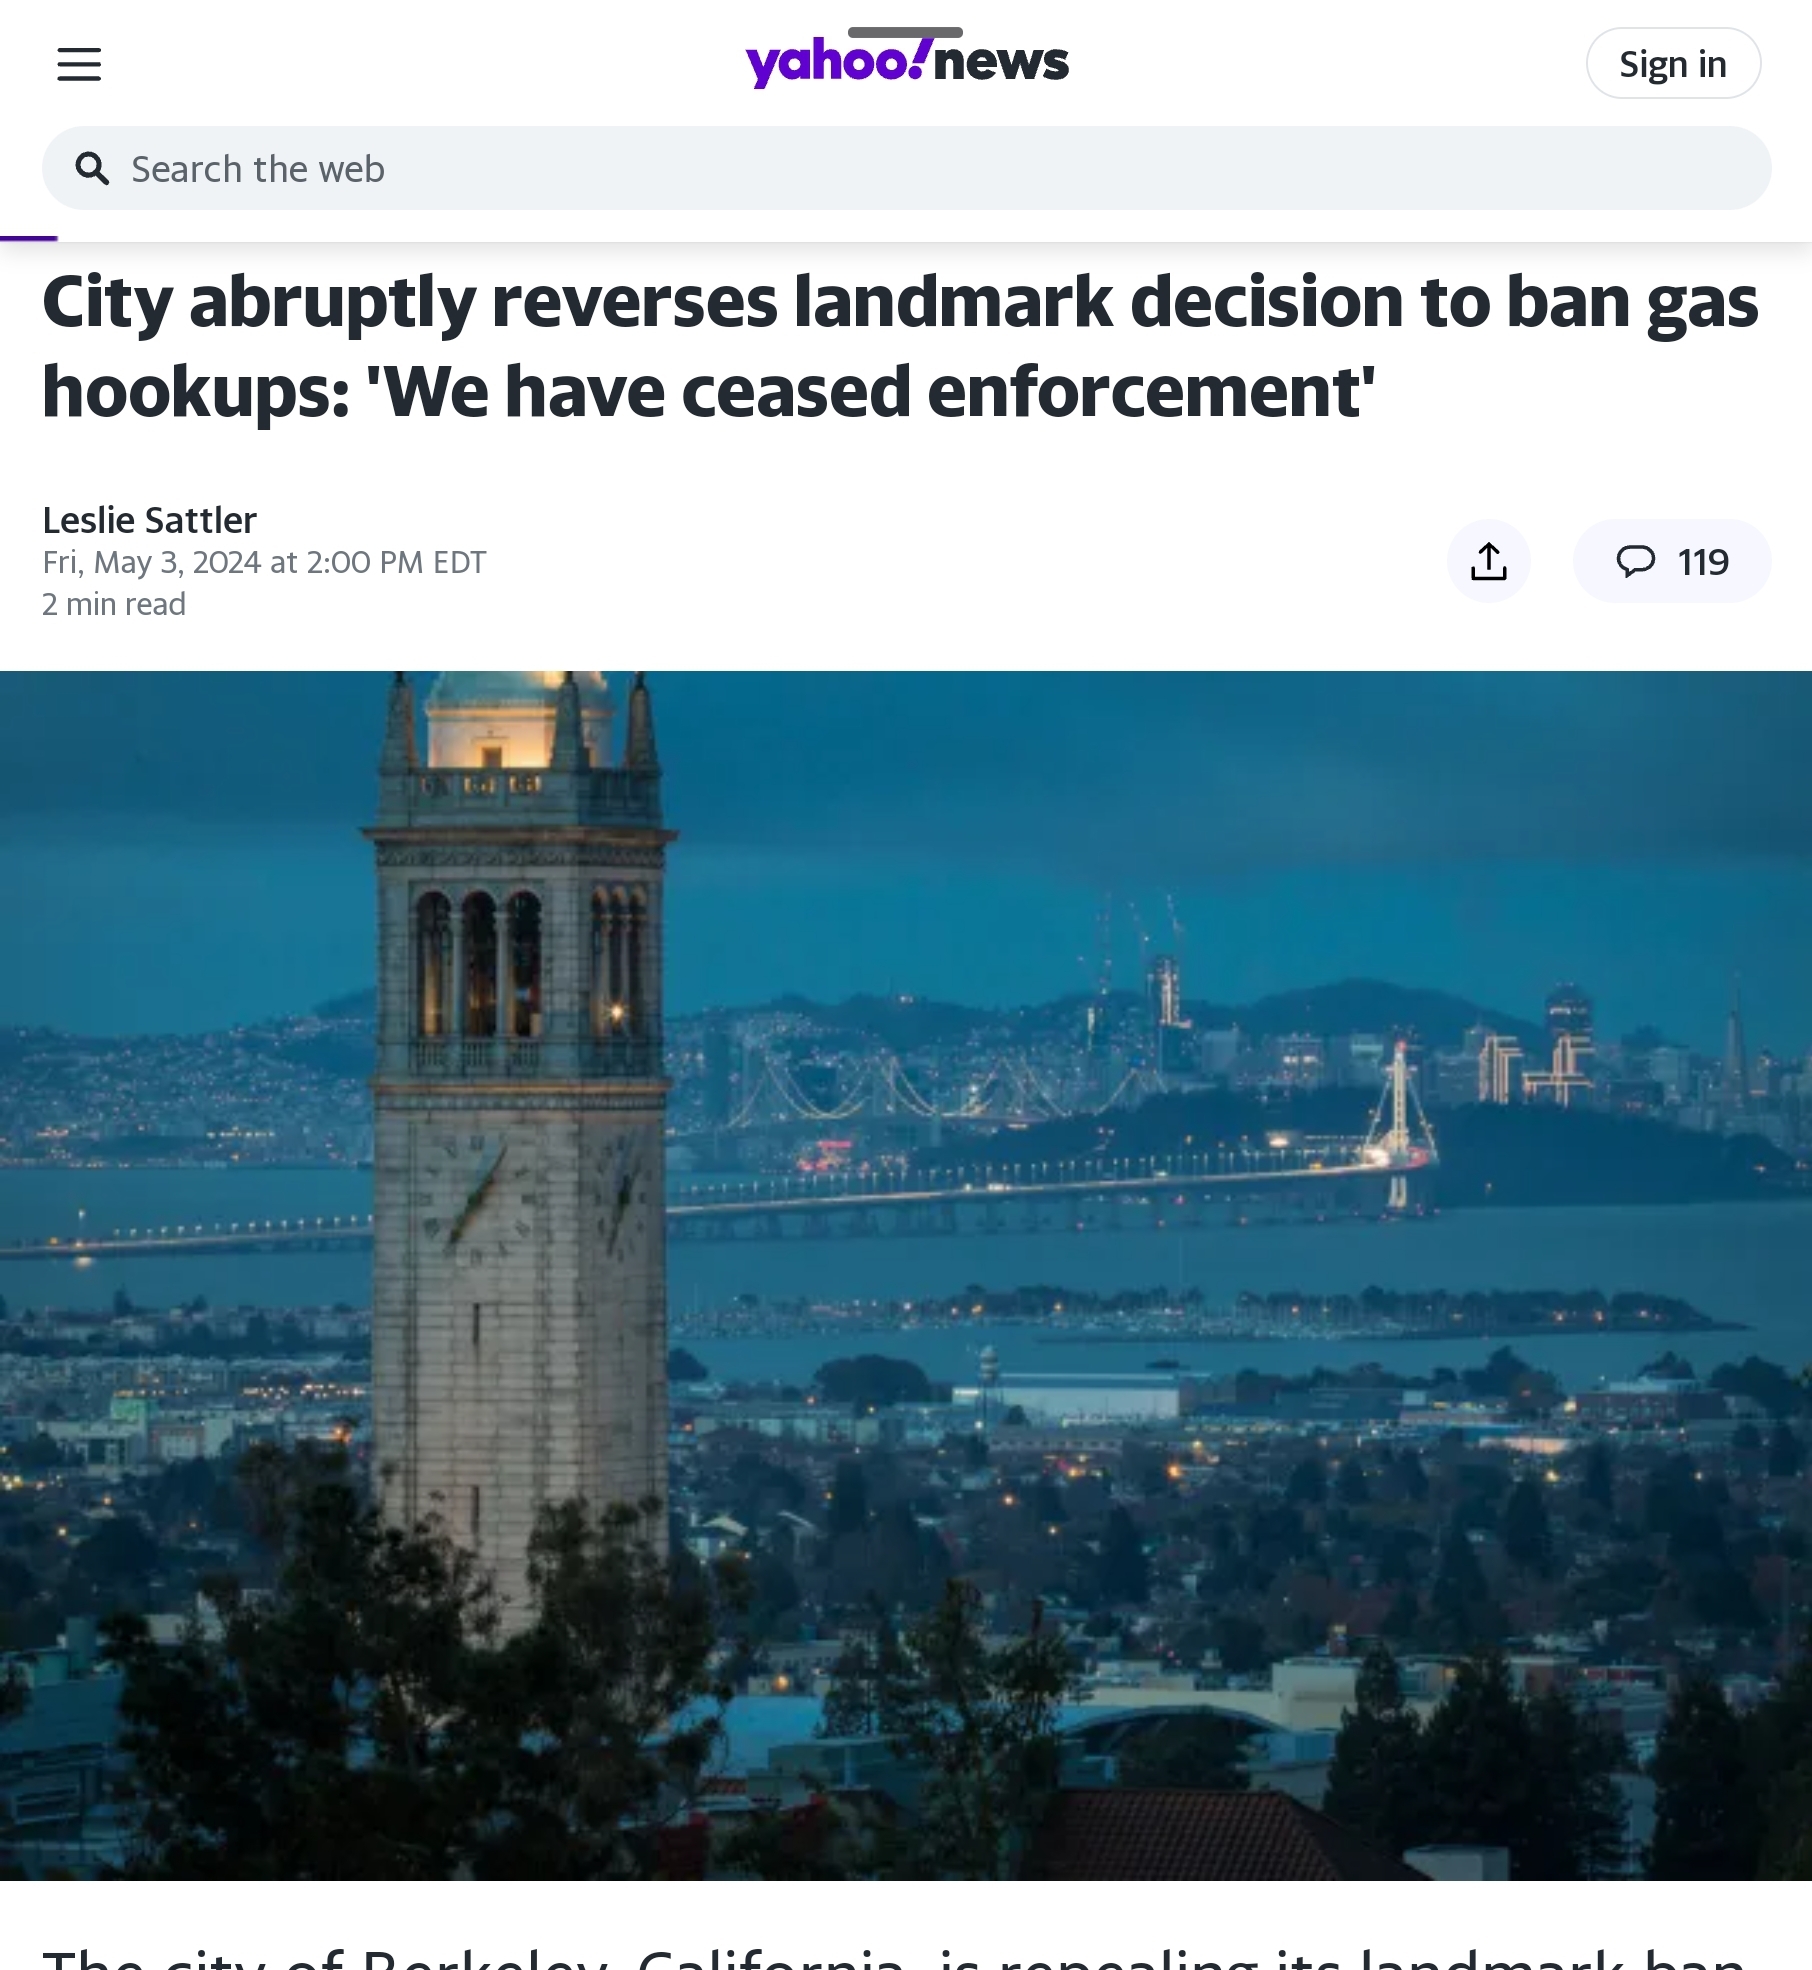
Berkeley California abruptly reverses landmark decision to ban gas hookups: ‘We have ceased enforcement’ May 4, 2024