Temperatures To Decrease 0.5°C-0.7°C
Due To Low Sunspots, Solar Minimum
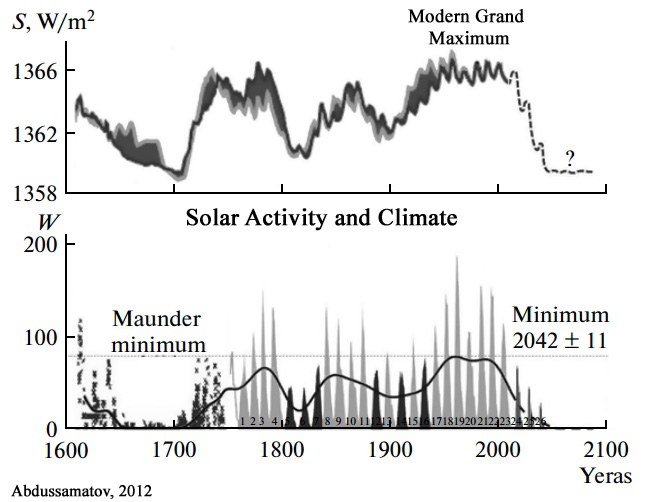
Image Source: Abdussamatov, 2012
During 2017, 120 papers linking historical and modern climate change to variations in solar activity and its modulators (clouds, cosmic rays) have been published in scientific journals.
It has been increasingly established that low solar activity (fewer sunspots) and increased cloud cover (as modulated by cosmic rays) are highly associated with a cooling climate.
In recent years, the Earth has unfortunately left a period of very high solar activity, the Modern Grand Maximum. Periods of high solar activity correspond to multi-decadal- to centennial-scale warming.
Solar scientists are now increasingly forecasting a period of very low activity that will commence in the next few years (by around 2020 to 2025). This will lead to climate cooling, even Little Ice Age conditions.
Thirteen recently-published papers forecasting global cooling are listed below.
Sun et al., 2017
The contrast analysis between the periodic movement of the planetary system and the periodicity of solar activity shows that the two phenomena exhibit a period change rule of 179.5 years. Moreover, orderly orbits correspond to high periods of solar activity and disorderly orbits correspond to low periods of solar activity. … Therefore, a certain relationship exists between the movement of the planetary system, solar activity, and global climate change.
The movement of the planetary system can thus be used to interpret the periodic trends of the movement of the Sun and global climate change. … A period change rule of a 179.5-year cycle is observed. This period change rule is consistent with the change that takes place once every 2 centuries (about 160 to 210 years) for solar activity and global climate change.
The Sun is headed into a grand minimum, that is, a period of unusually low solar activity. A relatively low number of or nonexistent sunspots are observed during the protracted solar minimum. Since 1000 AD, there have been six protracted solar minimums, namely, the Oort minimum (1040–1080 AD), Medieval Minor minimum (1150 1200 AD), Wolf minimum (1270–1350 AD), Spörer minimum (1430–1520 AD), Maunder minimum (1620–1710 AD), and Dalton minimum (1787–1843 AD). [A]ll the orbits of the planetary system are in disorder during the six protracted solar minimums.
The planet juncture index and heliocentric longitude are also in disorder during the six protracted solar minimums. The numerical simulation results show a high number of sunspots and strong solar activity [warming] during the orderly orbit and a low number of sunspots, low solar activity, and the occurrence of a protracted solar minimum or little ice age during the disorderly orbit. … [T]he results indicate that the solar minimum and little ice ages correspond to the planetary system’s disorderly orbit.
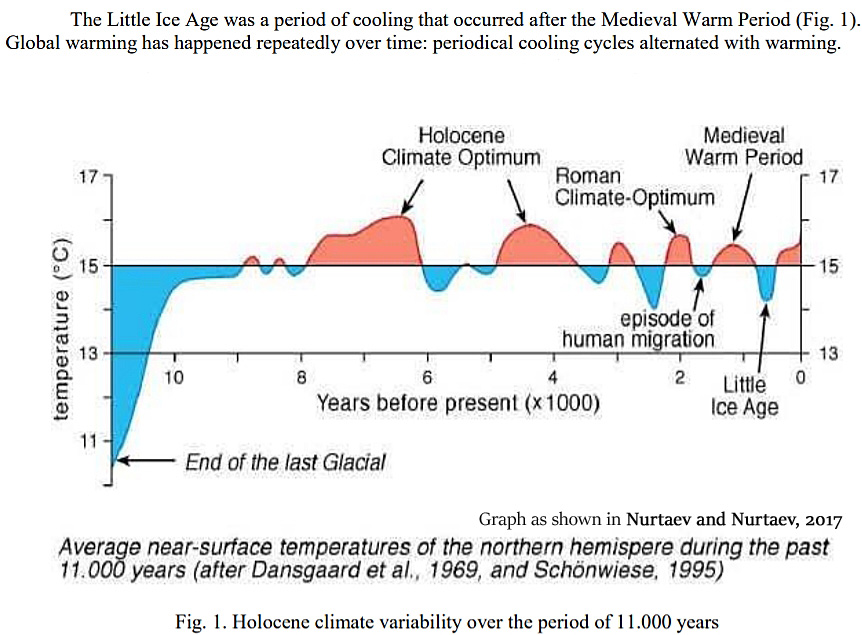
Nurtaev and Nurtaev, 2017
A reconstruction of total solar irradiance since 1610 to the present estimated by various authors an increase in the total solar irradiance since the Maunder Minimum of about 1.3 W/m² [2]. This is a huge amount of energy, taking into account the Earth’s total land mass.
More sunspots deliver more energy to the atmosphere, by way of increased brightness of the Sun and solar wind what tend to warm the Earth. Solar activity affects the Earth in many ways, some which we are still coming to understand.
In accordance with National Geophysical Data Center (NGDC) forecasting the solar cycles 24 and 25 will be very weak: averaged sunspot numbers W-35 for the solar cycle 24 and for the solar cycle 25 less than W-35 , NGDC (2009). Total Solar Irradiance will equal -1365. (23 cycle -1366). This actually will lead to a decrease of the temperature on 0.5 – 0.7°C in both averaged solar cycles, in Geneva will decrease to 1.5 °C. Temperature of air will be lower in the Northern Hemisphere. Precipitation rate in Caucasus will be more in average on 100-150 mm in dependence from location.
The World Ocean level also will be lower, due to more snow and glacier accumulation on continents.
Yndestad and Solheim, 2017
Deterministic models based on the stationary periods confirm the results through a close relation to known long solar minima since 1000 A.D. and suggest a modern maximum period from 1940 to 2015.
The model computes a new Dalton-type sunspot minimum from approximately 2025 to 2050 and a new Dalton-type period TSI minimum from approximately 2040 to 2065.
Periods with few sunspots are associated with low solar activity and cold climate periods. Periods with many sunspots are associated with high solar activity and warm climate periods. … Studies that employ cosmogenic isotope data and sunspot data indicate that we are currently leaving a grand activity maximum, which began in approximately 1940 and is now declining (Usoskin et al., 2003; Solanki et al., 2004; Abreu et al., 2008). Because grand maxima and minima occur on centennial or millennial timescales, they can only be investigated using proxy data, i.e., solar activity reconstructed from 10Be and 14C time-calibrated data. The conclusion is that the activity level of the Modern Maximum (1940–2000) is a relatively rare event, with the previous similarly high levels of solar activity observed 4 and 8 millennia ago (Usoskin et al., 2003). Nineteen grand maxima have been identified by Usoskin et al. (2007) in an 11,000-yr series.
Twenty-seven grand minima are identified with a total duration of 1900 years, or approximately 17% of the time during the past 11,500 years (Usoskin et al., 2007). An adjustment-free reconstruction of the solar activity over the last three millennia confirms four grand minima since the year 1000: Maunder (1640–1720), Spörer (1390–1550), Wolf (1270–1340) and Oort (1010–1070) (Usoskin et al., 2007). The Dalton minimum (1790–1820) does not fit the definition of a grand minimum; it is more likely a regular deep minimum that is observed once per century or an immediate state between the grand minimum and normal activity (Usoskin, 2013). Temperature reconstructions for the last millennium for the Northern Hemisphere (Ljungquist, 2010) show a medieval maximum temperature at approximately the year 1000 and a cooling period starting at approximately 1350, immediately after the Wolf minimum and lasting nearly 500 years, with the coldest period in what is referred to as the Little Ice Age (LIA) at the time of the Maunder minimum. A cold period was also observed during the time of the Dalton minimum. The Maunder and the Dalton minima are associated with less solar activity and colder climate periods. In this investigation, minimum solar activity periods may serve as a reference for the identified minimum irradiations in the TSI oscillations.
All solar indices have maxima between 1920 and 1940; the majority of the maxima occur in the 1930s. The Hoyt-Schatten irradiance model has been calibrated and extended with the newest version of ACRIM TSI observations (e.g. Scafetta and Willson, 2014, Fig. 16); it is employed in this analysis. In the following section, this reconstruction is referred to as TSI HS. A mostly rural Northern Hemisphere composite temperature series 1880–2013 shows strong correlation with the TSI-HS reconstruction, which indicates a strong solar influence on the temperature of the Northern Hemisphere (Soon et al., 2015). … A visual inspection of the TSI wavelet spectrum reveals the dominant periods in the TSI data series in the time window between 1700 and 2013. The long wavelet period has a maximum in 1760, 1840, 1930, and 2000, with a mean gap of approximately 80 years.
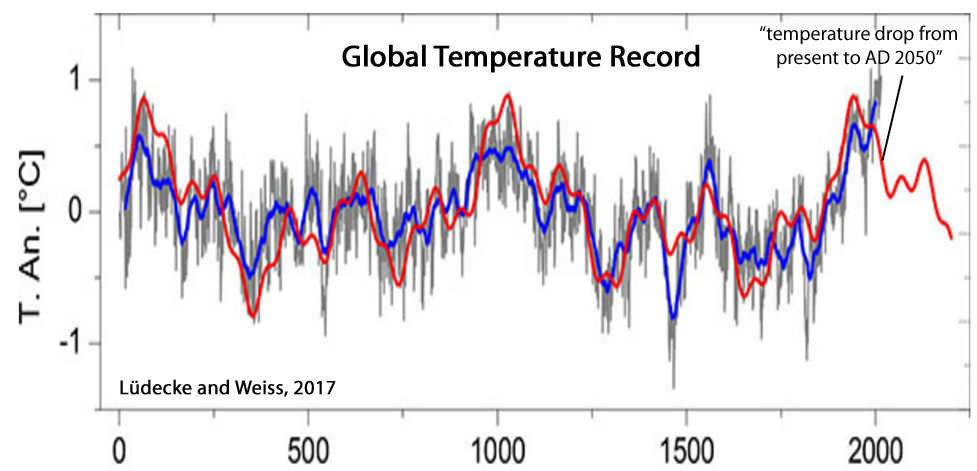
Lüdecke and Weiss, 2017
The Sun as climate driver is repeatedly discussed in the literature but proofs are often weak. In order to elucidate the solar influence, we have used a large number of temperature proxies worldwide to construct a global temperature mean G7 over the last 2000 years. The Fourier spectrum of G7 shows the strongest components as ~1000-, ~460-, and ~190 – year periods whereas other cycles of the individual proxies are considerably weaker. The G7 temperature extrema coincide with the Roman, medieval, and present optima as well as the well-known minimum of AD 1450 during the Little Ice Age. We have constructed by reverse Fourier transform a representation of G7 using only these three sine functions, which shows a remarkable Pearson correlation of 0.84 with the 31-year running average of G7 [global temperature over the last 2000 years]. The three cycles are also found dominant in the production rates of the solar-induced cosmogenic nuclides 14C and 10Be, most strongly in the ~190 – year period being known as the De Vries/Suess cycle. By wavelet analysis, a new proof has been provided that at least the ~190-year climate cycle has a solar origin.
G7 [global temperature over the last 2000 years], and likewise the sine representations have maxima of comparable size at AD 0, 1000, and 2000. We note that the temperature increase of the late 19th and 20th century is represented by the harmonic temperature representation, and thus is of pure multiperiodic nature [it is of natural solar origin].
It can be expected that the periodicity of G7, lasting 2000 years so far, will persist also for the foreseeable future. It predicts a temperature drop from present to AD 2050, a slight rise from 2050 to 2130, and a further drop from AD 2130 to 2200, upper panel, green and red curves).
Zharkova et al., 2017
Using a summary curve of two eigen vectors of solar magnetic field oscillations derived with Principal Components Analysis (PCA) from synoptic maps for solar cycles 21-24 as a proxy of solar activity, we extrapolate this curve backwards three millennia revealing 9 grand cycles lasting 350-400 years each. The summary curve shows a remarkable resemblance to the past sunspot and terrestrial activity: grandminima – Maunder Minimum (1645-1715 AD), Wolf minimum (1280-1350 AD), Oort minimum (1010-1050 AD) and Homer minimum (800 900 BC); grand maxima – modern warm period (1990-2015), medieval warm period (900-1200 AD), Roman warm period (400-10 BC) and others. We verify the extrapolated activity curve by the pre-telescope observations of large sunspots with naked eye, by comparing the observed and simulated butterfly diagrams for Maunder Minimum (MM), by a maximum of the terrestrial temperature and extremely intense terrestrial auroras seen in the past grand cycle occurred in 14-16 centuries.
We confirm the occurrence of upcoming Modern grand minimum in 2020-2053, which will have a shorter duration (3 cycles) and, thus, higher solar activity compared to MM. … One of the examples of fitting incorrectly the oscillating function with a linear regression approach is shown by Akasofu (2010) (see her Fig. 9), when explaining the modern era recovery of the Earth from the little ice period and the incorrect use of a linear part of the temperature variations for the extremely incorrect prediction of the terrestrial temperature growth in the next century.
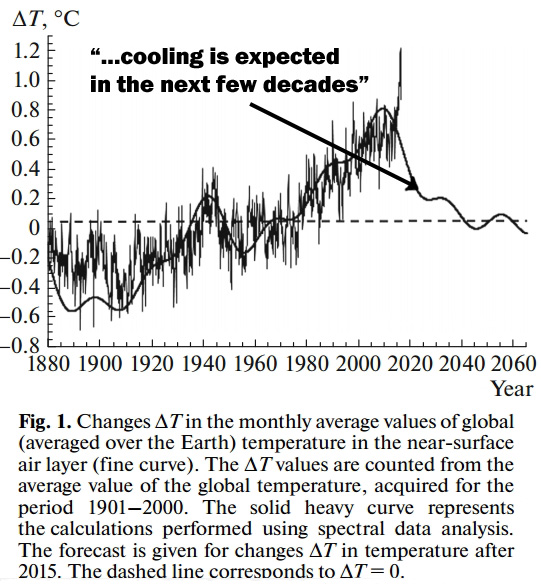
Stozhkov et al., 2017
One of the most important problems facing humanity is finding the physical mechanism responsible for global climate change, particularly global warming on the Earth. … Summation of these periodicities for the future (after 2015) allows us to forecast the next few decades. The solid heavy line in Fig. 1 shows that cooling (a drop in ΔT values) is expected in the next few decades.
Figure 2 shows the dependence between the annual average changes ΔT in the global temperature in the near-surface air layer and charged particle flux N in the interval of altitudes from 0.3 to 2.2 km. We can see there is a connection between values ΔТ [temperature] and N [charged particle flux]: with an increase in cosmic ray flux N, the values of changes of global temperature decrease. This link is expressed by the relation ΔT = –0.0838N + 4.307 (see the dashed line in Fig. 2), where the ΔT values are given in °C, and the N values (in particle/min units) are related to the charged particle flux measured at an altitude of 1.3 km. The correlation coefficient of the line with the experimental data is r = –0.62 ± 0.08. … Our results could be connected with the mechanism of charged particle fluxes influencing the Earth’s climate; it includes, first of all, the effect charged particles have on the accelerated formation of centers of water vapor condensation, and thus on the increase in global cloud cover. The total cloud cover is directly connected with the global temperature of the near surface air layer.
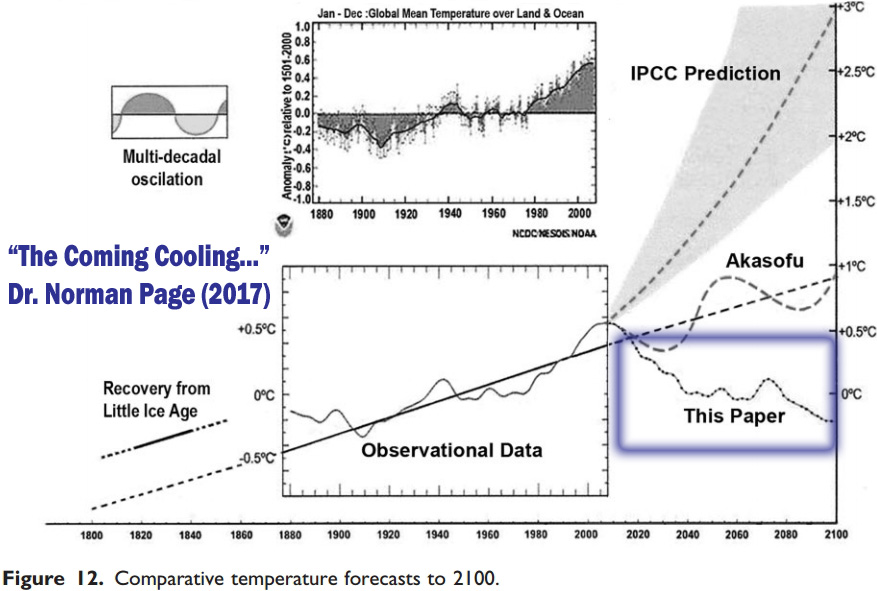
Page, 2017
The coming cooling: Usefully accurate climate forecasting for policy makers
This paper argues that the methods used by the establishment climate science community are not fit for purpose and that a new forecasting paradigm should be adopted. Earth’s climate is the result of resonances and beats between various quasi-cyclic processes of varying wavelengths. It is not possible to forecast the future, unless we have a good understanding of where the earth is in time in relation to the current phases of those different interacting natural quasi periodicities.
Evidence is presented specifying the timing and amplitude of the natural 60 ± year and, more importantly, 1000 year periodicities (observed emergent behaviors) that are so obvious in the temperature record. Data related to the solar climate driver are discussed and the solar cycle 22 low in the neutron count (high solar activity) in 1991 is identified as a solar activity millennial peak and correlated with the millennial peak – inversion point – in the RSS temperature trend in about 2004. The cyclic trends are projected forward and predict a probable general temperature decline in the coming decades and centuries. Estimates of the timing and amplitude of the coming cooling are made.
If the real climate outcomes follow a trend which approaches the near term forecasts of this working hypothesis, the divergence between the IPCC forecasts and those projected by this paper will be so large by 2021 as to make the current, supposedly actionable, level of confidence in the IPCC forecasts untenable.
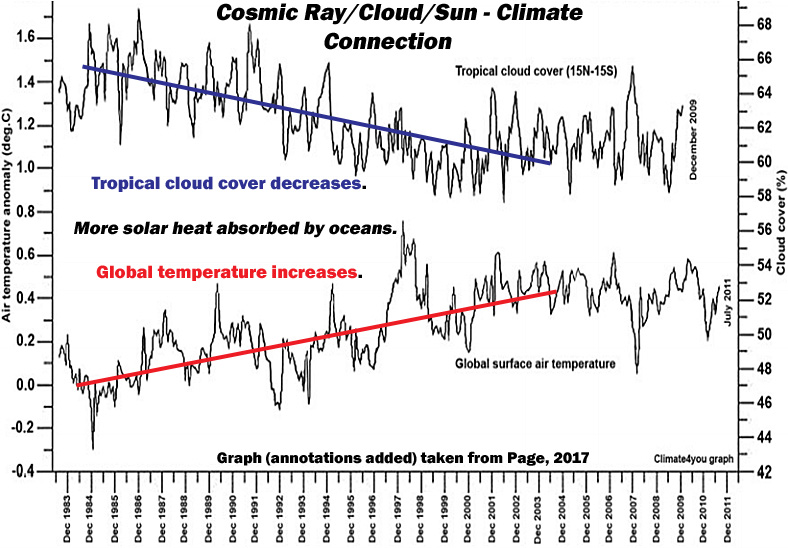
The global millennial temperature rising trend seen in Figure 11 from 1984 to the peak and trend inversion point in the Hadcrut3 data at 2003/4 is the inverse correlative of the Tropical Cloud Cover fall from 1984 to the Millennial trend change at 2002. The lags in these trends from the solar activity peak at 1991 (Figure 10) are 12 and 11 years, respectively. These correlations suggest possible teleconnections between the GCR flux, clouds, and global temperatures.
Unless the range and causes of natural variation, as seen in the natural temperature quasi-periodicities, are known within reasonably narrow limits, it is simply not possible to even begin to estimate the effect of anthropogenic CO2 on climate. Given the lack of any empirical CO2-climate connection reviewed earlier and the inverse relationship between CO2 and temperature [during the Holocene, when CO2 rose as temperatures declined] seen in Figure 2, and for the years 2003.6–2015.2 in Figure 4, during which CO2 rose 20 ppm, the simplest and most rational working hypothesis is that the solar ‘activity’ increase is the chief driver of the global temperature increase since the LIA.
Torres and Guzmán, 2016
Conclusions Based on our results, we propose the use of the Wolf’s Number Oscillation Index (WNOI) – as a more uniform alternative to the ONI – in the range over 30 and below -30. The analysis of the material presented and the arguments discussed allows us to define a possible relationship between phenomena related to Solar Cycle, the ENSO, climatic conditions, as well as some criteria for the establishment of public policies for preservation and remediation of the environment in the long run. We can conclude that solar activity oscillations impact the earth climatic conditions to such a extent that they become measurable only in the long run. The magnitude of the Solar Cycle – from 7 to 17 and a mean of 11.2 years – seems to support this statement. Based on the similarities of the Solar Cycles 5 and 24 we can expect a longer period of cold weather for the years 2022 y/o 2034, corresponding to the Solar Cycles 24 and 25.
Sanchez-Sesma, 2016
This empirical modeling of solar recurrent patterns has also provided a consequent multi-millennial-scale experimental forecast, suggesting a solar decreasing trend toward grand (super) minimum conditions for the upcoming period, AD 2050–2250 (AD 3750–4450).
Solar activity (SA) has non-linear characteristics that influence multiple scales in solar processes (Vlahos and Georgoulis, 2004). For instance, millennia-scale solar oscillations have been recently detected, like those of about 6000 and 2400 years, by Xapsos and Burke (2009) and Charvátová (2000), respectively, with important and interesting influences in the near, past and future climate. These millennialscale patterns of reconstructed SA variability could justify epochs of low activity, such as the Maunder minimum, as well as epochs of enhanced activity, such as the current Modern Maximum, and the Medieval maximum in the 12th century.
We can conclude that the evidence provided is sufficient to justify a complete updating and reviewing of present climate models to better consider these detected natural recurrences and lags in solar processes.
Evans, 2016
Four manifestations of unconventional climate influences are identified, each with at least as much effect on surface temperature as the direct heating effect of changes in total solar irradiance (TSI): external-driven albedo; countervailing cooling during TSI peaks, implied by the absence of corresponding peaks in the surface temperature record (the “notch”); the long-term sensitivity of surface warming to TSI increases; and the delay of ∼11 years between changes in underlying or smoothed TSI and the corresponding changes in surface temperature.
We hypothesize these are all manifestations of a single force whose exact mechanism is unknown but whose crucial properties can be deduced: “Force X” modulates the Earth’s albedo, and lags TSI by one sunspot cycle or half the ∼22-year cycle of the Sun’s hydromagnetic dynamo. A second, alternative hypothesis is of “force N” for the notch and “force D” for the delayed force causing the other three manifestations. The notch-delay solar model can explain the global warming of the last few decades and centuries in terms of force X/D. Several solar indicators including TSI peaked ∼1986, but surface warming continued until ∼1998, which is explained by the delay.
The notch-delay hypothesis predicts sustained and significant global cooling starting sometime in the period 2017 to 2022, of ∼0.3°C but perhaps milder (TSI estimates vary), as force X/D falls off in response to the marked decline in underlying TSI from around 2004—one of the three biggest and fastest falls in TSI since sunspot records began in 1610.
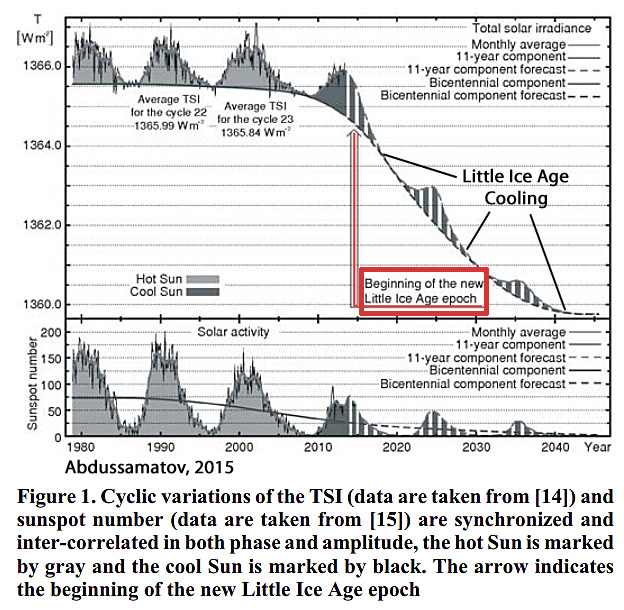
Abdussamatov, 2015
A long-term negative deviation of the Earth’s average annual energy balance from the equilibrium state is dictating corresponding variations in it’s the energy state. As a result, the Earth will have a negative average annual energy balance also in the future. This will lead to the beginning of the decreasing in the Earth’s temperature and of the epoch of the Little Ice Age after the maximum phase of the 24-th solar cycle approximately since the end of 2014.
The influence of the consecutive chain of the secondary feedback effects (the increase in the Bond albedo and the decrease in the concentration of greenhouse gases in the atmosphere due to cooling) will lead to an additional reduction of the absorbed solar energy and reduce the greenhouse effect. The start of the TSI’s Grand Minimum is anticipated in the solar cycle 27±1 in 2043±11 and the beginning of the phase of deep cooling of the 19th Little Ice Age for the past 7,500 years around 2060±11.
Thus, the long term variations of the solar constant (allowing for their direct and secondary impacts, with the latter being due to feedback effects) are the major and essential cause of climate changes because the Earth’s climate variation is a function of longterm imbalance between the solar radiation energy incoming into the upper layers of the Earth’s atmosphere and Earth’s total energy outgoing back to space.