
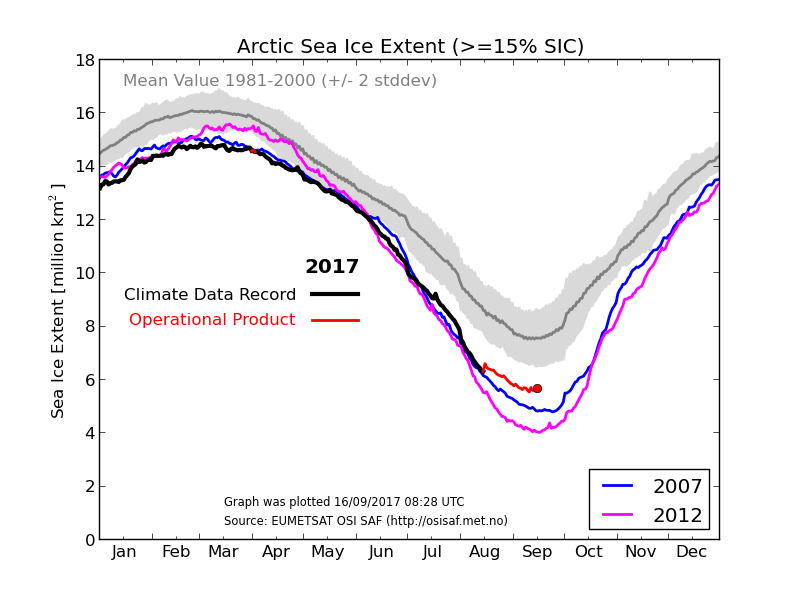
Using EUMETSAT satellite data to determine Arctic sea ice extent where sea ice concentration is greater than or equal to 15%. Source: http://osisaf.met.no/p/new_ice_extent_graphs.php
Overview
Arctic sea ice extent has likely just reached its low point of the melting season and is above levels from 2012 and 2007 at this same time of year. Arctic sea ice generally shrinks every year during the spring and summer seasons until it reaches its minimum yearly extent around this time of year. Sea ice then typically regrows during the frigid fall and winter seasons when the sun is below the horizon in the Arctic. The apparent end to this year’s melting season in the Arctic is right around the mid-point of September.

Observed AMO index, defined as detrended 10-year low-pass filtered annual mean area-averaged SST anomalies over the North Atlantic basin (0N-65N, 80W-0E), using HadISST dataset (Rayner, et al., 2003) for the period 1870-2015.; courtesy NCAR: https://climatedataguide.ucar.edu/climate-data/atlantic-multi-decadal-oscillation-amo
While Arctic sea ice extent appeared to be headed for record lows earlier this year, the melting rate changed pace and actually slowed down in the summer months. The low point just reached is clearly still below the normal value for the 1981-2000 time period, but it is actually a tad higher than the last couple of years (not shown) and safely above the record low seen during 2012 and also above levels seen ten years ago.
The Arctic sea ice extent has been generally below-normal since the middle 1990’s at which time the northern Atlantic Ocean switched sea surface temperature phases from cold-to-warm and it is likely to return to pre-mid 1990’s levels when the ocean cycle flips back to cold in coming years. Meteorologists track oceanic temperature cycles in the northern Atlantic Ocean with an index value known as the Atlantic Multidecadal Oscillation (AMO). The AMO flipped from negative-to-positive in the mid 1990’s signaling an important long-term sea surface temperature phase shift from cold-to-warm and it has stayed generally positive ever since. Typically, oceanic temperature cycles in the Atlantic Ocean have lasted for about 20 to 30 years.

Daily mean temperatures in the Arctic region for 2017. Data source is Danish Meteorological Institute and can be found at http://ocean.dmi.dk/arctic/meant80n.uk.php
2017 mean temperatures in the Arctic
While actual temperatures (red line) in the Arctic were generally running at well above-normal levels during the first few months of the year, they were close-to-normal during the summer season which is when the sun shines nearly 24 hours a day and the vast majority of the melting normally takes place. Above-normal temperatures during the winter and early spring season do little to impact overall Arctic sea ice melting as temperatures are generally still well below the freezing point (273.15 Kelvin which is represented on the plot by the horizontal blue line, i.e., the freezing point of water).

Arctic sea ice volume showing some resiliency since low point of 2012
In addition to sea ice extent, an important climate indicator to monitor is sea ice volume as it depends on both ice thickness and extent. Arctic sea ice volume cannot currently be observed on a continuous basis as observations from satellites, submarines and field measurements are all limited in space and time. As a result, one of the best ways to estimate sea ice volume is through the usage of numerical models which utilize all available observations. One such computer model from the University of Washington is called the Pan-Arctic Ice Ocean Modeling and Assimilation System (PIOMAS, Zhang and Rothrock, 2003) and it is showing some resiliency in Arctic sea ice volume since the low point was reached in 2012 (indicated by arrow) following a long and sustained sharp downtrend. (Note – the PIOMAS model output data is updated on a monthly basis, details on the PIOMAS model are available at http://psc.apl.washington.edu/research/projects/arctic-sea-ice-volume-anomaly).

Source: http://www.natice.noaa.gov/ims/
Northern Hemisphere sea ice near ten-year average
In the Northern Hemisphere (NH), sea ice extent has been quite close to the 10-year average since the spring season of this year despite starting off the year at levels much closer to the 10-year minimum. (Note: there has been a little spike in NH sea ice during the past few days).
Meteorologist Paul Dorian
Vencore, Inc.
vencoreweather.com


