
Climate Depot Note: Despite NOAA Tornado data revealing 2016 as ‘one of the quietest years since records began in 1954’ and below average for 5th year in a row, the federal agency is now hyping statistics which allegedly show an increasing number of tornadoes.
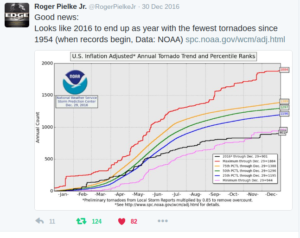
Extreme weather expert Dr. Roger Pielke Jr. had noted that 2016 NOAA data revealed “good news” for tornadoes. “Looks like 2016 to end up as year with the fewest tornadoes since 1954,” Pielke wrote on December 30, 2016. (NOAA’s tornado records records begin in 1954)
Data: NOAA) http://www.spc.noaa.gov/wcm/adj.html
But now, NOAA appears to be spinning the numbers.
#
Via: https://notalotofpeopleknowthat.wordpress.com/2017/01/15/noaas-tornado-fraud/
NOAA’s Tornado Fraud
By Paul Homewood
https://www.ncdc.noaa.gov/sotc/tornadoes/201613
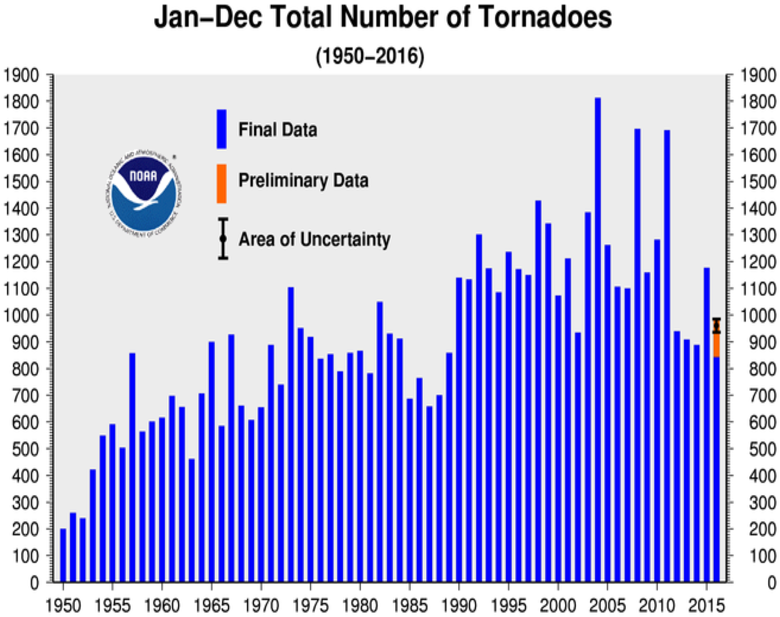
According to NOAA, the number of tornadoes has been steadily growing since the 1950s, despite a drop in numbers in the last five years.
They show the above chart prominently in their Tornadoes – Annual 2016 Report.
However, they know full well that it is meaningless to compare current data with the past, as they explain themselves in the section Historical Records and Trends, which is hidden away on their own website:
One of the main difficulties with tornado records is that a tornado, or evidence of a tornado must have been observed. Unlike rainfall or temperature, which may be measured by a fixed instrument, tornadoes are short-lived and very unpredictable. If a tornado occurs in a place with few or no people, it is not likely to be documented. Many significant tornadoes may not make it into the historical record since Tornado Alley was very sparsely populated during the 20th century.
Much early work on tornado climatology in the United States was done by John Park Finley in his book Tornadoes, published in 1887. While some of Finley’s safety guidelines have since been refuted as dangerous practices, the book remains a seminal work in tornado research. The University of Oklahoma created a PDF copy of the book and made it accessible at John Finley’s Tornadoes (link is external).
Today, nearly all of the United States is reasonably well populated, or at least covered by NOAA’s Doppler weather radars. Even if a tornado is not actually observed, modern damage assessments by National Weather Service personnel can discern if a tornado caused the damage, and if so, how strong the tornado may have been. This disparity between tornado records of the past and current records contributes a great deal of uncertainty regarding questions about the long-term behavior or patterns of tornado occurrence. Improved tornado observation practices have led to an increase in the number of reported weaker tornadoes, and in recent years EF-0 tornadoes have become more prevelant in the total number of reported tornadoes. In addition, even today many smaller tornadoes still may go undocumented in places with low populations or inconsistent communication facilities.
With increased National Doppler radar coverage, increasing population, and greater attention to tornado reporting, there has been an increase in the number of tornado reports over the past several decades. This can create a misleading appearance of an increasing trend in tornado frequency. To better understand the variability and trend in tornado frequency in the United States, the total number of EF-1 and stronger, as well as strong to violent tornadoes (EF-3 to EF-5 category on the Enhanced Fujita scale) can be analyzed. These tornadoes would have likely been reported even during the decades before Doppler radar use became widespread and practices resulted in increasing tornado reports. The bar charts below indicate there has been little trend in the frequency of the stronger tornadoes over the past 55 years.


https://www.ncdc.noaa.gov/climate-information/extreme-events/us-tornado-climatology/trends
Of course it is nonsensical to claim that the bar charts below indicate there has been little trend in the frequency of the stronger tornadoes over the past 55 years – there has clearly been a large reduction.
Note as well that they have not even bothered to update the graph for 2015. Could it be they would rather the public did not find out the truth?
Meanwhile, over at the Storm Prediction Center (SPC) you can see that, when allowance is made for changing reporting procedures, last year may well have had the lowest number of tornadoes on record.

http://www.spc.noaa.gov/wcm/#data
The SPC is also part of NOAA, but is the department that actually deals with tornado events and data on a day to day basis. As such, they tend to be more interested in the facts, rather than a political agenda.
While we still await the final numbers and classification for last year, but what we do know is that there was no EF-5. Indeed the last occurrence was the Moore, OK tornado in May 2013.
It is unusual to go nearly four years without one, as there have been 59 since 1953, effectively one a year on average.
The bottom line is that the NOAA headline graph is grossly dishonest. Indeed, if a company published something like that in their Annual Accounts, they would probably end up in jail!
NOAA themselves know all of this full well.
Which raises the question – why are they perpetuating this fraud?
#
Related Links:
‘2016 also looks like being one of the quietest years for Tornadoes since records began in 1954’
‘Only 2013 has had less tornadoes since 2005’
Extreme weather failing to follow ‘global warming’ predictions.
- The U.S. has had no Category 3 or larger hurricane make landfall since 2005 – the longest spell since the Civil War.
- Strong F3 or larger tornadoes have been in decline since the 1970s.
- Droughts and floods are neither historically unusual nor caused by mankind, and there is no evidence we are currently having any unusual weather.

