The Hockey Stick Collapses: 50 New (2016) Scientific Papers Affirm Today’s Warming Isn’t Global, Unprecedented, Or Remarkable
Two fundamental tenets of the anthropogenic global warming narrative are (1) the globe is warming (i.e., it’s not just regional warming), and (2) the warming that has occurred since 1950 can be characterized as remarkable, unnatural, and largely unprecedented. In other words, today’s climate is substantially and alarmingly different than what has occurred in the past….because the human impact has been profound.
Well, maybe. Scientists are increasingly finding that the two fundamental points cited above may not be supported by the evidence.
In 2016, an examination of the peer-reviewed scientific literature has uncovered dozens of paleoclimate reconstructions that reveal modern “global” warming has not actually been global in scale after all, as there are a large number of regions on the globe where it has been cooling for decades. Even if it was warming on a global scale, the paleoclimate evidence strongly suggests that the modern warm climate is neither unusual or profoundly different than it has been in the past. In fact, today’s regional warmth isn’t even close to approaching the Earth’s maximum temperatures achieved earlier in the Holocene, or as recently as 1,000 years ago (the Medieval Warm Period), when anthropogenic CO2 emissions could not have exerted a climate impact.
In fact, there is a growing body of evidence that the warming in recent decades is not even unprecedented within the context of the last 80 years. That’s because the amplitude of the 1930s and 1940s warm period matched or exceeded that of the warmth in the late 20th and early 21st centuries in many regions of the world. Furthermore, between the warmth of the 1930s and ’40s and the warmth of the 1990s to present, there was a very widely publicized cooling period (late 1950s to early 1970s) that was heavily discussed in the peer-reviewed scientific literature.
Today’s instrumental datasets curiously do not reflect this 20th century warming-cooling-warming oscillatory shape, however, as doing so would not lend support to the modeled understanding that climate is shaped by anthropogenic CO2 emissions, which have increased linearly, not cyclically. In fact, not only has the high amplitude of the 1930s and 1940s warmth been “adjusted” down or depressed in global-scale representations of instrumental temperatures by NASA or the MetOffice, the substantial cooling (-0.5°C in the Northern Hemisphere, including -1.5°C cooling in the Arctic region) that occurred in the 1960s and 1970s has all but disappeared from today’s temperature graphs.
Scientists, meanwhile, keep on publishing their results. And their results don’t lend support to the narrative that the globe has been synchronously warming, or warming in linear fashion and in concert with the rise in anthropogenic CO2 emissions. Indeed, in many regions of the world, decadal-scale cooling has occurred since the mid-20th century.
Listed below are a collection of 50 peer-reviewed scientific papers published within the last year (2016) undermining the “consensus” position that modern warming patterns are global in extent and synchronization, and that today’s warmth is both unusual and unprecedented. The first section (1) identifies the regions of the world where there has been no net warming in recent decades. The second section (2) puts modern climate into its much larger Holocene context, revealing just how insignificant and unremarkable this current (regional) warming trend has been relative to history.
(1) ‘Global’ Warming? No Net Warming In These Regions Since Mid Or Late 20th Century
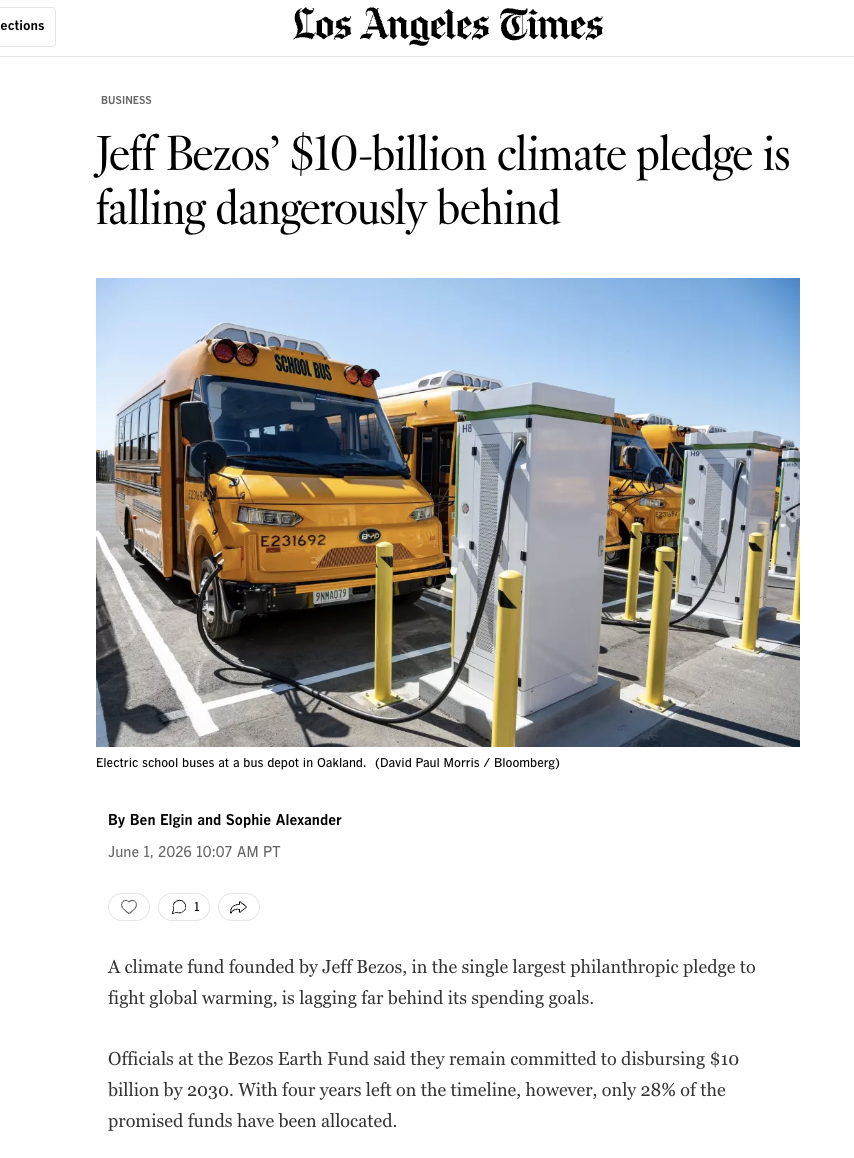
De Jong et al., 2016 (Andes, South America)
[T]he reconstruction…shows that recent warming (until AD 2009) is not exceptional in the context of the past century. For example, the periods around AD 1940 and from AD 1950–1955 were warmer. This is also shown in the reanalysis data for this region and was also observed by Neukom et al. (2010b) and Neukom and Gergis (2011) for Patagonia and central Chile. Similarly, based on tree ring analyses from the upper tree limit in northern Patagonia, Villalba et al. (2003) found that the period just before AD 1950 was substantially warmer than more recent decades.
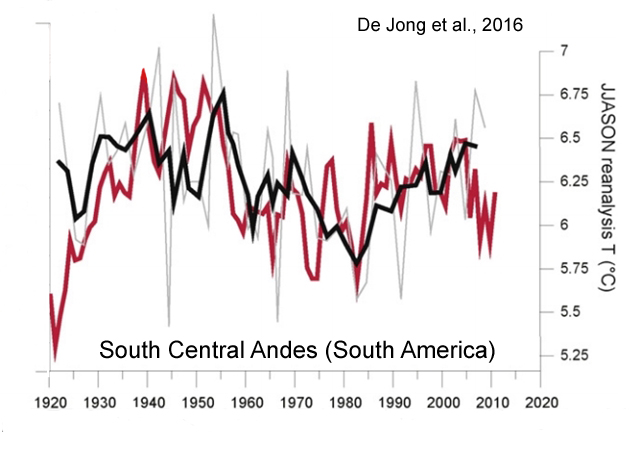
Zhu et al., 2016 (China)
[W]e should point out that the rapid warming during the 20th century was not especially obvious in our reconstructed RLST.
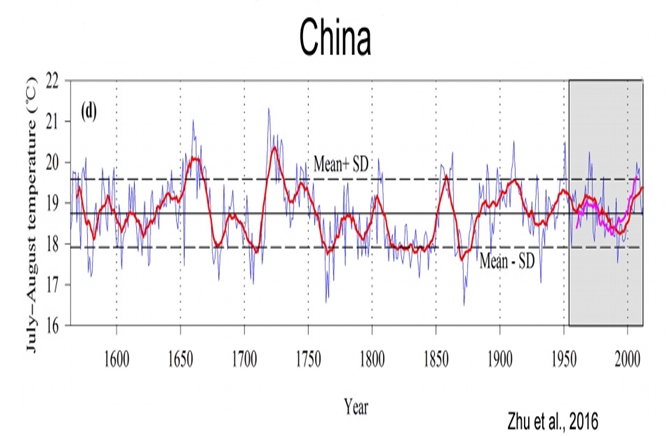
Zhang et al., 2016 (Scandinavia)
[P]resent-day global mean air temperatures may have been equally high around 1000 years ago during the so-called Medieval Climate Anomaly (MCA; Lamb, 1969; Grove and Switsur, 1994). However, since regional temperature reconstructions display large variability in the timing and magnitude of the MCA (PAGES 2k Consortium, 2013), this issue has not yet been adequately settled. Hence, there is still a great need to produce and improve empirical proxy data to further our understanding of near and distant climate changes.
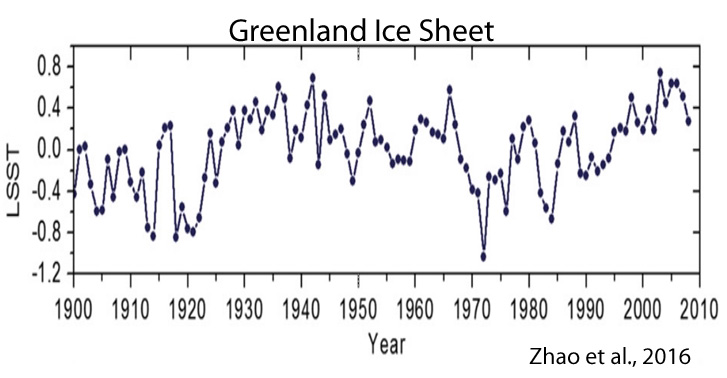
Zhao et al., 2016 (Greenland Ice Sheet)
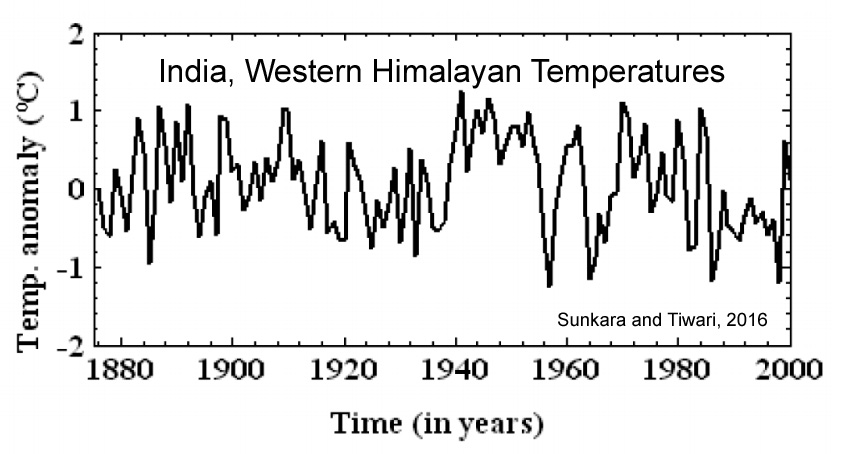
Sunkara and Tiwari, 2016 (India, Western Himalayas)
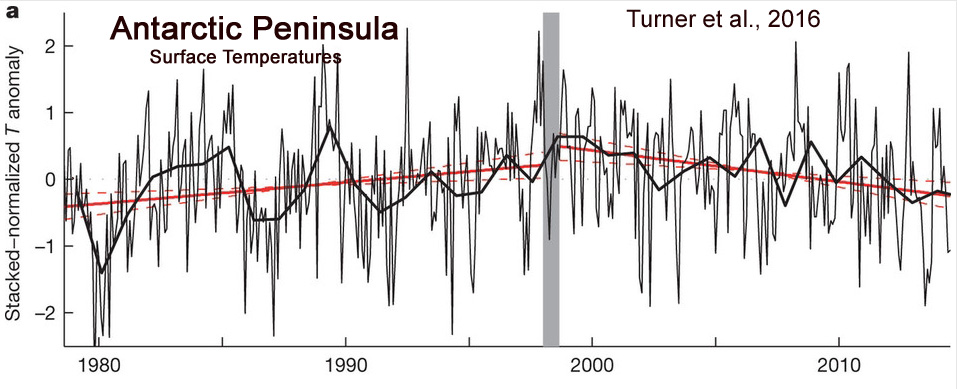
Turner et al., 2016 (Antarctic Peninsula)
Absence of 21st century warming on Antarctic Peninsula consistent with natural variability
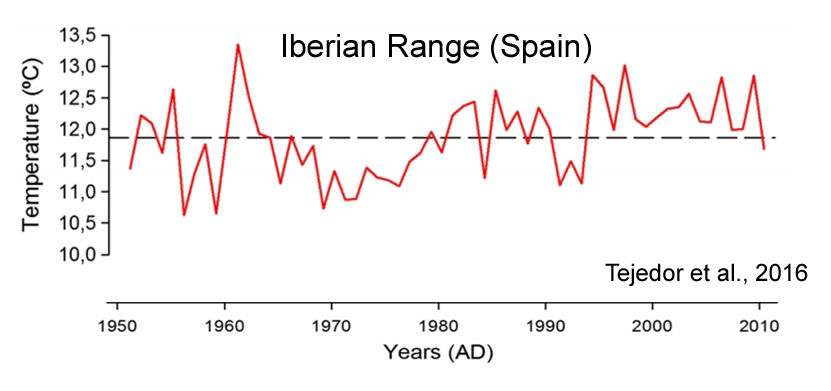
Tejedor et al., 2016 (Iberian Range, Spain)
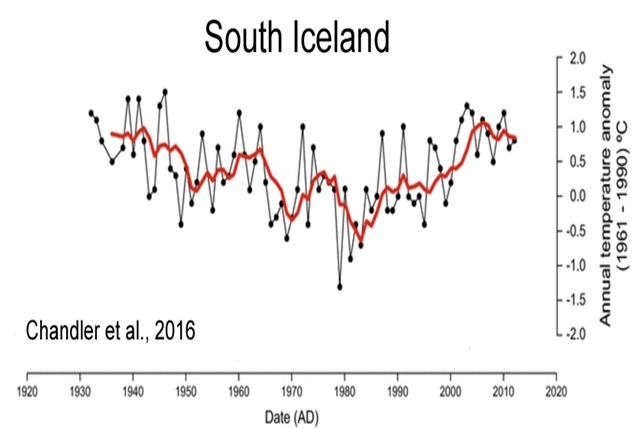
Chandler et al., 2016 (South Iceland)
Analysis of climate data for SE Iceland also indicates that the three periods of ice-frontal retreat [1936-’41, 1951-’56, and 2006-’11] identified are associated with similar summer air temperature values, which has previously been shown to be a key control in terminus variations in Iceland. We, therefore, demonstrated that the coincidence of the most recent phase of ice-frontal retreat at Skálafellsjökull (2006–2011) and warming summer temperatures is not unusual in the context of the last ~80 years. This highlights the need to place observations of contemporary glacier change in a broader, longer-term (centennial) context.
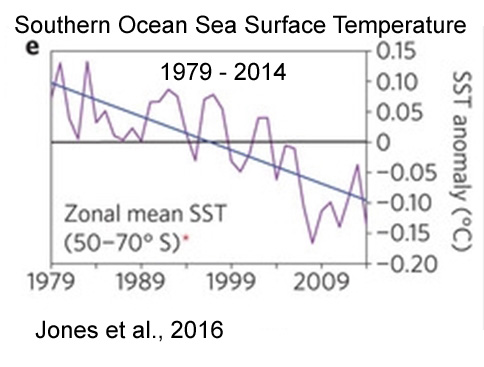
Jones et al., 2016 (Southern Ocean)
[C]limate model simulations that include anthropogenic forcing are not compatible with the observed trends.
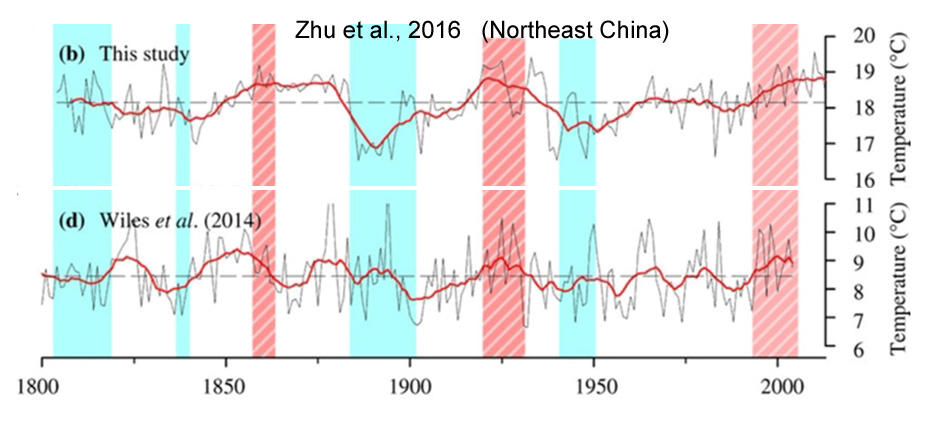
Zhu et al., 2016 (Northeast China)
We identified four major cold periods (1839–1846, 1884–1901, 1906–1908 and 1941–1958) and three major warm periods (1855–1880, 1918–1932 and 1998–2013) in the past 211 years. The multi-taper method spectral analysis revealed significant cycles at 48.8, 11.5, 8.9, 3.9, 3.5 and 2–3 years, which might be associated with global climate oscillations and land-sea thermal contrasts, such as the sea surface temperatures, El Niño-Southern Oscillation, Atlantic Multidecadal Oscillation and solar activity.
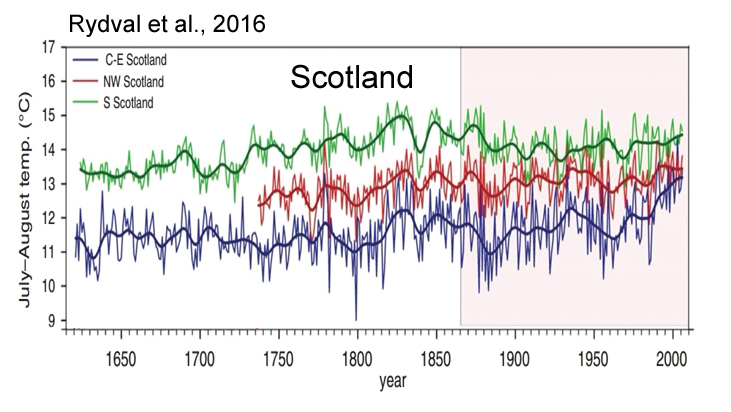
Rydval et al., 2016 (Scotland)
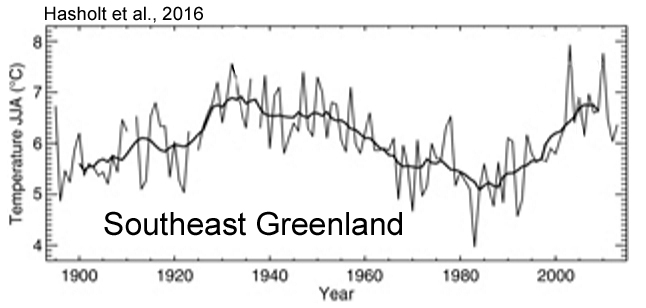
Hasholt et al., 2016 (Southeast Greenland)
We determined that temperatures for the ablation measurement periods in late July to early September were similar in both 1933 and the recent period [1990s – present], indicating that the temperature forcing of ablation within the early warm period and the present are similar.
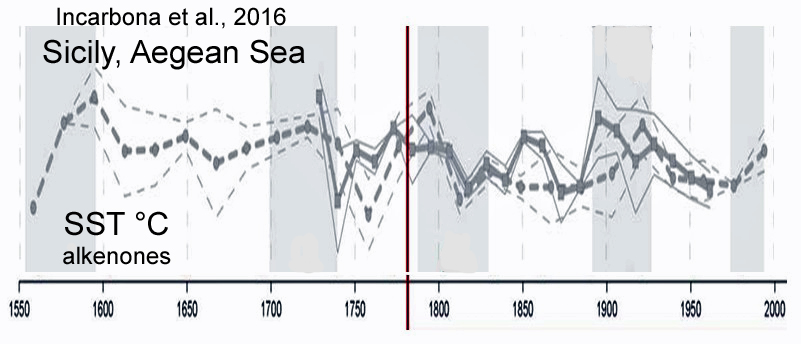
Incarbona et al., 2016 (Sicily, Aegean Sea)
Solar activity modulates patterns in surface temperature and pressure that resemble NAO phases, through dynamical coupling processes between the stratosphere and the troposphere that transmit the solar signal to the Earth’s surface.
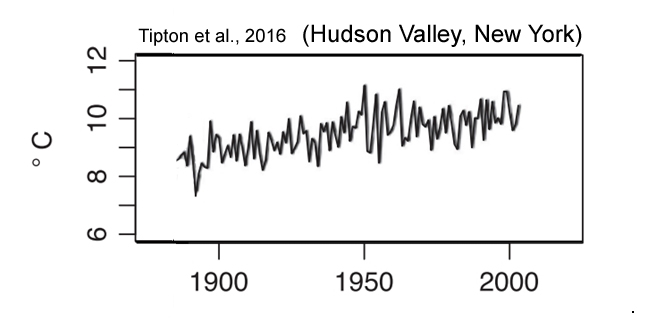
Tipton et al., 2016 (Hudson Valley, New York)
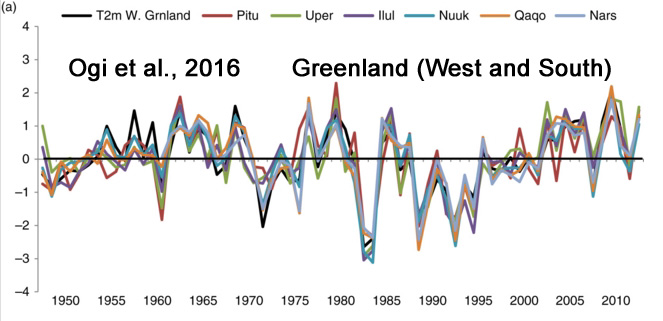
Ogi et al, 2016 (Greenland, West and South)
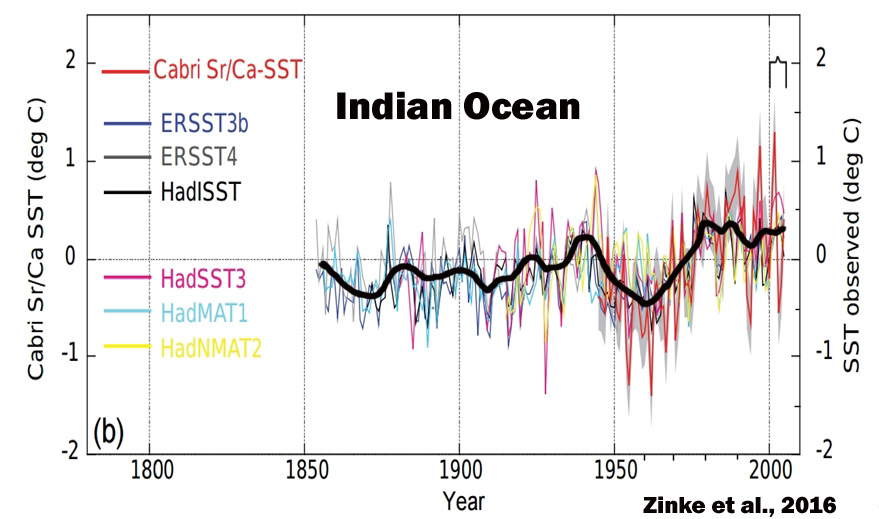
Zinke et al., 2016 (Indian Ocean)
We calibrate individual robust Sr / Ca records with in situ SST and various gridded SST products. The results show that the SST record from Cabri provides the first Indian Ocean coral proxy time series that records the SST signature of the PDO in the south-central Indian Ocean since 1945. … Marked negative Sr /Ca anomalies (warmer) are observed during the first half of the 20th century centred at 1918/19, 1936–1941 and in the period 1948–1951 that exceed anomalies in the 1961 to 1990 reference period.
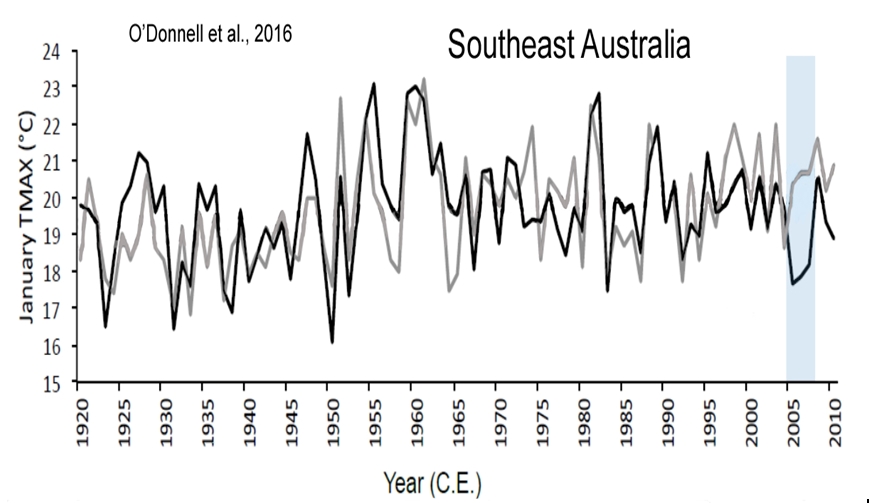
O’Donnell et al., 2016 (Australia SE)
Christy and McNider, 2016 (Alabama, U.S.)
The time frame is 1883-2014. … Varying the parameters of the construction methodology creates 333 time series with a central trend-value based on the largest group of stations of -0.07 °C decade-1 with a best-guess estimate of measurement uncertainty being -0.12 to -0.02 °C decade-1. This best-guess result is insignificantly different (0.01 C decade-1) from a similar regional calculation using NOAA nClimDiv data beginning in 1895. … Finally, 77 CMIP-5 climate model runs are examined for Alabama and indicate no skill at replicating long-term temperature and precipitation changes since 1895.

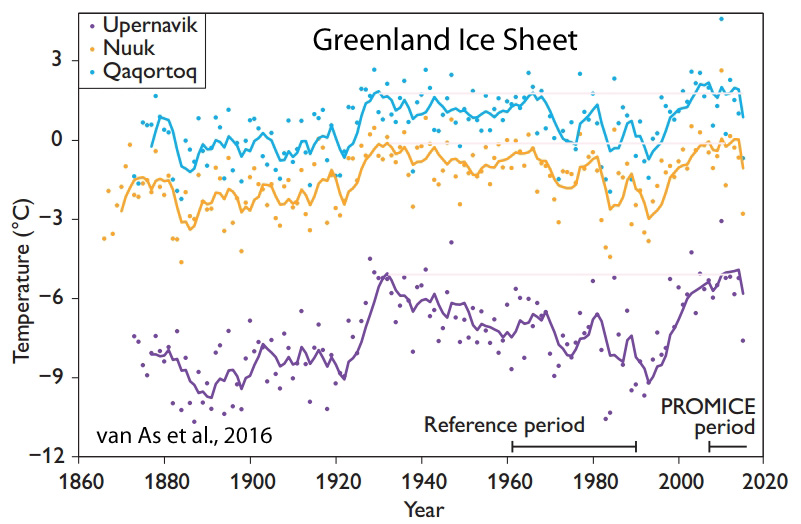
van As et al., 2016 (Greenland Ice Sheet)
We conclude that at our study sites annual net ablation is likely to be larger in recent years than during any previous period in the instrumental era, covering up to 150 years. … [I]n southern Greenland ablation peaked significantly around 1930. While most of Greenland underwent relatively warm (summer) conditions in the 1930s (Cappelen 2015), this was most notable at the more southern locations, resulting in amplified ablation values according to our estimates. JJA [summer] temperatures were higher in 1928 and 1929 than in any other year of the Qaqortoq record, both attaining values of 9.2°C. This suggests that ablation in those years may have exceeded the largest net ablation measured on the Greenland ice sheet ( 2010).
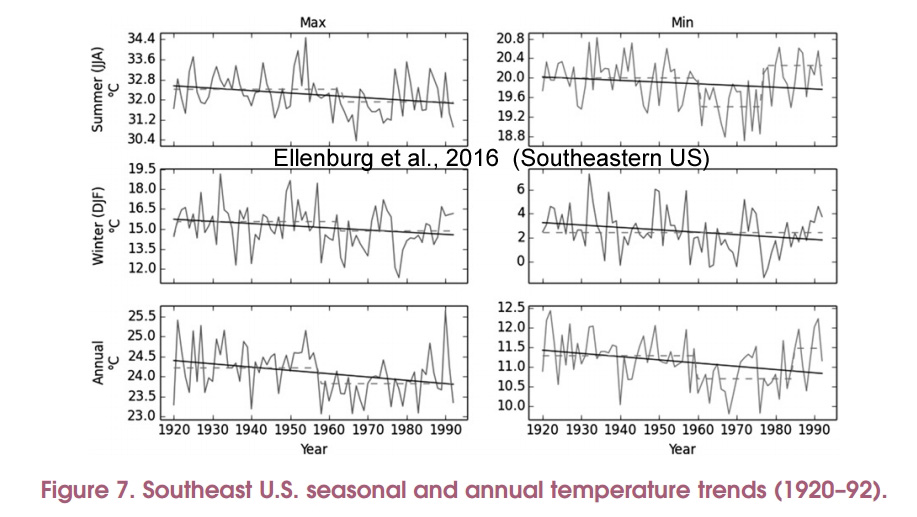
Ellenburg et al., 2016 (Southeastern U.S.)
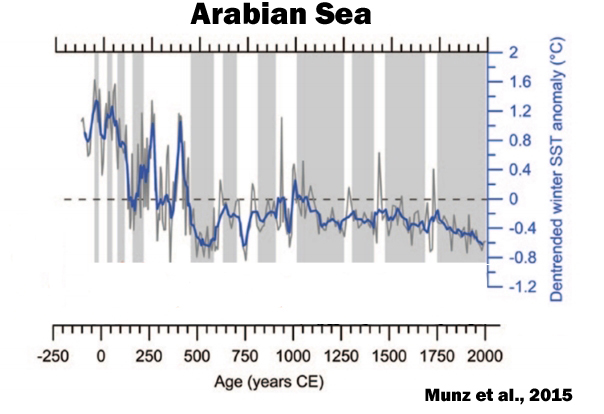
Munz et al., 2015 (Arabian Sea)
(2) Today’s Climate Still Colder Than Most Of The Last 10,000 Years
Present >
Fudge et al., 2016 (West Antarctica) 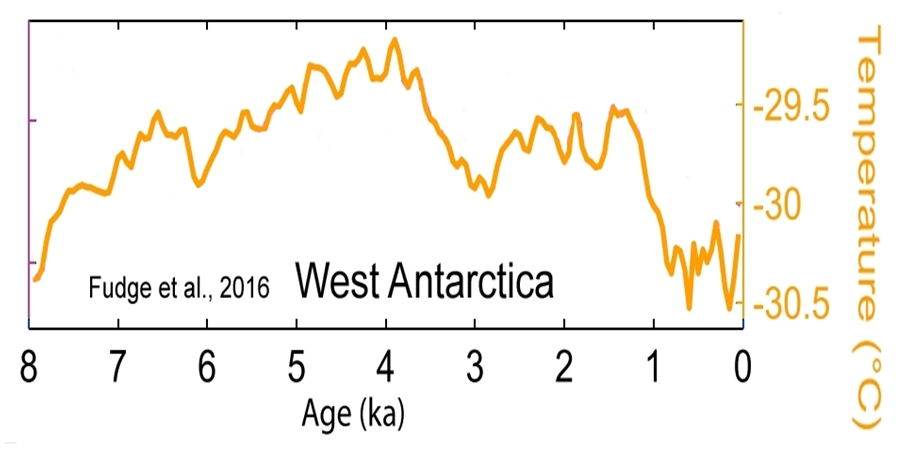
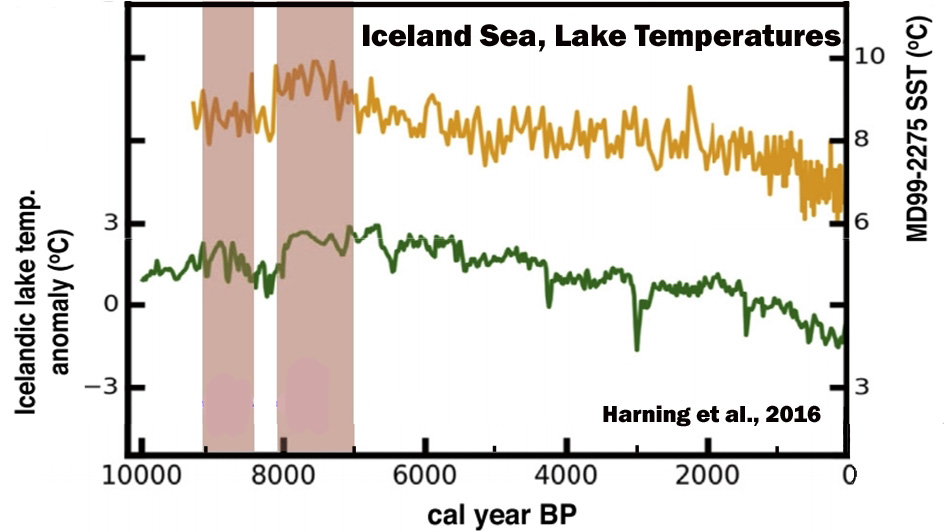
Harning et al., 2016 (Iceland)
Distal lakes document rapid early Holocene deglaciation from the coast and across the highlands south of the glacier. Sediment from Skorarvatn, a lake to the north of Drangajokull, shows that the northern margin of the ice cap reached a size comparable to its contemporary limit by ~10.3 ka. Two southeastern lakes with catchments extending well beneath modern Drangajokull confirm that by ~9.2 ka, the ice cap was reduced to ~20% of its current area.
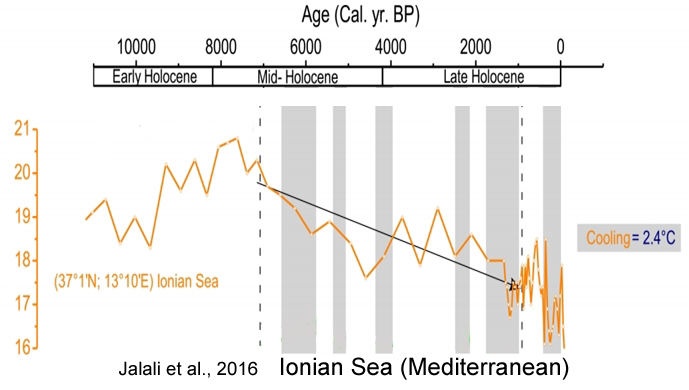
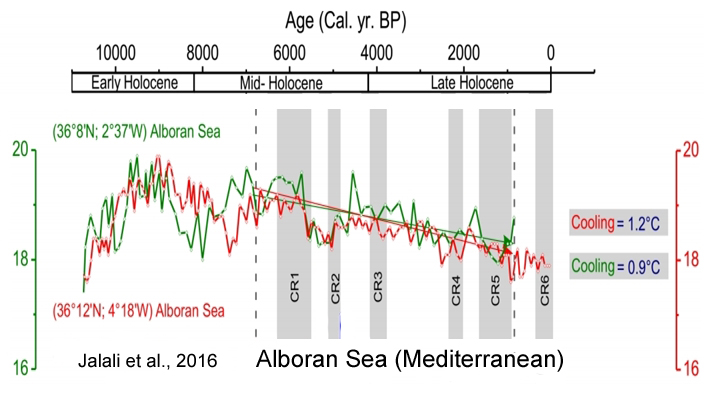
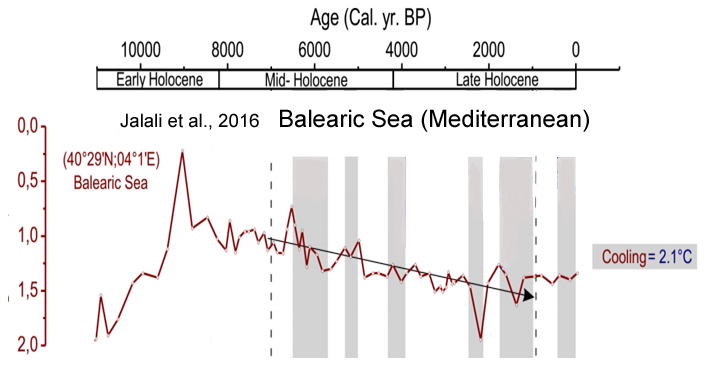
Jalali et al., 2016 (Mediterranean Sea)
Several proxy records have documented surface water variability of the Mediterranean Sea during the Holocene (Kallel et al., 1997a, b, 2004; Cacho et al., 2001; Guinta et al., 2001; Rohling et al., 2002; Emeis et al., 2003; Essalami et al., 2007; Frigola et al., 2007; Castañeda et al., 2010; Boussetta et al., 2012; Martrat et al., 2014). Most of them reveal that Mediterranean Sea surface temperatures (SSTs) have undergone a long-term cooling punctuated by several cold relapses (CRs; Cacho et al., 2001; Frigola et al., 2007). While orbital forcing likely explains this long-term tendency, solar activity and volcanism contribute to forced variability (Mayewski et al., 2004; Wanner et al., 2011) together with internal variability (i.e. Atlantic multi-decadal variability (AMV), North Atlantic Oscillation; NAO) all together embedded in the multi-decadal scale variability seen in paleorecords.
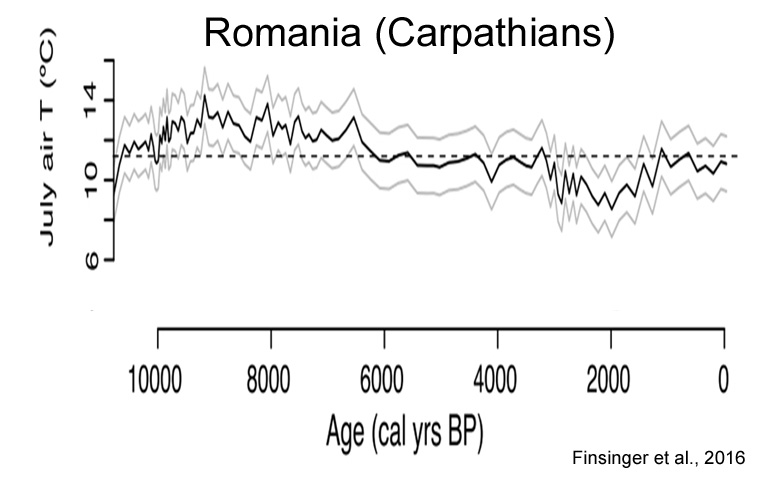
Finsinger et al., 2016 (Romania, Carpathians)
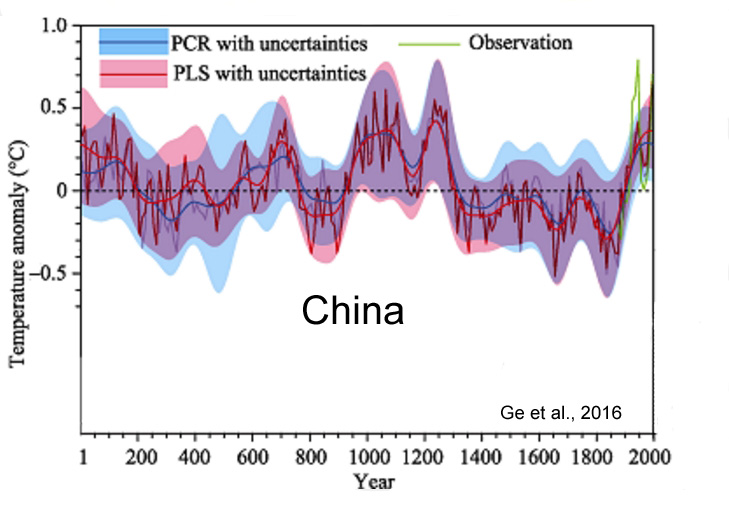
Ge et al., 2016 (China)
Results of this study show that warm intervals over the last 2000 years were in AD 1-200, AD 551-760, AD 951-1320, and after AD 1921, while cold intervals were in AD 201-350, AD 441-530, AD 781-950, and AD 1321-1920. Interestingly, temperatures during AD 981-1100 and AD 1201-1270 were comparable to those of our Present Warm Period, but have an uncertainty of 0.28°-0.42°C at 95% confidence level. Temperature variations over the whole of China are typically in phase with those of the Northern Hemisphere (NH) after AD 1000, the period which covers the Medieval Climate Anomaly, the Little Ice Age (LIA), and the Present Warm Period.
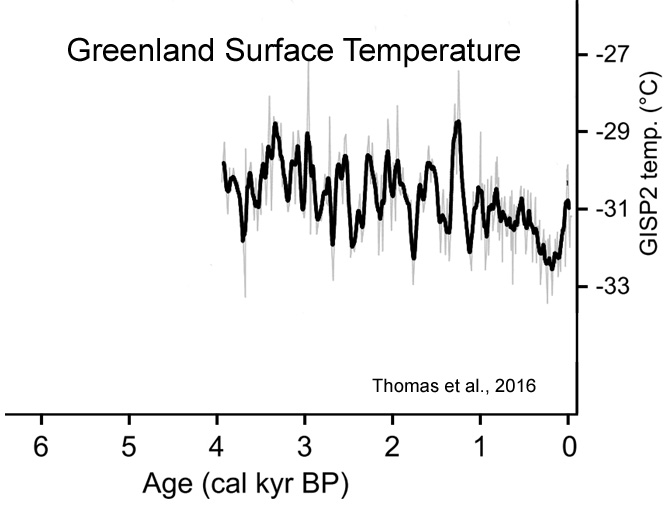
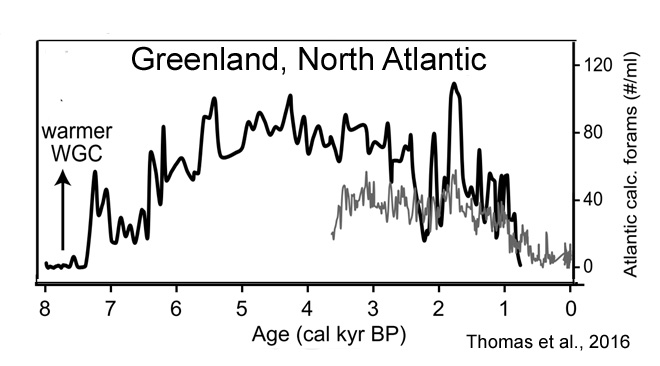
Thomas et al., 2016 (Greenland, West)
Paired climate and ice sheet records from previous warm periods can elucidate the factors influencing GrIS mass balance on time scales longer than the observational record [Briner et al., 2016]. During the middle Holocene, temperature on Greenland was ~ 2°C higher than present [Cuffey and Clow, 1997; Axford et al., 2013].
Thirumalai et al., 2016 (Tropical Atlantic, Gulf of Mexico)

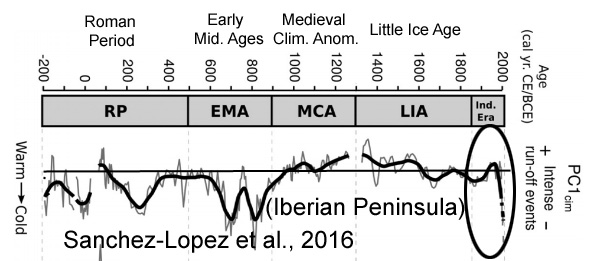
Sanchez-Lopez et al., 2016 (Iberian Peninsula)
The dominant warm and arid conditions during the MCA [Medieval Climate Anomaly, 900-1300 CE], and the cold and wet conditions during the LIA [Little Ice Age, 1300-1850 CE] indicate the interplay of the NAO+, EA+ and NAO- , EA- [positive/negative North Atlantic Oscillation, East Atlantic phases], respectively. Furthermore, the higher solar irradiance during the [“warm conditions”] RP [Roman Period, 200 BCE – 500 CE] and MCA [Medieval Climate Anomaly, 900-1300 CE] may support the predominance of the EA+ [positive East Atlantic] phase, whereas the opposite scenario [“colder temperatures”] during the EMA [Early Middle Age, 500-900 CE] and LIA [Little Ice Age, 1300-1850 CE] may support the predominance of the EA- [negative East Atlantic] phase, which would favour the occurrence of frequent and persistent blocking events in the Atlantic region during these periods.
Lyu et al., 2016 (China)

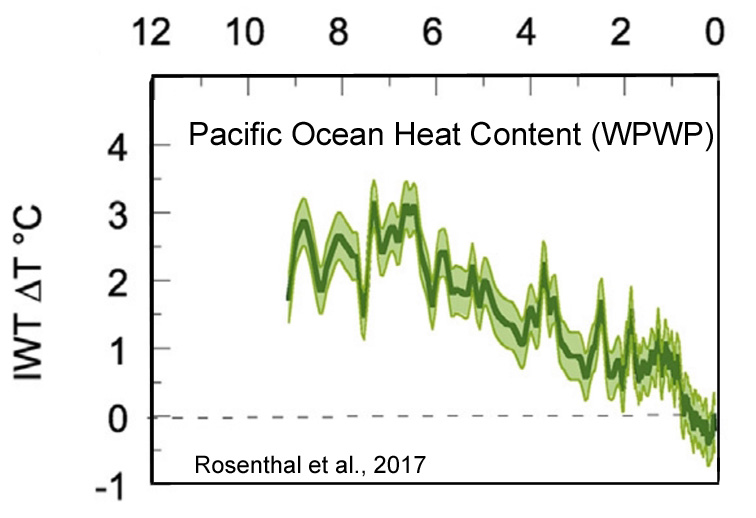
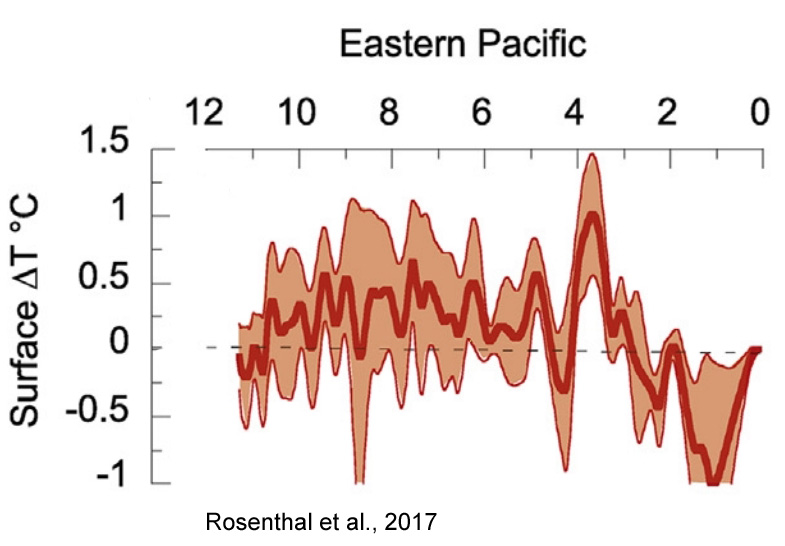
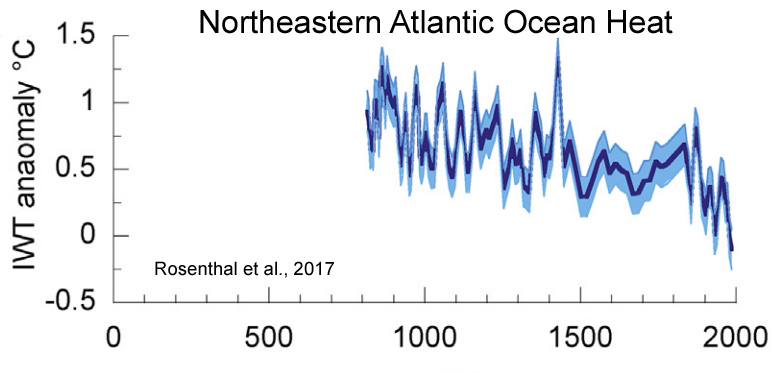
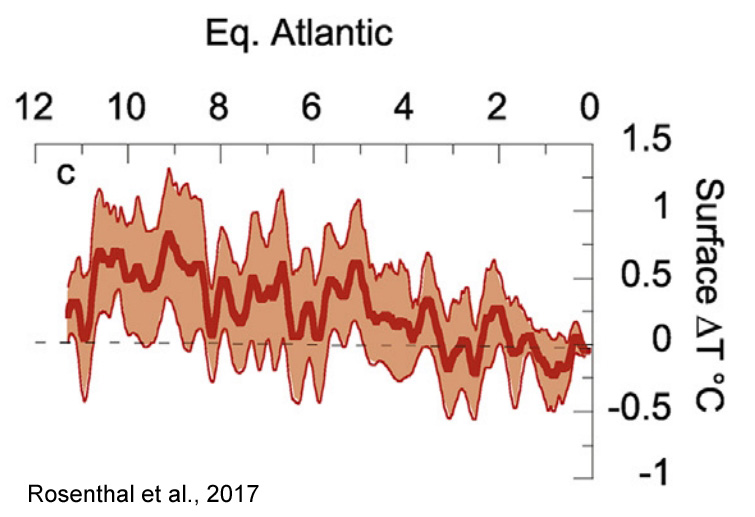
Rosenthal et al., 2017 (Pacific, Atlantic Oceans)
Here we review proxy records of intermediate water temperatures from sediment cores and corals in the equatorial Pacific and northeastern Atlantic Oceans, spanning 10,000 years beyond the instrumental record. These records suggests that intermediate waters [0-700 m] were 1.5-2°C warmer during the Holocene Thermal Maximum than in the last century. Intermediate water masses cooled by 0.9°C from the Medieval Climate Anomaly to the Little Ice Age.
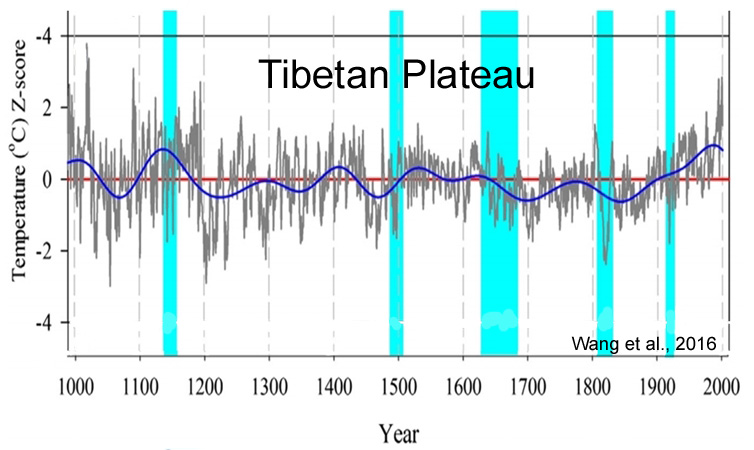
Wang et al., 2016 (Tibetan Plateau)
.
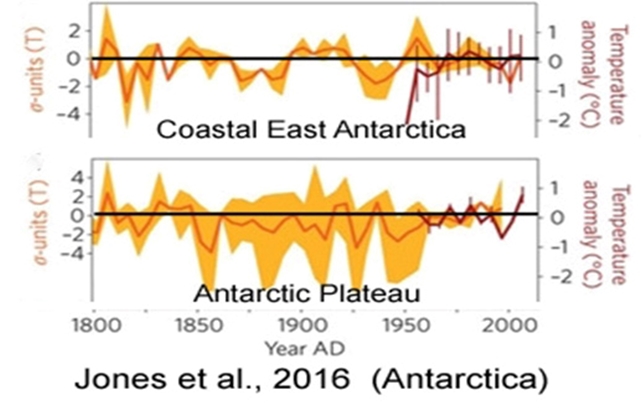
Jones et al., 2016 (East Antarctica, Antarctic Plateau)
Over the 36-year satellite era, significant linear trends in annual mean sea-ice extent, surface temperature and sea-level pressure are superimposed on large interannual to decadal variability. Most observed trends, however, are not unusual when compared with Antarctic palaeoclimate records of the past two centuries.
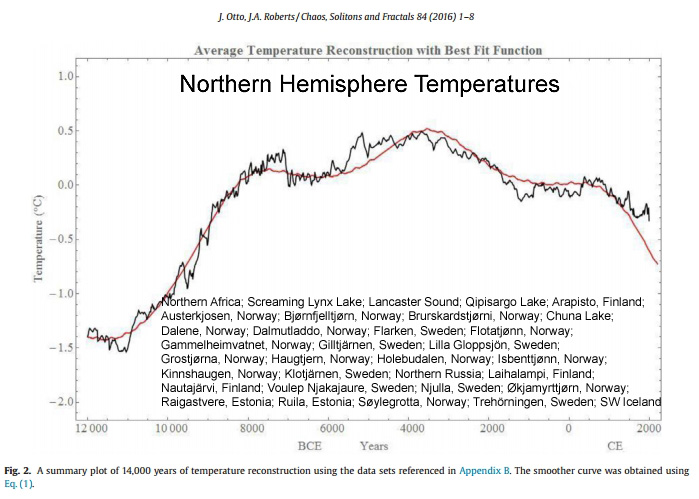
Otto and Roberts, 2016 (Northern Hemisphere)
In addition to temperature records limited to the past 4000 years, data for the past few thousand years were tested. When the data were explored over the past 10,000 years, greater fluctuations in the temperature can be seen with a significant rise in temperature beginning at about 11,000 BCE and ending at 2000 CE with a maximum at about 5,000 BCE.
Present <
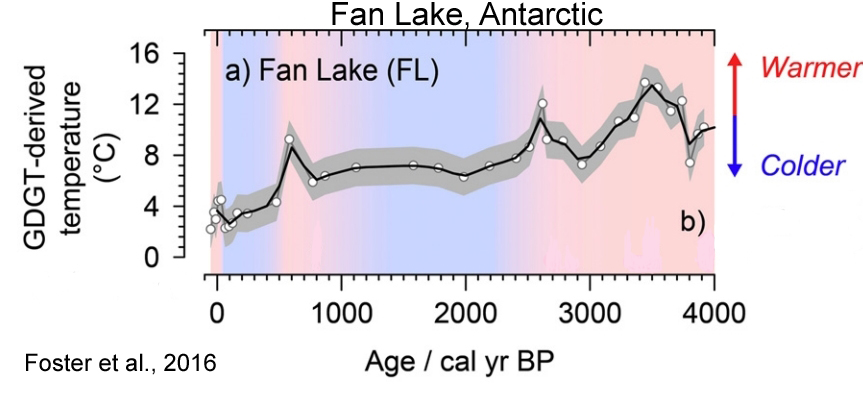
Foster et al., 2016 (Fan Lake, Antarctic)
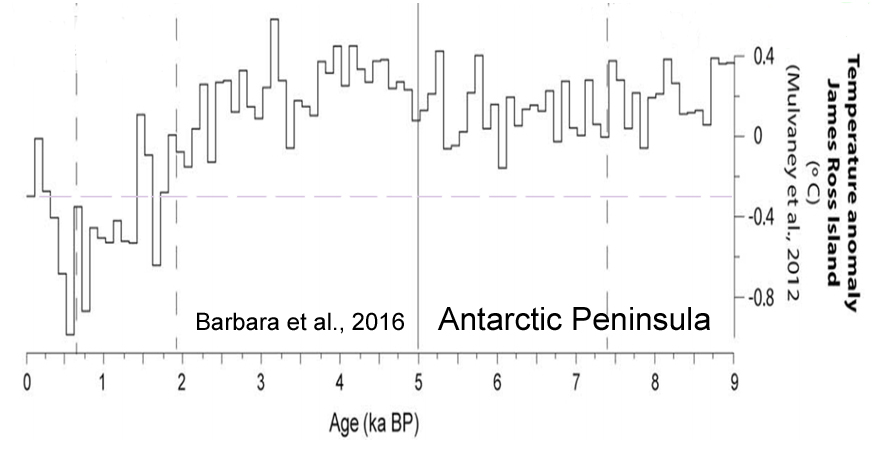
The Antarctic and sub-Antarctic GDGT–temperature reconstruction for Fan Lake showed the warmest conditions between c. 3800 to 3300 cal yr BP with additional peaks in temperature at c. 2600 and 600 cal yr BP.
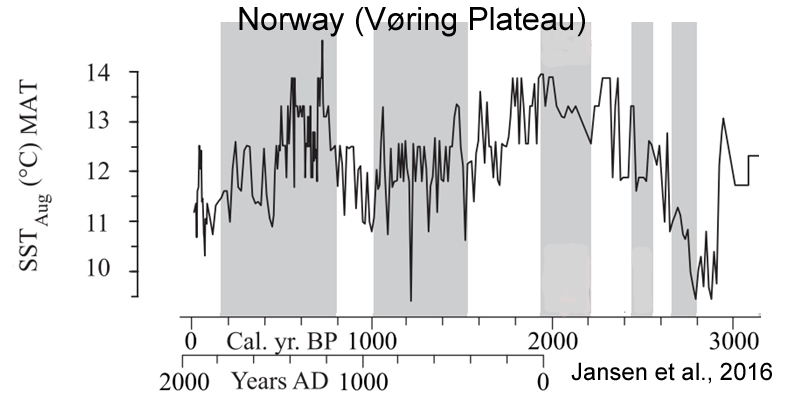
Jansen et al., 2016 (Norway)
We suggest that deviations in ELA fluctuations between Scandinavian maritime and continental glaciers around 7150, 6560, 6000, 5150, 3200 and 2200 cal. yr BP reflect the different response of continental and maritime glaciers to drops in total solar irradiance (TSI).
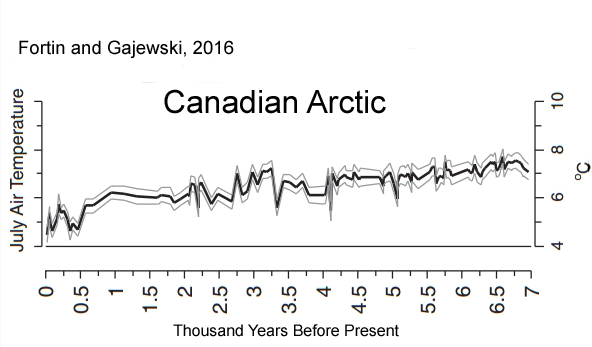
Fortin and Gajewski, 2016 (Canadian Arctic)
A study of chironomid remains in the sediments of Lake JR01 on the Boothia Peninsula in the central Canadian Arctic provides a high-resolution record of mean July air temperatures for the last 6.9 ka …. Biological production decreased again at ~ 2 ka and the rate of cooling increased in the past 2 ka, with coolest temperatures occurring between 0.46 and 0.36 ka [460 and 360 years ago], coinciding with the Little Ice Age. Although biological production increased in the last 150 yr, the reconstructed temperatures do not indicate a warming during this time. … Modern inferred temperatures based on both pollen and chironomids are up to 3°C cooler than those inferred for the mid-Holocene.
Barbara et al., 2016 (Antarctic Peninsula)
Briner et al., 2016 (Greenland Ice Sheet)
The temperature decrease from the warmest to the coolest portions of the Holocene is 3.0 ± 1.0 °C on average (n = 11 sites). The Greenland Ice Sheet retracted to its minimum extent between 5 and 3 ka [5,000 and 3,000 years ago], consistent with many sites from around Greenland depicting a switch from warm to cool conditions around that time.
The temperature record, which integrates all seasons, shows rapid warming from the onset of the Holocene until ~9.5 ka [9,500 years ago], relatively uniform temperature at the millennial scale until ~7 ka [7,000 years ago], followed by ~3.5 °C temperature decline to the Little Ice Age [1250-1850 C.E.], followed by ~1.5 °C warming to today. [Today’s Greenland Ice Sheet temperatures are 2.0 °C colder than the Early and Middle Holocene] . The record
– See more at: http://notrickszone.com/2016/12/22/the-hockey-stick-collapses-50-new-2016-scientific-papers-affirm-todays-warming-isnt-global-unprecedented-or-remarkable/#sthash.91aBzQcF.dpuf
remarkable, unnatural, and largely unprecedented. In other words, today’s climate is substantially and alarmingly different than what it has been in the past….because the human impact has been profound. Well, maybe. Scientists are increasingly finding that the two fundamental points cited above may not be supported by the evidence. In 2016, an examination of the peer-reviewed scientific literature has uncovered dozens of paleoclimate reconstructions that reveal modern “global” warming has not actually been global in scale after all, as there are a large number of regions on the globe where it has been cooling for decades. Even if it was warming on a global scale, the paleoclimate evidence strongly suggests that the modern warm climate is neither unusual or profoundly different than it has been in the past. In fact, today’s regional warmth isn’t even close to approaching the Earth’s maximum temperatures achieved earlier in the Holocene, or as recently as 1,000 years ago (the Medieval Warm Period), when anthropogenic CO2 emissions could not have exerted a climate impact. In fact, there is a growing body of evidence that the warming in recent decades is not even unprecedented within the context of the last 80 years. That’s because the amplitude of the 1930s and 1940s warm period matched or exceeded that of the warmth in the late 20th and early 21st centuries in many regions of the world. Furhthermore, between the warmth of the 1930s and ’40s and the warmth of the 1990s to present, there was a very widely publicized cooling period (late 1950s to early 1970s) that was heavily discussed in the peer-reviewed scientific literature. Today’s instrumental datasets curiously do not reflect this 20th century warming-cooling-warming oscillatory shape, however, as doing so would not lend support to the modeled understanding that climate is shaped by anthropogenic CO2 emissions, which have increased linearly, not cyclically. In fact, not only has the high amplitude of the 1930s and 1940s warmth been “adjusted” down or depressed in global-scale representations of instrumental temperatures by NASA or the MetOffice, the substantial cooling (-0.5°C in the Northern Hemisphere, including -1.5°C cooling in the Arctic region) that occurred in the 1960s and 1970s has all but disappeared from today’s temperature graphs. Scientists, meanwhile, keep on publishing their results. And their results don’t lend support to the narrative that the globe has been synchronously warming, or warming in linear fashion and in concert with the rise in anthropogenic CO2 emissions. Indeed, in many regions of the world, decadal-scale cooling has occurred since the mid-20th century. Listed below are a collection of 50 peer-reviewed scientific papers published within the last year (2016) undermining the “consensus” position that modern warming patterns are global in extent and synchronization, and that today’s warmth is both unusual and unprecedented. The first section (1) identifies the regions of the world where there has been no net warming in recent decades. The second section (2) puts modern climate into its much larger Holocene context, revealing just how insignificant and unremarkable this current (regional) warming trend has been relative to history. ‘Global’ Warming? No Net Warming In These Regions Since Mid Or Late 20th Century De Jong et al., 2016 (Andes, South America) [T]he reconstruction…shows that recent warming (until AD 2009) is not exceptional in the context of the past century. For example, the periods around AD 1940 and from AD 1950–1955 were warmer. This is also shown in the reanalysis data for this region and was also observed by Neukom et al. (2010b) and Neukom and Gergis (2011) for Patagonia and central Chile. Similarly, based on tree ring analyses from the upper tree limit in northern Patagonia, Villalba et al. (2003) found that the period just before AD 1950 was substantially warmer than more recent decades. Zhu et al., 2016 (China) [W]e should point out that the rapid warming during the 20th century was not especially obvious in our reconstructed RLST. Zhang et al., 2016 (Scandinavia) [P]resent-day global mean air temperatures may have been equally high around 1000 years ago during the so-called Medieval Climate Anomaly (MCA; Lamb, 1969; Grove and Switsur, 1994). However, since regional temperature reconstructions display large variability in the timing and magnitude of the MCA (PAGES 2k Consortium, 2013), this issue has not yet been adequately settled. Hence, there is still a great need to produce and improve empirical proxy data to further our understanding of near and distant climate changes. Zhao et al., 2016 (Greenland Ice Sheet) Sunkara and Tiwari, 2016 (India, Western Himalayas) Turner et al., 2016 (Antarctic Peninsula) Absence of 21st century warming on Antarctic Peninsula consistent with natural variability Tejedor et al., 2016 (Iberian Range, Spain) Chandler et al., 2016 (South Iceland) Analysis of climate data for SE Iceland also indicates that the three periods of ice-frontal retreat [1936-’41, 1951-’56, and 2006-’11] identified are associated with similar summer air temperature values, which has previously been shown to be a key control in terminus variations in Iceland. We, therefore, demonstrated that the coincidence of the most recent phase of ice-frontal retreat at Skálafellsjökull (2006–2011) and warming summer temperatures is not unusual in the context of the last ~80 years. This highlights the need to place observations of contemporary glacier change in a broader, longer-term (centennial) context. Jones et al., 2016 (Southern Ocean) [C]limate model simulations that include anthropogenic forcing are not compatible with the observed trends. Zhu et al., 2016 (Northeast China) We identified four major cold periods (1839–1846, 1884–1901, 1906–1908 and 1941–1958) and three major warm periods (1855–1880, 1918–1932 and 1998–2013) in the past 211 years. The multi-taper method spectral analysis revealed significant cycles at 48.8, 11.5, 8.9, 3.9, 3.5 and 2–3 years, which might be associated with global climate oscillations and land-sea thermal contrasts, such as the sea surface temperatures, El Niño-Southern Oscillation, Atlantic Multidecadal Oscillation and solar activity. Rydval et al., 2016 (Scotland) Hasholt et al., 2016 (Southeast Greenland) We determined that temperatures for the ablation measurement periods in late July to early September were similar in both 1933 and the recent period [1990s – present], indicating that the temperature forcing of ablation within the early warm period and the present are similar. Incarbona et al., 2016 (Sicily, Aegean Sea) Solar activity modulates patterns in surface temperature and pressure that resemble NAO phases, through dynamical coupling processes between the stratosphere and the troposphere that transmit the solar signal to the Earth’s surface. Tipton et al., 2016 (Hudson Valley, New York) Ogi et al, 2016 (Greenland, West and South) Zinke et al., 2016 (Indian Ocean) We calibrate individual robust Sr / Ca records with in situ SST and various gridded SST products. The results show that the SST record from Cabri provides the first Indian Ocean coral proxy time series that records the SST signature of the PDO in the south-central Indian Ocean since 1945. … Marked negative Sr /Ca anomalies (warmer) are observed during the first half of the 20th century centred at 1918/19, 1936–1941 and in the period 1948–1951 that exceed anomalies in the 1961 to 1990 reference period. O’Donnell et al., 2016 (Australia SE) Christy and McNider, 2016 (Alabama, U.S.) The time frame is 1883-2014. … Varying the parameters of the construction methodology creates 333 time series with a central trend-value based on the largest group of stations of -0.07 °C decade-1 with a best-guess estimate of measurement uncertainty being -0.12 to -0.02 °C decade-1. This best-guess result is insignificantly different (0.01 C decade-1) from a similar regional calculation using NOAA nClimDiv data beginning in 1895. … Finally, 77 CMIP-5 climate model runs are examined for Alabama and indicate no skill at replicating long-term temperature and precipitation changes since 1895. van As et al., 2016 (Greenland Ice Sheet) We conclude that at our study sites annual net ablation is likely to be larger in recent years than during any previous period in the instrumental era, covering up to 150 years. … [I]n southern Greenland ablation peaked significantly around 1930. While most of Greenland underwent relatively warm (summer) conditions in the 1930s (Cappelen 2015), this was most notable at the more southern locations, resulting in amplified ablation values according to our estimates. JJA [summer] temperatures were higher in 1928 and 1929 than in any other year of the Qaqortoq record, both attaining values of 9.2°C. This suggests that ablation in those years may have exceeded the largest net ablation measured on the Greenland ice sheet ( 2010). Ellenburg et al., 2016 (Southeastern U.S.) Munz et al., 2015 (Arabian Sea) Today’s Climate Still Colder Than Most Of The Last 10,000 Years Present > Fudge et al., 2016 (West Antarctica) Harning et al., 2016 (Iceland) Distal lakes document rapid early Holocene deglaciation from the coast and across the highlands south of the glacier. Sediment from Skorarvatn, a lake to the north of Drangajokull, shows that the northern margin of the ice cap reached a size comparable to its contemporary limit by ~10.3 ka. Two southeastern lakes with catchments extending well beneath modern Drangajokull confirm that by ~9.2 ka, the ice cap was reduced to ~20% of its current area. Jalali et al., 2016 (Mediterranean Sea) Several proxy records have documented surface water variability of the Mediterranean Sea during the Holocene (Kallel et al., 1997a, b, 2004; Cacho et al., 2001; Guinta et al., 2001; Rohling et al., 2002; Emeis et al., 2003; Essalami et al., 2007; Frigola et al., 2007; Castañeda et al., 2010; Boussetta et al., 2012; Martrat et al., 2014). Most of them reveal that Mediterranean Sea surface temperatures (SSTs) have undergone a long-term cooling punctuated by several cold relapses (CRs; Cacho et al., 2001; Frigola et al., 2007). While orbital forcing likely explains this long-term tendency, solar activity and volcanism contribute to forced variability (Mayewski et al., 2004; Wanner et al., 2011) together with internal variability (i.e. Atlantic multi-decadal variability (AMV), North Atlantic Oscillation; NAO) all together embedded in the multi-decadal scale variability seen in paleorecords. Finsinger et al., 2016 (Romania, Carpathians) Ge et al., 2016 (China) Results of this study show that warm intervals over the last 2000 years were in AD 1-200, AD 551-760, AD 951-1320, and after AD 1921, while cold intervals were in AD 201-350, AD 441-530, AD 781-950, and AD 1321-1920. Interestingly, temperatures during AD 981-1100 and AD 1201-1270 were comparable to those of our Present Warm Period, but have an uncertainty of 0.28°-0.42°C at 95% confidence level. Temperature variations over the whole of China are typically in phase with those of the Northern Hemisphere (NH) after AD 1000, the period which covers the Medieval Climate Anomaly, the Little Ice Age (LIA), and the Present Warm Period. Thomas et al., 2016 (Greenland, West) Paired climate and ice sheet records from previous warm periods can elucidate the factors influencing GrIS mass balance on time scales longer than the observational record [Briner et al., 2016]. During the middle Holocene, temperature on Greenland was ~ 2°C higher than present [Cuffey and Clow, 1997; Axford et al., 2013]. Thirumalai et al., 2016 (Tropical Atlantic, Gulf of Mexico) Sanchez-Lopez et al., 2016 (Iberian Peninsula) The dominant warm and arid conditions during the MCA [Medieval Climate Anomaly, 900-1300 CE], and the cold and wet conditions during the LIA [Little Ice Age, 1300-1850 CE] indicate the interplay of the NAO+, EA+ and NAO- , EA- [positive/negative North Atlantic Oscillation, East Atlantic phases], respectively. Furthermore, the higher solar irradiance during the [“warm conditions”] RP [Roman Period, 200 BCE – 500 CE] and MCA [Medieval Climate Anomaly, 900-1300 CE] may support the predominance of the EA+ [positive East Atlantic] phase, whereas the opposite scenario [“colder temperatures”] during the EMA [Early Middle Age, 500-900 CE] and LIA [Little Ice Age, 1300-1850 CE] may support the predominance of the EA- [negative East Atlantic] phase, which would favour the occurrence of frequent and persistent blocking events in the Atlantic region during these periods. Lyu et al., 2016 (China) Rosenthal et al., 2017 (Pacific, Atlantic Oceans) Here we review proxy records of intermediate water temperatures from sediment cores and corals in the equatorial Pacific and northeastern Atlantic Oceans, spanning 10,000 years beyond the instrumental record. These records suggests that intermediate waters [0-700 m] were 1.5-2°C warmer during the Holocene Thermal Maximum than in the last century. Intermediate water masses cooled by 0.9°C from the Medieval Climate Anomaly to the Little Ice Age. Wang et al., 2016 (Tibetan Plateau) . Jones et al., 2016 (East Antarctica, Antarctic Plateau) Over the 36-year satellite era, significant linear trends in annual mean sea-ice extent, surface temperature and sea-level pressure are superimposed on large interannual to decadal variability. Most observed trends, however, are not unusual when compared with Antarctic palaeoclimate records of the past two centuries. Otto and Roberts, 2016 (Northern Hemisphere) In addition to temperature records limited to the past 4000 years, data for the past few thousand years were tested. When the data were explored over the past 10,000 years, greater fluctuations in the temperature can be seen with a significant rise in temperature beginning at about 11,000 BCE and ending at 2000 CE with a maximum at about 5,000 BCE. Present < Foster et al., 2016 (Fan Lake, Antarctic) The Antarctic and sub-Antarctic GDGT–temperature reconstruction for Fan Lake showed the warmest conditions between c. 3800 to 3300 cal yr BP with additional peaks in temperature at c. 2600 and 600 cal yr BP. Jansen et al., 2016 (Norway) We suggest that deviations in ELA fluctuations between Scandinavian maritime and continental glaciers around 7150, 6560, 6000, 5150, 3200 and 2200 cal. yr BP reflect the different response of continental and maritime glaciers to drops in total solar irradiance (TSI). Fortin and Gajewski, 2016 (Canadian Arctic) A study of chironomid remains in the sediments of Lake JR01 on the Boothia Peninsula in the central Canadian Arctic provides a high-resolution record of mean July air temperatures for the last 6.9 ka …. Biological production decreased again at ~ 2 ka and the rate of cooling increased in the past 2 ka, with coolest temperatures occurring between 0.46 and 0.36 ka [460 and 360 years ago], coinciding with the Little Ice Age. Although biological production increased in the last 150 yr, the reconstructed temperatures do not indicate a warming during this time. … Modern inferred temperatures based on both pollen and chironomids are up to 3°C cooler than those inferred for the mid-Holocene. Barbara et al., 2016 (Antarctic Peninsula) Briner et al., 2016 (Greenland Ice Sheet) The temperature decrease from the warmest to the coolest portions of the Holocene is 3.0 ± 1.0 °C on average (n = 11 sites). The Greenland Ice Sheet retracted to its minimum extent between 5 and 3 ka [5,000 and 3,000 years ago], consistent with many sites from around Greenland depicting a switch from warm to cool conditions around that time. The temperature record, which integrates all seasons, shows rapid warming from the onset of the Holocene until ~9.5 ka [9,500 years ago], relatively uniform temperature at the millennial scale until ~7 ka [7,000 years ago], followed by ~3.5 °C temperature decline to the Little Ice Age [1250-1850 C.E.], followed by ~1.5 °C warming to today. [Today’s Greenland Ice Sheet temperatures are 2.0 °C colder than the Early and Middle Holocene] . The record also shows centennial-scale variability on the order of 1-2 °C, and a ~3 °C temperature oscillation during the 8.2 ka event. Brocas et al., 2016 (Tropical Atlantic) [W]ithin the mid-LIG [Last Interglacial, ~125,000 years ago], a significantly higher than modern SST seasonality of 4.9°C (at 126 ka) and 4.1°C (at 124 ka) is observed. These findings are supported by climate model simulations and are consistent with the evolving amplitude of orbitally induced changes in seasonality of insolation throughout the LIG, irrespective of wider climatic instabilities that characterised this period. Gjerde et al., 2016 (Norway) The resulting Pw record is of higher resolution than previous reconstructions from glaciers in Norway and shows the potential of glacier records to provide high-resolution data reflecting past variations in hydroclimate. Complete deglaciation of the Ålfotbreen occurred ~9700 cal yr BP, and the ice cap was subsequently absent or very small until a short-lived glacier event is seen in the lake sediments ~8200 cal yr BP. The ice cap was most likely completely melted until a new glacier event occurred around ~5300 cal yr BP, coeval with the onset of the Neoglacial at several other glaciers in southwestern Norway. Ålfotbreen was thereafter absent (or very small) until the onset of the Neoglacial period ~1400 cal yr BP. The ‘Little Ice Age’ (LIA) ~650-50 cal yr BP [1350 to 1950] was the largest glacier advance of Ålfotbreen since deglaciation, with a maximum extent at ~400-200 cal yr BP, when the ELA was lowered approximately 200 m relative to today. Yu et al, 2016 (Western Antarctica Peninsula) The period at 900–600 cal B.P. was coldest as indicated by ice advance, abundance of kill ages from ice-entombed mosses exposed recently from retreating glacial ice, and apparent gap in peatbank initiation. Furthermore, the discovery of a novel Antarctic hairgrass (Deschampsia antarctica) peatland at 2300–1200 cal B.P. from the mainland Antarctic Peninsula suggests a much warmer climate than the present. … [T]he sea surface temperature record from Palmer Deep off Anvers Island suggests a pronounced climate warming of ~3°C at 1600–500 cal B.P. [Shevenell et al., 2011]. Solomina et al., 2016 (Caucasus Mountains) The climate was warmer and glaciers were likely receding in the beginning of the past millennium CE (the “Arkhyz break in glaciation”). … In this pass, remains of wood radiocarbon dated to 700 ± 80 BP (1180–1420 CE) were buried in a 1.5-m-thick layer of alluvium (Kaplin et al., 1971; Kotlyakov et al., 1973). Currently, the upper tree limit is located 800–900 m below this elevation. … According to indirect estimates based on pollen analyses, the upper tree limit in the “Arkhyz” period was 200–300 m higher than today (Tushinsky, Turmanina, 1979). The remains of ancient buildings and roads were also found in the Klukhorsky pass at an elevation of 2781 a.s.l. [above sea level] (Tushinsky et al., 1966), and the glacier was still present at this elevation in the mid 20th century. … [I]n Central and East Transcaucasia, there are artificial terraces at elevations where agriculture is not currently possible and that there are remnants of forests in places where forests have not grown since the 16th century CE. … Turmanina (1988), based on pollen analysis, suggested that, in the Elbrus area, the climate during the “Arkhyz” time was dryer and warmer than in the late 20th century by 1–2 °C. … Solomina et al. (2014) determined the Medieval warming in the Caucasus to be approximately 1 °C warmer than the mean of the past 4500 years. According to the Karakyol palynological and geochemical reconstructions, the warm period was long and lasted for five centuries. Considering the suggestion of Turmanina (1988) that it was also less humid, the likelihood that many glaciers, especially those located at relatively low elevation, disappeared is very high. … The maximum glacier extent in the past millennium was reached before 1598 CE. The advance of the 17th century CE, roughly corresponding to the Maunder Minimum, is recorded at Tsey Glacier. … General glacier retreat started in the late 1840s CE and four to five minor readvances occurred in the 1860s–1880s CE. In the 20th century CE, the continued retreat was interrupted by small readvances in the 1910s, 1920s and 1970s–1980s. Bolch et al., 2016 (Himalayas, Karakoram) Glaciers in the Hunza Catchment (Karakoram) are in balance since the 1970s … Previous geodetic estimates of mass changes in the Karakoram revealed balanced budgets or a possible slight mass gain since the year ~ 2000. Indications for longer-term stability exist but no mass budget analyses are available before 2000. Here, we show that glaciers in the Hunza River basin (Central Karakoram) were on average in balance since the 1970s based on analysis of stereo Hexagon KH-9, SRTM, ASTER and Cartosat-1 data. Heterogeneous behaviour and frequent surge activities were also characteristic for the period before 2000. Lundeen and Brunelle, 2016 (Idaho, United States) Together, the proxies suggest that the early Holocene experienced larger than average snowpacks but very warm summers. Warmer than modern summer temperatures were maintained through much of the mid-Holocene, but snowpacks decreased dramatically, creating the most