#
By P Gosselin on 10. October 2015
More people and more wealth, yet less losses. That’s what the latest 2014 disaster statistics tell us. Bad news for the doomsday worshippers and cheerleaders.
The Geneva-Switzerland based International Federation of the Red Cross recently released its 2014 Natural Disaster Report, according to the German online daily BILD here. If anything, the news is very good – with huge drops in losses.
Moreover US hurricane and tornado activity trends since 1950 have remained flat or are decreasing respectively.
A copy of the report’s results is here. The AON Executive Summary writes (my emphasis):
Down Again: 2014 Catastrophe Losses Below Average
Global natural disasters1 in 2014 combined to cause economic losses of USD 132 billion, 37 percent below the ten-year average of USD211 billion. The losses were attributed to 258 separate events, compared to the ten-year average of 260. The disasters caused insured losses of USD39 billion, 38 percent below the ten-year average of USD63 billion and was the lowest insured loss total since 2009. This was the second consecutive year with below normal catastrophe losses. Notable events during the year included major flooding in India, Pakistan, China, and Southeast Europe; billion-dollar convective thunderstorm events in the United States, France, and Germany; winter storms in Japan and the United States; and widespread drought in the United States and Brazil. The top three perils, flood, tropical cyclone, and severe weather, combined for 72 percent of all economic losses in 2014. Despite 75 percent of catastrophe losses occurring outside of the United States, it still accounted for 53 percent of global insured losses, driven by a higher insurance penetration.”
According to the Red Cross data, many of the deaths were due to cold, with 505 alone occurring in one country – Peru! Among the top disasters were brutal winters in the USA and japan – hardly what one would expect from “global warming”.
90% less deaths
A total of 8186 people died in 2014 because of natural disasters. Bild reports: “2014 the number of deaths from natural disasters was almost 90 percent under the 10-year average of 76 500 deaths.” That’s hugely good news, but you’d never know it hearing the media!
Lowest in 10 years
According to the IFRC, in 94 countries there were a total of 317 floods, earthquakes, forest fires, cyclones and a number of other nature events with deaths. “But that was the lowest number in 10 years.“, BILD reports.
But the IFRC report insists that the news is bad no matter what, and warns that the good news won’t last, citing more severe weather events in the future (no date given) because of global climate change.
No Cat 3 hurricane landfall in 9 years
But data show the opposite. For example when it comes to hurricanes, the AON report writes on page 12:
The 2014 Atlantic Hurricane Season marked the ninth consecutive year in which the U.S. did not sustain a major Category 3+ landfalling hurricane, which extends the alltime record by another year. It was also the quietest season in terms of named storms since 1997.”
It’s stunning that some are actually out there screaming things are worse than ever when the opposite is the truth.
One of least active since Doppler radar began
For the third consecutive year, tornado season in the United States was one of the least active since Doppler radar began being deployed in the early 1990s.”
Here’s the chart of the last 10 years – no change:

Also on page 18 the chart on acres burned by wildfire shows that 2014 was near a decade low:
The Appendix of the AON report also provides more charts on hurricane and tornado trends since 1950. What follows is a chart showing United States hurricane landfalls:
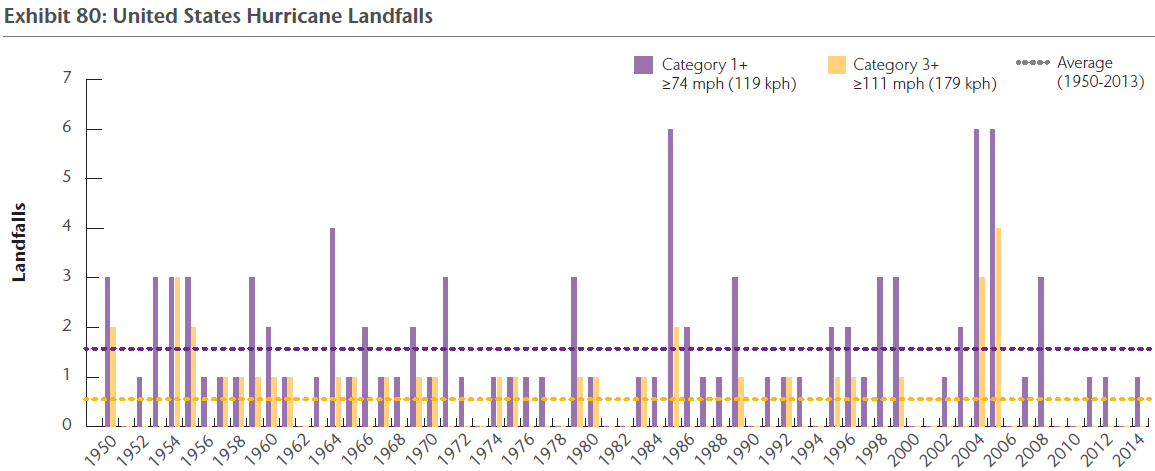
No trends in hurricane landfalls. Source: NOAA IBTrACS historical tropical cyclone database.
Violent tornadoes on the decrease
On violent tornadoes, the AON report writes:
Since 1950, the overall trend of higher-end tornadoes rated at F3/EF3 and above has remained nearly flat and shows a slight annual decrease of 0.8 percent. A comparable 1.2 percent annual decrease is also found when looking at dependable data since the advent of Doppler radar in 1990. When breaking down data to just the last 10 years, there has been a similar nearly flat growth at 0.5 percent.”
Here’s the chart:
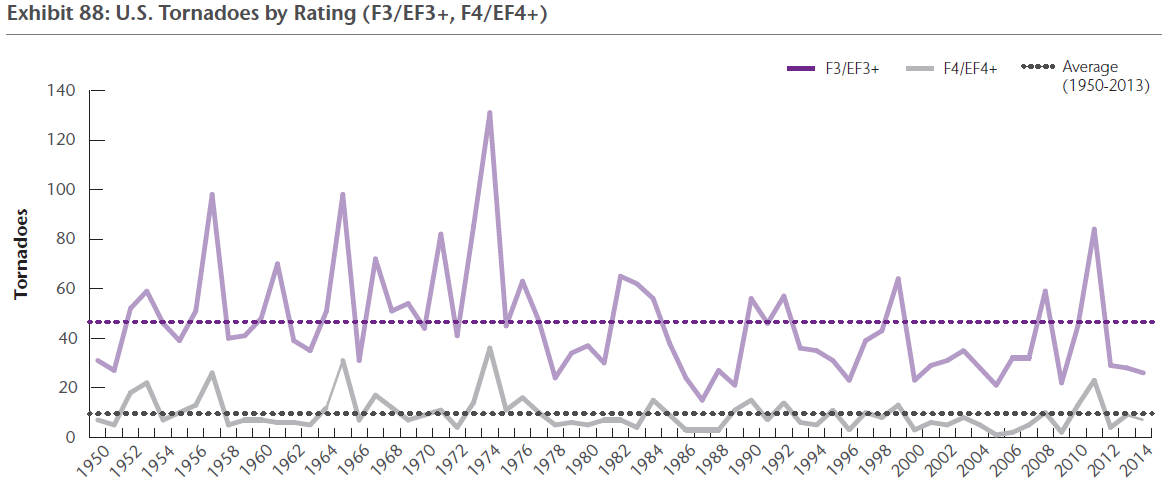
Here we can see that violent tornadoes were considerably more frequent from 1950 – 1975 – back in the days of ice age warnings!
So the next time some hysterical alarmists insist weather extremes are getting worse, send the link to the AON report and tell them to look at the data for once.
Chart sources: AON Benfield
– See more at: http://notrickszone.com/2015/10/10/inconvenient-truths-2014-global-natural-disasters-down-massively-no-trend-in-tornadocyclones-since-1950/#sthash.2y7HXCSU.dpuf