Special to Climate Depot
Named and shamed: the shoddy, rent-a-quote “scientists”
By Christopher Monckton of Brenchley
IT IS time to be angry at the intellectual bankruptcy of climate “science” today. We should also be fearful of the UN’s gruesome plan, aided and abetted by ministers and bureaucrats worldwide, to establish a global climate “government” by an irrevocable treaty in Paris this December on the basis of what is now known to be dodgy and even fraudulent science.
No such treaty is needed. A climate science paper by Dr Willie Soon, Professor David Legates, Matt Briggs and me, just published in the Science Bulletin of the Chinese Academy of Sciences, the Orient’s equivalent of Nature (at www.scibull.com, click on “Current Issue” to find our paper) demonstrates that the billion-dollar climate models that have so profitably predicted Thermageddon are hopelessly wrong.
Instead of 3, 5 or even 10 Cº of global warming in response to our doubling the CO2 in the air, there will be 1 Cº and perhaps less even than that. What “climate crisis”?
On January 22, Victoria Woollaston reported our results at www.mailonline.com, the website of the London Daily Mail, under the heading Is climate change really that dangerous? Predictions are ‘very greatly exaggerated’, claims study.
What happened next demonstrates the sorry state to which climastrology has sunk.
Within hours a blog funded by the wealthy but mysterious “European Climate Foundation” had gathered instant rent-a-quotes from half a dozen soi-disant climate “scientists” savagely but anti-scientifically attacking our paper.
The propaganda piece was misleadingly, laughably called “Factcheck”. Each of the “scientists” who were quoted made untrue assertions. Several of these creatures can be proven not to have read our paper before shooting their unscientific mouths off.
The “Factcheck” gets its facts wrong from the get-go. It says our paper had claimed that the major errors made by the huge computer models, each of which gobbles as much electricity as a small town, occur because the models are complex.
No. We said the models were wrong because they were using a rogue equation borrowed from electronic circuitry and bolted on to the climate, where it does not fit. That equation, and that alone, leads the modelers erroneously to triple the small and harmless 1 Cº global warming we should expect from a doubling of CO2 in the air.
From there, the propaganda piece went scientifically downhill. I now name and shame the shoddy, rentaquote “scientists”, and I demand their dismissal.
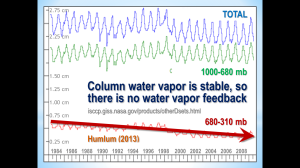
Professor Richard Allan, a weatherman at Reading University, said observations confirmed that water vapour strongly amplifies the small direct warming from CO2.
The truth: some do, some don’t. For instance, the International Satellite Cloud Climatology Project shows the water vapour content of the atmosphere as stable except in the climate-crucial mid-troposphere, where it has actually been declining for 30 years. That is the very opposite of what Professor Allan claims. The world has warmed by 0.5 Cº over the period, but the ISCCP record, at any rate, shows no more water vapour than before. The Professor should not have cherry-picked his facts.
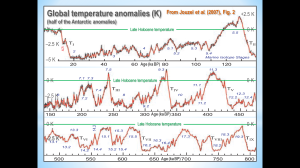
Professor Reto Knutti of the Swiss Federal Institute of Technology said we were wrong to study temperature change over the past 810,000 years because the climate was different when whole continents were covered by snow and ice.
The truth: four times in the past 810,000 years there were interglacial warm periods just like today (three of them were actually warmer). We had pointed out, correctly, that the range of average global temperatures in all that time, from iceball to hothouse and back, was little more than 3 Cº either side of the long-run average – about the same as the range of temperatures you set on your home heating thermostat. That is why we said climate feedbacks had to be very small.
Professor Knutti went on to say we had ignored the warming of the oceans.
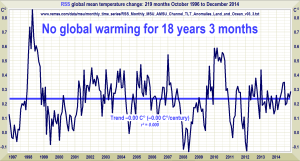
The truth: that is how we know he had not even read our paper before rushing to attack it. Far from ignoring the oceans, we had added a lengthy appendix on ocean “warming”. We said the Chinese Academy of Sciences had roundly debunked the “ocean notion” that heat hiding in the oceans is the reason why satellites defy the UN’s predictions and show no global warming for up to 18 years 3 months.
The ocean notion had in fact been put forward by a single small group of climate “scientists” writing each of four papers under different lead authors’ names. In that way, when – as is usual – other scientists mention the papers citing only the lead author’s name, it appears that four different groups are advancing the ocean notion when in fact there is just one.
In the climate journals, we also found and reported at least two dozen other mutually incompatible excuses for the failure of the world to warm at even half the central, business-as-usual rate the UN’s climate panel had predicted in its first multi-thousand-page report in 1990.
The likeliest of those reasons why the models have exaggerated warming is that the profiteers of doom had predicted far too much global warming in the first place.
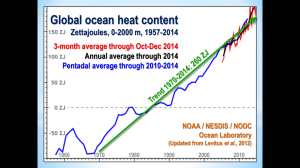
Professor Myles Allen, an earth scientist at Oxford, said the oceans had warmed “substantially” since 1970, though we had said they had not.
The truth: one of the most extreme estimates of ocean warming is that of the US National Oceanographic and Atmospheric Administration, which measures the warming but then artfully converts it into Zettajoules of ocean heat content. Then it sounds like a lot.
The trend on one of the most extreme indicators of global ocean warming, the NOAA dataset, shows 260 Zettajoules of growth in ocean heat content since 1970. Converting it back to temperature, in recent decades the ocean has been warming at a rate equivalent to just 0.2 Cº per century.
There are 650 million km3 of ocean. Each cubic meter weighs 1.033 tonnes. There are 4,186,800 Joules per tonne per Kelvin. Then:
260 ZJ increase in ohc 260,000,000,000,000,000,000,000 J
To raise 650,000,000,000,000,000 m3
x 1.033 te m–3 671,450,000,000,000,000 te
x 4,186,800 J te–1 K–1 2,811,226,860,000,000,000,000,000 J K–1
These figures represent an ocean warming of just 0.0925 K in 45 years. That is equivalent to only one-fiftieth of a Celsius degree per decade, or a fifth of a degree per century. Besides, each of the 3500 ARGO bathythermograph buoys measuring ocean temperatures has to cover almost 200,000 cubic kilometres of seawater. How reliable are those ocean temperature measurements really likely to be?
Professor Allen went on to say we should not have compared long-term predictions by the UN with medium-term warming since 1990.
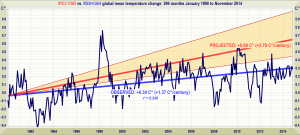
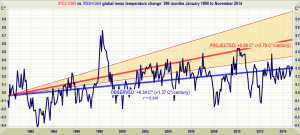
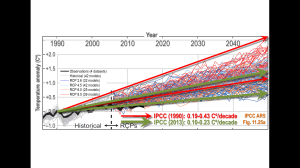
The truth: We compared the UN’s business-as-usual medium-term predictions from 1990-2025, adjusted to 2014, with real-world, measured medium-term warming over the past 25 years. The UN had predicted twice the warming that has occurred. We compared apples with apples. The graph would certainly not have passed peer review otherwise. It showed that the world has warmed in the quarter-century since 1990 at half the rate then predicted by the UN with “substantial confidence”.
Professor Allen also said we had used satellites, which measured the air above the ground and not surface measurements: the two were “simply not related”.
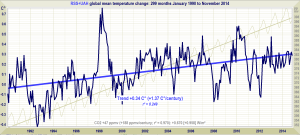
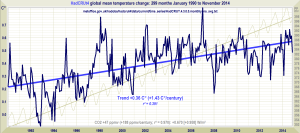
The truth: at a climate conference I organized at Cambridge in 2011, Professor Jones of UEA showed a graph of warming since the UN’s first report in 1990. His own surface temperature record showed much the same trend as the satellite data over the period. I have updated it. The average of the two satellite datasets shows 0.34 Cº warming since 1990. Professor Jones’ surface dataset shows – wait for it – 0.36 Cº. The trivial difference: one-fiftieth of a Celsius degree in those 25 years.
Professor Piers Forster, a climastrologist at Leeds University, said we had “cherry-picked numbers”.
The truth: That is how we knew he had not read our paper before attacking it. He provided not a single item of evidence, scientific or other, that we had cherry-picked any number. Our paper had in fact discussed each value we used.
Most of the numbers had come from official sources, as he would have known if he had taken the scientific precaution of actually reading what we had written.
Professor Forster went on to challenge our assertion that modellers’ current central prediction of global warming was far too big because they had not taken account of a new, lower feedback estimate from the UN’s climate panel. He said the panel had “not identified or quantified significant changes in feedback estimates”.
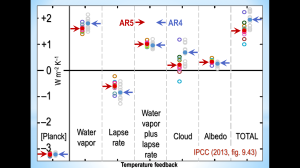
The truth: That is how we know the Profesdsor had not even read either our paper or the UN climate panel’s latest report, for which I was an expert reviewer, before attacking us. For we showed a diagram from the UN’s report that cut the previous feedback estimate from 2 to 1.5 Watts per square meter per Cº, requiring the UN’s warming estimate to be cut from 3.2 to 2.2 Cº.
However, the UN had instead refused to make any central estimate of how much warming a CO2 doubling would cause – even though that is the main purpose of its reports. Plainly it did not want to admit that all its previous central estimates of global warming had been very substantial exaggerations.
Dr Jan Perlwitz, a NASA modeller, said our model was not new.
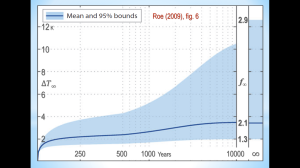
The truth: our model, unlike any other simple model, included several “array variables” allowing very sophisticated estimates to be made very simply. For instance, the different temperature feedbacks – influences that happen because there has been a direct warming and either amplify or attenuate it – operate over different timescales, so that the rate of warming may well change from decade to decade or century to century. Our model used the output of a simple model by Dr Gerard Roe, a pupil of the formidable Professor Richard Lindzen of MIT, and incorporated it into a table of data that could be fed into the model.
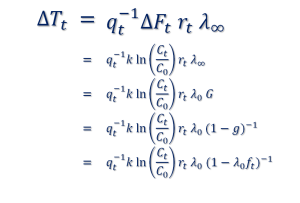
Also, in a single densely-argued paper, we had for the first time enabled any physics undergrad with a pocket calculator to make respectable estimates of future manmade global warming. Never before had anyone let the daylight in on the magic. Here is the central equation of our model:
Dr Perlwitz also said we had not cited previous authorities for one of the equations in our model.
The truth: that is how we know Dr Perlwitz had not even read our paper before attacking it. He has since had to row back on his allegation, for he had not realized we had indeed attributed the relevant equation to a systems engineer in the 1940s, and we had also acknowledged the UN, which had mentioned it in one of its reports.
Dr Perlwitz then contradicted himself, saying that the inapplicable equation was not used in the climate models anyway. Here is that equation, which belongs in electronic circuits but is not suitable if it is assumed, as the UN assumes, that temperature feedbacks are strongly net-positive:
The truth: two papers by James Hansen, one of which was actually cited by Dr Perlwitz in his comments for the propaganda piece, specifically refer to the use of the equation, or of the system gain it determines, in NASA’s climate models. But the equation is not suitable to the climate because it does not correctly represent the fact that temperature change, unlike changing voltage in a circuit, restores equilibrium after a radiative imbalance. Also, it says that if feedbacks become great enough they will drive temperature down, but that cannot happen in the real climate.
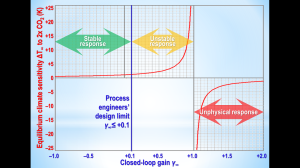
If this equation applies to the climate, it does so only where temperature feedback is small. Then global warming cannot exceed 1.3 Cº per CO2 doubling, and it might well be as little as 0.4 Cº.
Dr Perlwitz then makes a similar point to Dr Knutti’s about our interpretation of the mere 7 Cº range of global temperatures from ice ages to hothouse Earths and back over the past 810,000 years. He says that the influence of orbital variations on the amount of radiation reaching the Earth was less than 0.5 Watts per square meter.
The truth: the UN’s climate panel says the manmade increase in radiation since the Industrial Revolution is 2.3 Watts per square meter – almost five times the forcing that Dr Perlwitz says was enough to cause 7 Cº warming during each of the past four interglacial warm periods. Yet the warming since 1750 has been only 0.9 Cº. If Dr Knutti is right, the warming since 1750 should have been 32 Cº, or 36 times what has actually been observed.
For one thing, Dr Perlwitz has failed to take into account the changes in CO2 concentration between ice ages and interglacial warm periods, which add a further 2.4 Watts per square meter of radiation to the system. And it is still not known for certain what caused the warm periods in the first place. Plainly there was more than 0.5 Watts per square meter of forcing at work.
Dr Perlwitz goes on to say we should not have set an upper limit of 0.1 on the closed-loop gain in the climatic feedback circuit. He thinks this value, which he quotes us as saying was “the maximum value allowed by process engineers designing electronic circuits”, is too low. He says: “There is no logic here, whatsoever, unless there is some metaphysical belief behind this of the kind that there was a chief process engineer of everything who wouldn’t allow positive feedbacks in the climate system either.”
The truth: Dr Perlwitz is guilty of one of the oldest and shoddiest tricks in the book: incomplete quotation. What our paper had said was this:
“… a regime of temperature stability is represented by g∞ ≤ +0.1, the maximum value allowed by process engineers designing electronic circuits intended not to oscillate under any operating conditions.”
Unaccountably, Dr Perlwitz somehow failed to include in his quotation the words in bold type. He also omitted to mention our explanation that followed:
“Of course, other assumptions might be made: however, in a near-perfectly thermostatic system net-negative feedback is plausible, indicating that the climate – far from amplifying any temperature changes caused by a direct forcing – dampens them instead. Indeed, this damping should be expected, since temperature change is not merely a bare output, as voltage change is in an electronic circuit: temperature change is also the instrument of self-equilibration in the system, since radiative balance following a forcing is restored by the prevalence of a higher temperature.”
Indeed, there is a growing body of papers in the peer-reviewed literature (see, for instance, Lindzen & Choi, 2009, 2011; Spencer & Braswell, 2010, 2011), whose authors, by a variety of methods, find temperature feedbacks net-negative, so that global warming cannot be much more than 1 Cº per CO2 doubling. Indeed, these two papers were among a dozen such papers referenced in our paper. From these considerations it may be deduced that Dr Perlwitz’s allegation that we had posited “intelligent design” as our reason for finding temperature feedbacks net-negative is false and without foundation.
Dr Perlwitz goes on to say we had made “claims” that complex models had “very much overstated global warming”, and that we had tried to substantiate this assertion with “merely a few graphics that are shown as supposed evidence”.
The truth: Our first graph compared the UN’s business-as-usual range of global-temperature predictions from its 1990 First Assessment Report and the observed temperature record since that date. The UN had predicted 0.7 to 1.5 Cº of global warming from 1990-2025: best estimate 1 Cº. However, the straight-line real-world warming trend is currently half the UN’s central prediction, and is visibly well below even the lower end of the UN’s range. The models had clearly “very much overstated global warming”. The graph is precisely plotted. The trend-line was calculated with a standard statistical formula, the least-squares linear-regression trend.
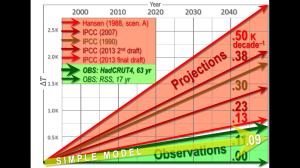
Even the IPCC realizes its models have been running hot, as our second graph shows. Between the first and fifth Assessment Reports, it has all but halved its predictions.
Dr Perlwitz said the models that made the predictions in the UN’s 1990 report were not as sophisticated as those of today, and that we should have allowed for that.
The truth: The UN’s panel should have allowed for that. Instead, its 1990 report said:
“… we have substantial confidence that models can predict at least the broad-scale features of climate change.”
It was on the basis of that “substantial confidence” that we were told the science was “settled”. Now that our devastating graphs have shown the UN’s models had failed and the science was self-evidently not settled, Dr Perlwitz says we cannot blame the UN because its models were too simple. The fact is that its climate panel should not have expressed “substantial” or any “confidence” in predictions made by models that it ought to have known were inadequate.
Dr Perlwitz said that in our graph comparing the UN’s predictions with observed reality we had “only selected the scenario with the strongest forcing (Scenario A)”. Scenario B, he said had come closer to what had happened in the real world.
The truth: We selected Scenario A because, though Dr Perlwitz somehow failed to make this clear, the UN’s climate panel had described scenario A, not scenario B, as its “business-as-usual” prediction.
Dr Perlwitz said that in another comparison of several models’ predictions with real-world warming we had used only Scenario A from James Hansen’s testimony to the US Congress in 1988.
The truth: Though Dr Perlwitz somehow failed to say so, Dr Hansen, in his testimony to the U.S. Senate in 1988, had said that Scenario A was his business-as-usual case.
Dr Perlwitz criticized us for using 63 years of terrestrial temperature measurements as a basis for projecting observed trends into the future.
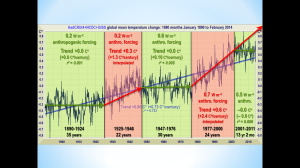
The truth: Global temperature follows an approximately 60-year natural cycle caused by what are known as the “ocean oscillations”, with approximately 30 years of warming followed by 30 years of cooling. Our 63-year period was thus approximately a full natural cycle. Why does this matter? The U.N.’s projections not only in 1990 but in subsequent Assessment Reports were based on the warming period of the ocean-oscillation cycle from 1976 to the turn of the millennium. That is why they were exaggerated and overshot so disastrously. Our use of the full cycle length was designed to avoid this problem and remove a well-known, major, naturally-occurring signal that might mask or distort the (probably small) contribution from Man.
Dr Perlwitz said we had compared satellite data for the region of the air just above the ground with data measured by thermometers at the surface. The two, he said, were too different,
The truth: Professor Allen had already trotted out this particular talking-point. In fact, the average of the two satellite datasets shows 0.34 Cº warming since 1990, while Professor Jones’ surface dataset shows 0.36 Cº, a difference of just one-fiftieth of a Celsius degree in 25 years between the surface and the air just above it.
Dr Perlwitz said we had only used one of the two satellite datasets.
The truth: our graph comparing the warming predicted by the UN’s climate panel in 1990 with the real-world warming measured by satellites is plainly and clearly labelled to show that we used the mean of the temperature measurements from the two satellite datasets – Remote Sensing Systems, Inc. (RSS), and the University of Alabama at Huntsville (UAH).
Dr Gavin Schmidt, director of NASA’s Goddard Institute for Space Studies, has now weighed in to say that our paper is “complete trash”. Yet Dr Perlwitz said it was “not new”.
The truth: One might infer from these two responses, taken together, that the pre-existing models are nonsense. But the truth is that Dr Schmidt is merely guilty of yah-boo – not, perhaps, an adult scientific response from one in his exalted position. Certainly Dr Schmidt has not provided any reasoning.
Dr Schmidt said we had “arbitrarily restricted” the parameters in our model and had then declared all other models wrong.
The truth: We had provided reasons for our choice of every parameter value we used. Nearly all of our parameter values were from standard climate modelling – including Dr Schmidt’s own model. And we had not declared all other models wrong, except to the extent that their predictions to date have proven exaggerated. We had said of the central equation in our model: “It is not, of course, intended to replace the far more complex general-circulation models: rather, it is intended to illuminate them.
Conclusion: the climate fraud will not cease till someone is prosecuted
In the corporate world, economies with the truth on the systematic and ruthless scale evident in the untruthful comments of the half-dozen “scientists” we have named and shamed here would be severely dealt with.
The crafty misrepresentations, the outright falsehoods, the artful misquotations and deliberately incomplete quotations, the unproven assertions, the readiness to criticize a paper that several of these creatures can be proven not to have read, the claims to knowledge they do not possess: these and multiple other instances of gross misconduct would not be tolerated outside the ivy-covered walls of academe.
These anti-scientists, these perpetrators who have gotten the facts so relentlessly and often deliberately wrong, must expect to raise a suspicion in some minds that they had misbehaved either for some political objective or for the sake of maintaining a profitable income-stream from the governments they have panicked, or both.
The cost of the climate fraud to taxpayers runs to the tens of billions a year. It is the biggest fraud in history. So far, the fraudsters have proven untouchable. The public authorities, even when confronted with the plainest of evidence, have carefully looked the other way.
It is not for us to say whether the “scientists” whose untruths we have exposed here were fools or knaves or both. We report: you decide. But allowing the UN to establish an unelected, unaccountable, all-powerful global climate tyranny at Paris this December on the basis of “science” as shoddy and unprincipled as this would be a costly and – as our peer-reviewed paper at www.scibull.com has definitively established – entirely unnecessary mistake.

