Special to Climate Depot
[Also see: It’s Official – There are now 66 excuses for Temp ‘pause’ – Updated list of 66 excuses for the 18-26 year ‘pause’ in global warming – Surface Data: 2014 Officially the ‘Warmest Year on Record’ & Climatologist Dr. Roy Spencer: ‘Why 2014 Won’t Be the Warmest Year on Record’ (based on surface data)– ‘We are arguing over the significance of hundredths of a degree’ – Physicist analyzes satellite temperature data: ‘Please laugh out loud when someone will be telling you that it was the warmest year’
For more explanation of how the ‘pause’ in global warming conflicts with the claims of 2014 being the ‘hottest year ever’ based on surface data, see related links below. ]
#
The Great Pause lengthens again
Global temperature update: the Pause is now 18 years 3 months
By Christopher Monckton of Brenchley
Since October 1996 there has been no global warming at all (Fig. 1). This month’s RSS [1] temperature plot pushes up the period without any global warming from 18 years 2 months to 18 years 3 months.
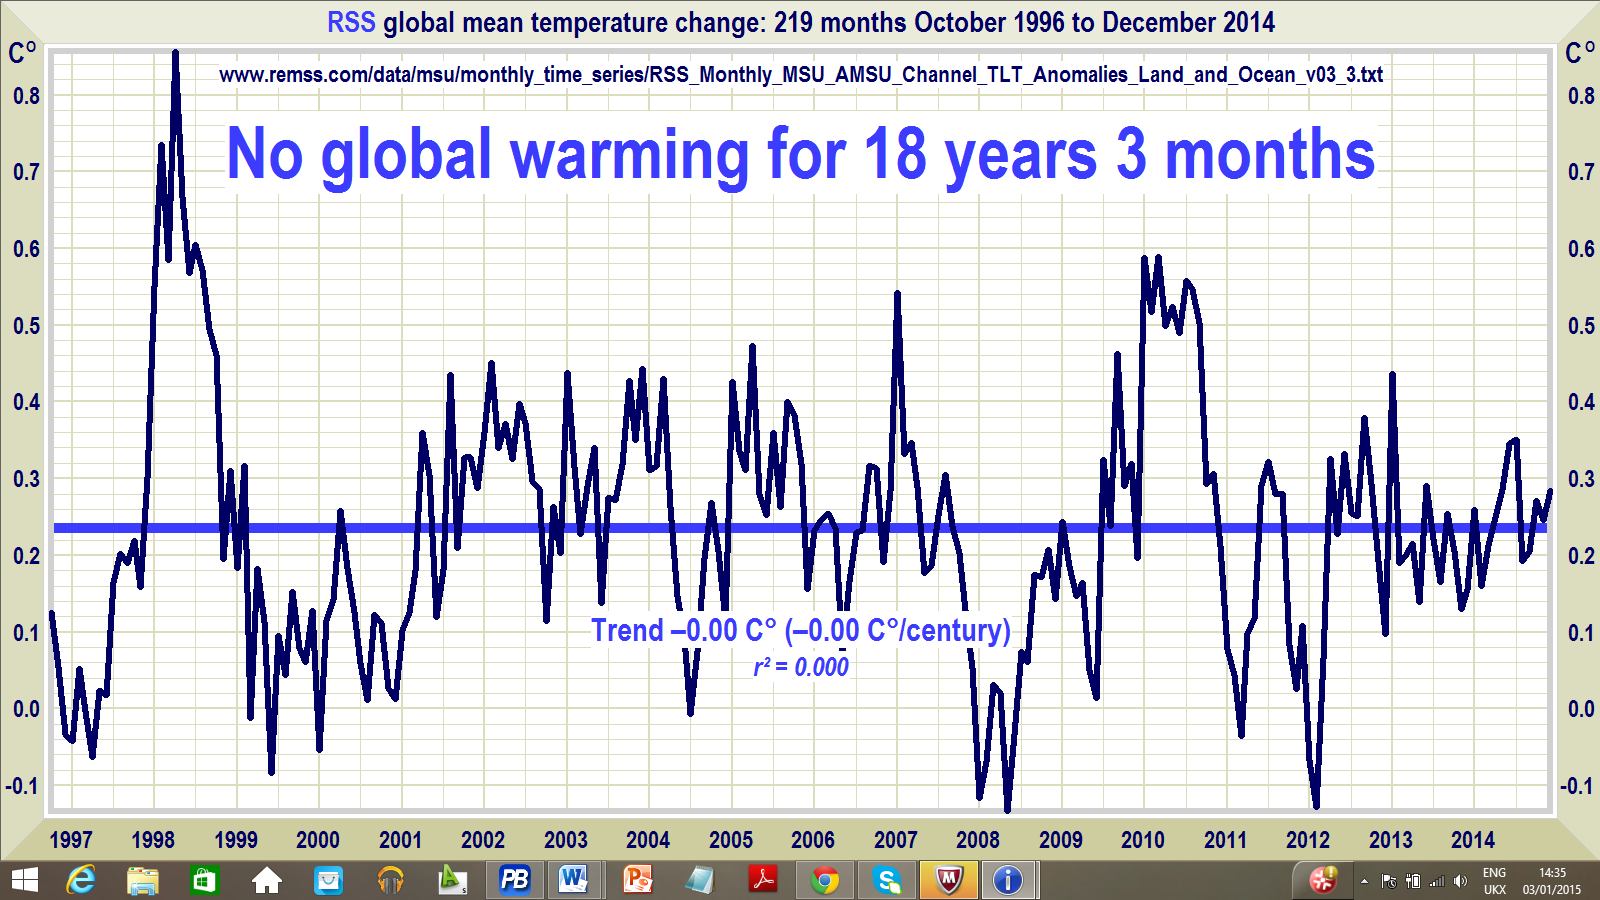
Figure 1. The least-squares linear-regression trend on the RSS satellite monthly global mean surface temperature anomaly dataset shows no global warming for 18 years 3 months since October 1996.
The hiatus period of 18 years 3 months, or 219 months, is the farthest back one can go in the RSS satellite temperature record and still show a sub-zero trend.
As the Pope unwisely prepares to abandon forever the political neutrality that his office enjoins upon him, and to put his signature to a climate-Communist encyclical largely drafted by the radical Prefect of the Pontifical Academy of Sciences, Mgr. Marcelo Sanchez Sorondo, the Almighty continues to display a sense of humor.
We are now less than a year away the Paris world-government conference. Yet the global warming that the IPCC had so confidently but misguidedly predicted 25 years ago has stopped altogether.
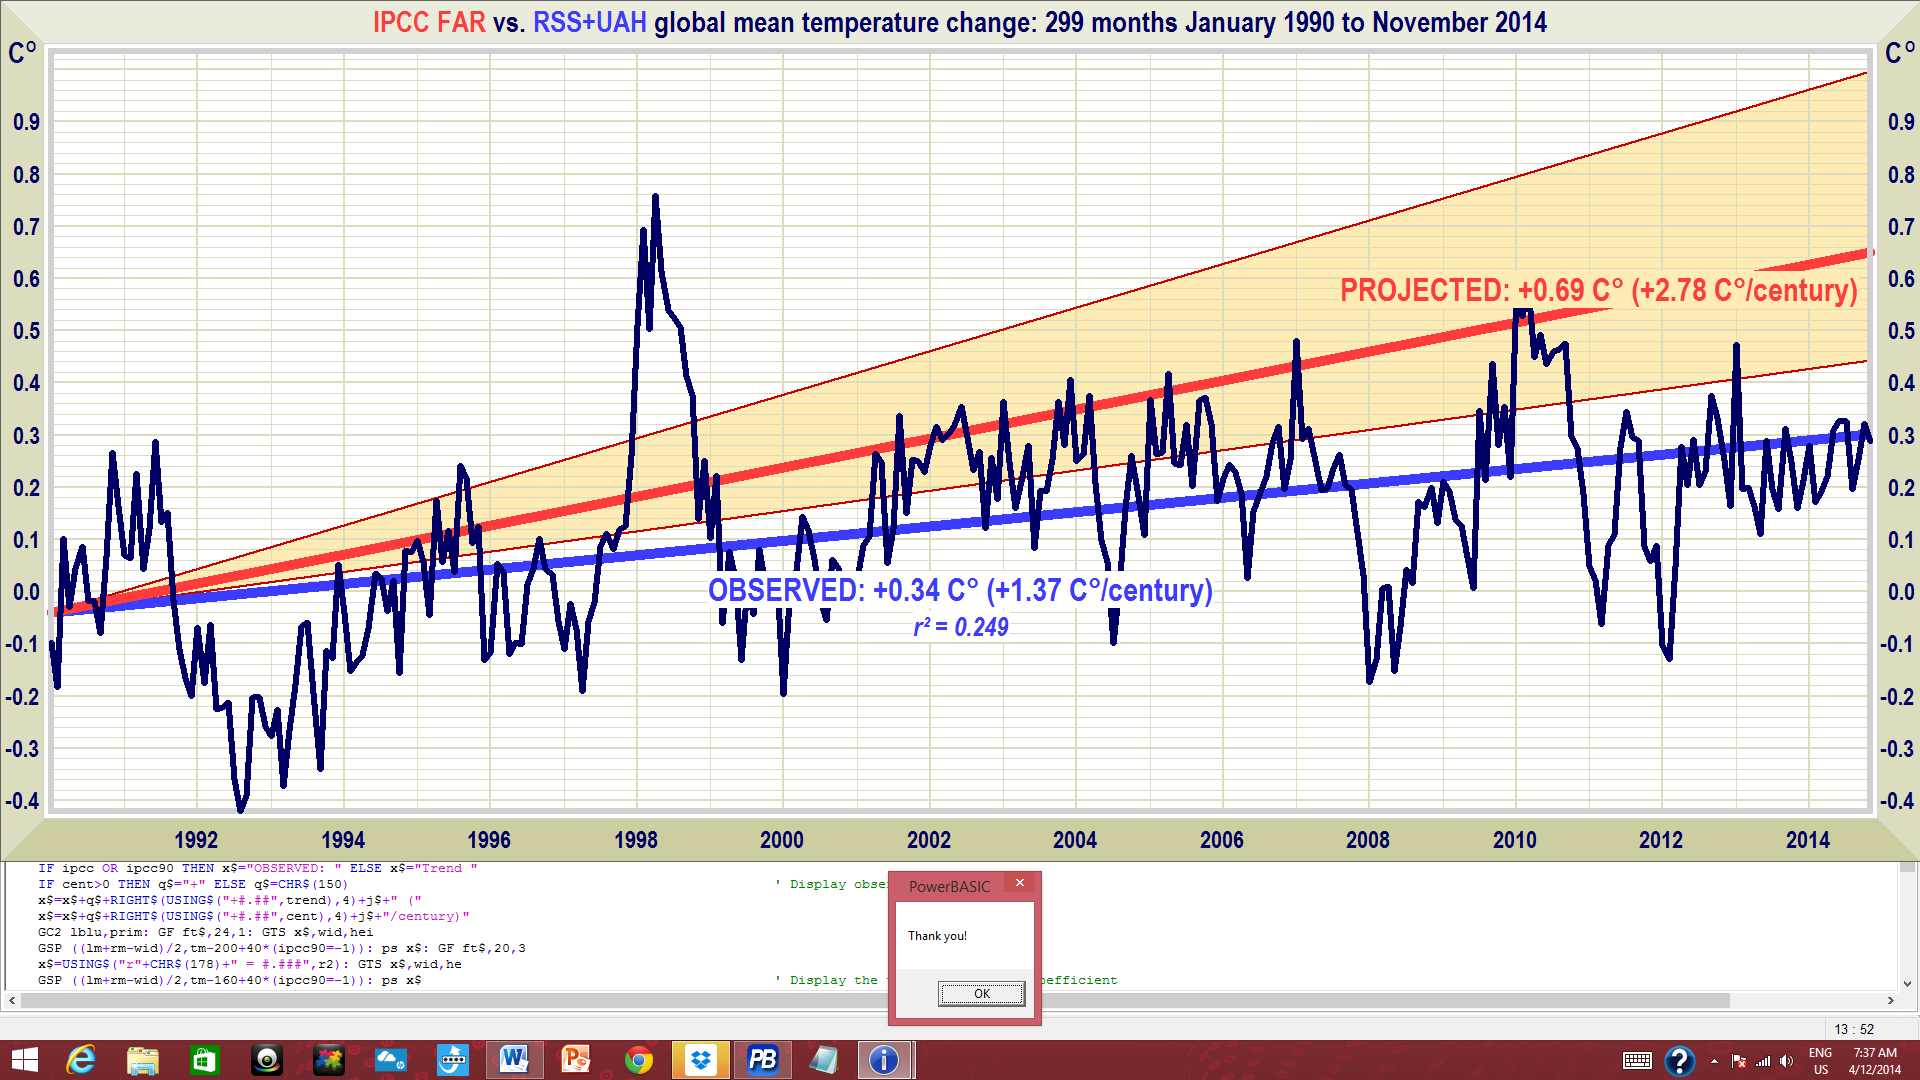
Figure 2. Near-term projections of warming at a rate equivalent to 2.8 [1.9, 4.2] K/century, made with “substantial confidence” in IPCC (1990), January 1990 to November 2014 (orange region and red trend line), vs. observed anomalies (dark blue) and trend (bright blue) at less than 1.4 K/century equivalent, taken as the mean of the RSS and UAH satellite monthly mean lower-troposphere temperature anomalies.
A quarter-century after 1990, the global-warming outturn to date – expressed as the least-squares linear-regression trend on the mean of the RSS [1] and UAH [2] monthly global mean surface temperature anomalies – is 0.34 Cº, equivalent to just 1.4 Cº/century, or a little below half of the central estimate in IPCC (1990) and well below even the least estimate (Fig. 2).
The Great Pause is a growing embarrassment to those who had told us with “substantial confidence” that the science was settled and the debate over. Nature had other ideas. Though approaching 70 mutually incompatible and more or less implausible excuses for the Pause are appearing in nervous reviewed journals and among proselytizing scientists, the possibility that the Pause is occurring because the computer models are simply wrong about the sensitivity of temperature to manmade greenhouse gases can no longer be dismissed, and is demonstrated in a major peer-reviewed paper published this month in the Orient’s leading science journal.
Remarkably, even the IPCC’s latest and much reduced near-term global-warming projections are also excessive (Fig. 3).
+++
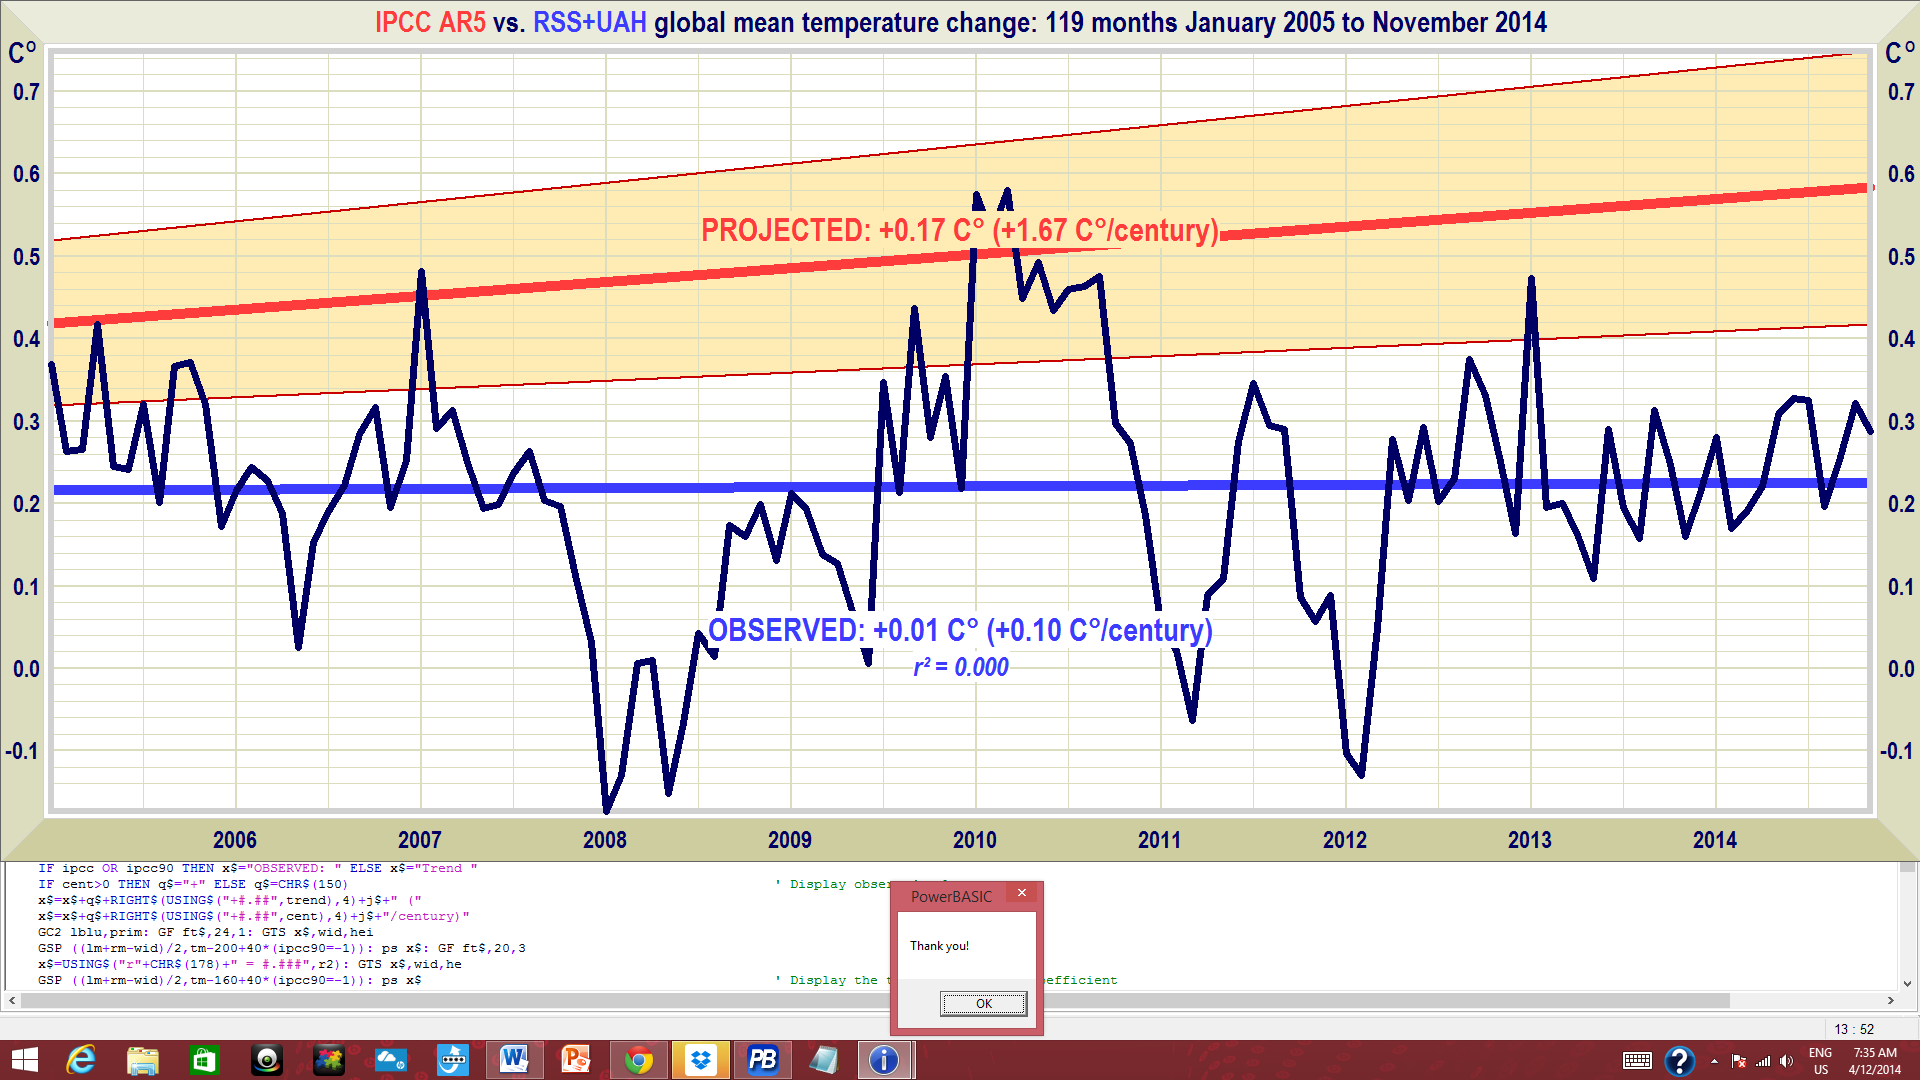
Figure 3. Predicted temperature change, January 2005 to November 2014, at a rate equivalent to 1.7 [1.0, 2.3] Cº/century (orange zone with thick red best-estimate trend line), compared with the observed anomalies (dark blue) and zero real-world trend (bright blue), taken as the average of the RSS and UAH satellite lower-troposphere temperature anomalies.
In 1990, the IPCC’s central estimate of near-term warming was higher by two-thirds than it is today. Then it was 2.8 C/century equivalent. Now it is just 1.7 Cº equivalent – and, as Fig. 3 shows, even that is proving to be a substantial exaggeration.
On the RSS satellite data, there has been no global warming statistically distinguishable from zero for more than 26 years. None of the models predicted that, in effect, there would be no global warming for a quarter of a century.
Key facts about global temperature
- The RSS satellite dataset shows no global warming at all for 219 months from October 1996 to December 2014 – more than half the 432-month satellite record.
- The global warming trend since 1900 is equivalent to 0.8 Cº per century. This is well within natural variability and may not have much to do with us.
- Since 1950, when a human influence on global temperature first became theoretically possible, the global warming trend has been equivalent to below 1.2 Cº per century.
- The fastest warming rate lasting ten years or more since 1950 occurred over the 33 years from 1974 to 2006. It was equivalent to 2.0 Cº per century.
- In 1990, the IPCC’s mid-range prediction of near-term warming was equivalent to 2.8 Cº per century, higher by two-thirds than its current prediction of 1.7 Cº/century.
- The global warming trend since 1990, when the IPCC wrote its first report, is equivalent to below 1.4 Cº per century – half of what the IPCC had then predicted.
- Though the IPCC has cut its near-term warming prediction, it has not cut its high-end business as usual centennial warming prediction of 4.8 Cº warming to 2100.
- The IPCC’s predicted 4.8 Cº warming by 2100 is well over twice the greatest rate of warming lasting more than ten years that has been measured since 1950.
- The IPCC’s 4.8 Cº-by-2100 prediction is almost four times the observed real-world warming trend since we might in theory have begun influencing it in 1950.
- From September 2001 to November 2014, the warming trend on the mean of the 5 global-temperature datasets is nil. No warming for 13 years 3 months.
- Recent extreme weather cannot be blamed on global warming, because there has not been any global warming. It is as simple as that.
Technical note
Our latest topical graph shows the least-squares linear-regression trend on the RSS satellite monthly global mean lower-troposphere dataset for as far back as it is possible to go and still find a zero trend. The start-date is not “cherry-picked” so as to coincide with the temperature spike caused by the 1998 el Niño. Instead, it is calculated so as to find the longest period with a zero trend.
But is the RSS satellite dataset “cherry-picked”? No. There are good reasons to consider it the best of the five principal global-temperature datasets. The indefatigable “Steven Goddard” demonstrated in the autumn of 2014 that the RSS dataset – at least as far as the Historical Climate Network is concerned – shows less warm bias than the GISS [3] or UAH [2] records. The UAH record is shortly to be revised to reduce its warm bias and bring it closer to conformity with RSS.

Figure 4. Warm biases in temperature. RSS shows less bias than the UAH or GISS records. UAH, in its forthcoming Version 6.0, will be taking steps to reduce the warm bias in its global-temperature reporting.
Steven Goddard writes: “The graph compares UAH, RSS and GISS US temperatures with the actual measured US HCN stations. UAH and GISS both have a huge warming bias, while RSS is close to the measured daily temperature data. The small difference between RSS and HCN is probably because my HCN calculations are not gridded. My conclusion is that RSS is the only credible data set, and all the others have a spurious warming bias.”
Also, the RSS data show the 1998 Great El Niño more clearly than all other datasets. The Great el Niño, like its two predecessors in the past 300 years, caused widespread global coral bleaching, providing an independent verification that RSS is better able to capture such fluctuations without artificially filtering them out than other datasets.
Terrestrial temperatures are measured by thermometers. Thermometers correctly sited in rural areas away from manmade heat sources show warming rates appreciably below those that are published. The satellite datasets are based on measurements made by the most accurate thermometers available – platinum resistance thermometers, which provide an independent verification of the temperature measurements by checking via spaceward mirrors the known temperature of the cosmic background radiation, which is 1% of the freezing point of water, or just 2.73 degrees above absolute zero. It was by measuring minuscule variations in the cosmic background radiation that the NASA anisotropy probe determined the age of the Universe: 13.82 billion years.
The RSS graph (Fig. 1) is accurate. The data are lifted monthly straight from the RSS website. A computer algorithm reads them down from the text file, takes their mean and plots them automatically using an advanced routine that automatically adjusts the aspect ratio of the data window at both axes so as to show the data at maximum scale, for clarity.
The latest monthly data point is visually inspected to ensure that it has been correctly positioned. The light blue trend line plotted across the dark blue spline-curve that shows the actual data is determined by the method of least-squares linear regression, which calculates the y-intercept and slope of the line via two well-established and functionally identical equations that are compared with one another to ensure no discrepancy between them. The IPCC and most other agencies use linear regression to determine global temperature trends. Professor Phil Jones of the University of East Anglia recommends it in one of the Climategate emails. The method is appropriate because global temperature records exhibit little auto-regression.
Dr Stephen Farish, Professor of Epidemiological Statistics at the University of Melbourne, kindly verified the reliability of the algorithm that determines the trend on the graph and the correlation coefficient, which is very low because, though the data are highly variable, the trend is flat.
RSS itself is now taking a serious interest in the length of the Great Pause. Dr Carl Mears, the senior research scientist at RSS, discusses it at remss.com/blog/recent-slowing-rise-global-temperatures.
Dr Mears’ results are summarized in Fig. 5:
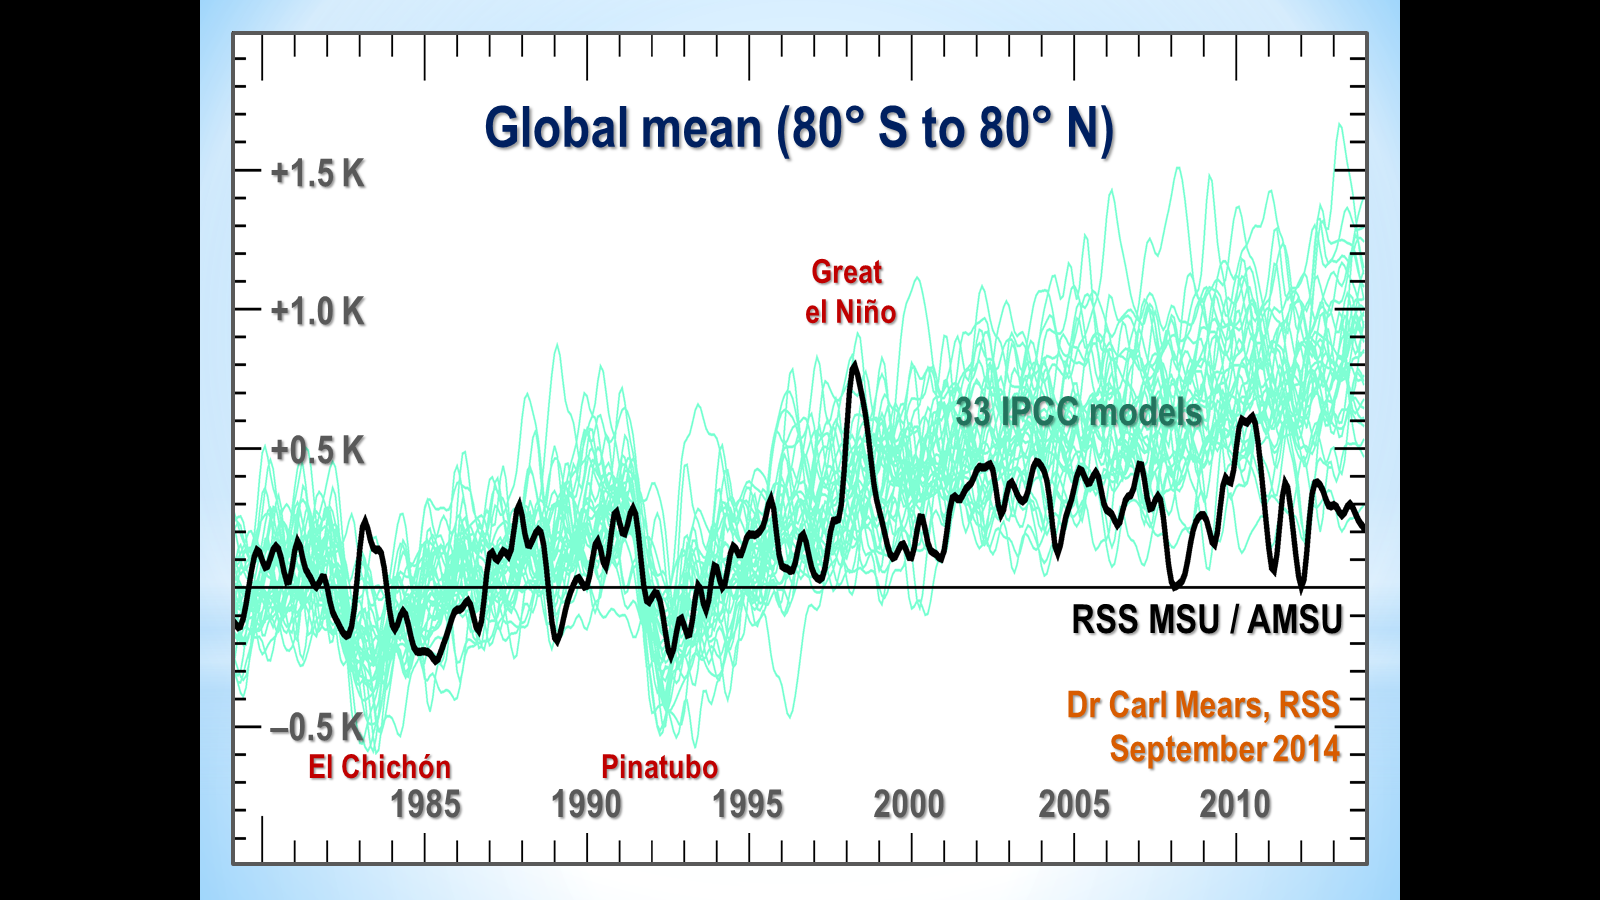
Figure 5. Output of 33 IPCC models (turquoise) compared with measured RSS global temperature change (black), 1979-2014. The transient coolings caused by the volcanic eruptions of Chichón (1983) and Pinatubo (1991) are shown, as is the spike in warming caused by the great el Niño of 1998.
Dr Mears writes:
“The denialists like to assume that the cause for the model/observation discrepancy is some kind of problem with the fundamental model physics, and they pooh-pooh any other sort of explanation. This leads them to conclude, very likely erroneously, that the long-term sensitivity of the climate is much less than is currently thought.”
Dr Mears concedes the growing discrepancy between the RSS data and the models, but he alleges “cherry-picking” of the start-date for the global-temperature graph:
“Recently, a number of articles in the mainstream press have pointed out that there appears to have been little or no change in globally averaged temperature over the last two decades. Because of this, we are getting a lot of questions along the lines of ‘I saw this plot on a denialist web site. Is this really your data?’ While some of these reports have ‘cherry-picked’ their end points to make their evidence seem even stronger, there is not much doubt that the rate of warming since the late 1990s is less than that predicted by most of the IPCC AR5 simulations of historical climate. … The denialists really like to fit trends starting in 1997, so that the huge 1997-98 ENSO event is at the start of their time series, resulting in a linear fit with the smallest possible slope.”
In fact, the spike in temperatures caused by the Great el Niño of 1998 is largely offset in the linear-trend calculation by two factors: the not dissimilar spike of the 2010 el Niño, and the sheer length of the Great Pause itself.
Replacing all the monthly RSS anomalies for 1998 with the mean anomaly value of 0.55 K that obtained during the 2010 el Niño and recalculating the trend from September 1996 [not Dr Mears’ “1997”] to September 2014 showed that the trend values “–0.00 C° (–0.00 C°/century)” in the unaltered data (Fig. 1) became “+0.00 C° (+0.00 C°/century)” in the recalculated graph. No cherry-picking, then.
The length of the Great Pause in global warming, significant though it now is, is of less importance than the ever-growing discrepancy between the temperature trends predicted by models and the far less exciting real-world temperature change that has been observed.
IPCC’s First Assessment Report predicted that global temperature would rise by 1.0 [0.7, 1.5] Cº to 2025, equivalent to 2.8 [1.9, 4.2] Cº per century. The executive summary asked, “How much confidence do we have in our predictions?” IPCC pointed out some uncertainties (clouds, oceans, etc.), but concluded:
“Nevertheless, … we have substantial confidence that models can predict at least the broad-scale features of climate change. … There are similarities between results from the coupled models using simple representations of the ocean and those using more sophisticated descriptions, and our understanding of such differences as do occur gives us some confidence in the results.”
That “substantial confidence” was substantial over-confidence. For the rate of global warming since 1990 is about half what the IPCC had then predicted.
Is the ocean warming?
One frequently-discussed explanation for the Great Pause is that the coupled ocean-atmosphere system has continued to accumulate heat at approximately the rate predicted by the models, but that in recent decades the heat has been removed from the atmosphere by the ocean and, since globally the near-surface strata show far less warming than the models had predicted, it is hypothesized that what is called the “missing heat” has traveled to the little-measured abyssal strata below 2000 m, whence it may emerge at some future date.
The ocean “missing heat” theory is chiefly advocated by a single group in the United States. Meehl, Arblaster, Fasullo, Hu and Trenberth [7] say, “Eight decades with a slightly negative global mean surface-temperature trend show that the ocean above 300 m takes up significantly less heat whereas the ocean below 300 m takes up significantly more, compared with non-hiatus decades. The model provides a plausible depiction of processes in the climate system causing the hiatus periods, and indicates that a hiatus period is a relatively common climate phenomenon and may be linked to La Niña-like conditions,” while Balmaseda, Trenberth and Källen [8] say, “In the last decade, about 30% of the warming has occurred below 700 m, contributing significantly to an acceleration of the warming trend. The warming below 700 m remains even when the Argo observing system is withdrawn although the trends are reduced,” and Trenberth & Fasullo [2013], repeated in Trenberth, Fasullo & Balmaseda [9], say, “An inventory of energy storage changes shows that over 90% of the imbalance is manifested as a rise in ocean heat content (OHC). … Global warming has not stopped: it is merely manifested in different ways.”
The U.S. group is supported by a group at the Chinese Academy of Sciences [10]: “A vacillating global heat sink at intermediate ocean depths is associated with different climate regimes of surface warming under anthropogenic forcing. The latter part of the 20th century saw rapid global warming as more heat stayed near the surface. In the 21st century, surface warming slowed as more heat moved into deeper oceans. … Cooling periods associated with the latter deeper heat-sequestration mechanism historically lasted 20 to 35 years.” In [11] the academicians speculate that at some future date the hiatus may change its sign, leading to a further episode of perhaps accelerated global warming.
Yet to date no empirical, theoretical or numerical method, complex or simple, has yet successfully specified mechanistically either how the heat generated by anthropogenic greenhouse-gas enrichment of the atmosphere has reached the deep ocean without much altering the heat content of the intervening near-surface strata or how the heat from the bottom of the ocean may eventually re-emerge to perturb the near-surface climate conditions that are relevant to land-based life on Earth.
Most ocean models used in performing coupled general-circulation model sensitivity runs simply cannot resolve most of the physical processes relevant for capturing heat uptake by the deep ocean. Ultimately, the second law of thermodynamics requires that any heat which may have accumulated in the deep ocean will dissipate via various diffusive processes. It is not plausible that any heat taken up by the deep ocean will suddenly warm the upper ocean and, via the upper ocean, the atmosphere.
Even if heat is reaching the benthic strata without warming the near-surface strata on the way, the transient near-surface response is rather insensitive to rising atmospheric CO2 concentration. For this reason, resolving ocean thermodynamics and circulation dynamics is not a prerequisite to the empirical study of climate sensitivity by way of our simple model. If the “deep heat” explanation for the hiatus in global warming is correct (and it is merely one among dozens that have been offered), then the complex models have failed to account for it correctly: otherwise, the growing discrepancy between the predicted and observed atmospheric warming rates would not have become as significant as it has.
Since the complex models have failed in this respect, and since there are insufficient deep-ocean observations to provide reliable quantitative evidence of the putative heat accumulation below 2000 m, still less to determine the mechanism of the imagined heat transfer, still less again to apportion duly the respective contributions of anthropogenic, solar and subsea volcanic influences on the benthic heat accumulation, it is surely unreasonable for our simple model to be expected to do what the complex models have self-evidently failed to do – and what cannot be done by any model, simple or complex, unless and until measurements of far higher resolution than is now to hand become available at all points of the oceanic column. For instance, the 3500 automated Argo bathythermograph buoys have a resolution equivalent to taking a single temperature and salinity profile in Lake Superior less than once a year: and before Argo came onstream in the middle of the last decade the resolution of oceanic temperature measurements was considerably poorer even than that, especially in the abyssal strata.
The mean depth of the global ocean is 3700 m. As recently observed in [11], implicitly questioning the U.S. group’s assertions in [7-9], the resolution of samples at various depths and the length of the record are both insufficient either to permit reliable measurement of ocean heat content or to permit monitoring of oceanic radiative fluxes:
“Some basic elements of the sampling problem are compiled in Table 2. About 52% of the ocean lies below 2000 m and about 18% below 3600 m. By defining a volume as having been ‘probed’ if at least one CTD station existed within a roughly 60 x 60 km2 box in the interval 1992-2011 … [a]bout 1/3 (11% of total volume) of water below 2000 m was sampled … Of the [region] lying below 3600 m, about 17% was measured. … [M]any papers assume no significant changes take place in the deep ocean over the historical period … The history of exploration suggests, however, that blank places on the map have either been assumed to be without any interesting features and dropped from further discussion, or at the other extreme, filled with ‘dragons’ invoked to explain strange reports [in G. de Jode, 1578, Speculum Orbis Terrarum, Antwerp]. …
“[R]ecently, [60] offered estimates of abyssal changes with claimed accuracies of order of 0.01 W/m2 (0.0004°C temperature change equivalent over 20 years) below 700 m. If that accuracy has in fact been obtained, the sparse coverage, perhaps extended to the scope of WOCE hydrographic survey, repeated every few decades, would be sufficient.”
Furthermore, almost all current analyses of ocean heat content and budget lack an accurate accounting of spatial, temporal and other systematic errors and uncertainties such as those identified in recent works by a group at the Chinese Academy of Sciences [12]:
“In this study, a new source of uncertainties in calculating OHC due to the insufficiency of vertical resolution in historical ocean subsurface temperature profile observations was diagnosed. This error was examined by sampling a high-vertical-resolution climatological ocean according to the depth intervals of in situ subsurface observations, and then the error was defined as the difference between the OHC calculated by subsampled profiles and the OHC of the climatological ocean. The obtained resolution-induced error appeared to be cold in the upper 100 m (with a peak of approximately −0.1°C), warm within 100–700 m (with a peak of ~0.1°C near 180 m), and warm when averaged over 0–700-m depths (with a global average of ~0.01°–0.025°C, ~1–2.5 × 10²² J). Geographically, it showed a warm bias within 30°S–30°N and a cold bias at higher latitudes in both hemispheres, the sign of which depended on the concave or convex shape of the vertical temperature profiles. Finally, the authors recommend maintaining an unbiased observation system in the future: a minimal vertical depth bin of 5% of the depth was needed to reduce the vertical-resolution-induced bias to less than 0.005°C on global average (equal to Argo accuracy).”
Again [13]:
“… a new correction scheme for historical XBT data is proposed for nine independent probe-type groups. The scheme includes corrections for both temperature and depth records, which are all variable with calendar year, water temperature, and probe type. The results confirm those found in previous studies: a slowing in fall rate during the 1970s and 2000s and the large pure thermal biases during 1970–85. The performance of nine different correction schemes is compared. After the proposed corrections are applied to the XBT data in the WOD09 dataset, global ocean heat content from 1967 to 2010 is reestimated.”
A forthcoming paper [14], after properly accounting for some of the sampling biases and instrumental errors and uncertainties in the ocean heat content data (i.e., applying the new global ocean temperature dataset from the Institute of Atmospheric Physics), describes a vertical profile of ocean temperature change from 2004-2013, reporting a warming hiatus above 100 m depth and from 300-700 m. The two layers that show warming are 100-300 m and 700-1500 m. These warming strata show their own distinctive horizontal spatial patterns when compared to the non-warming stratum at 300-700 meters. This observational fact leads to the following conclusion:
“It is still unclear how the heat is transferring to the deeper ocean.”
Furthermore, the suggestion that heat accumulation in the deep ocean explains why there has been no global warming at all for up to 18 years is far from generally accepted in the scientific literature. A remarkable variety of competing and often mutually exclusive explanations for the hiatus in global warming, chiefly involving near-surface phenomena, are offered in recent papers in the reviewed journals of climate science.
In the literature, the cause of the hiatus in global warming is variously attributed to (1) coverage-induced cool bias in recent years [15], rebutted by [16] and, with respect to Arctic coverage, by [17]; (2) anthropogenic aerosols from coal-burning [18], rebutted by [19-20]; (3) decline in the warming caused by black-carbon absorption [20]; (4) emission of aerosol particulates by volcanic eruptions [21], rebutted by [22]; (5) reduced solar activity [23]; (6) effectiveness of the Montreal Protocol in controlling emissions of chlorofluorocarbons [24]; (7) a lower-than-predicted increase in methane concentration [24]; (8) a decrease in stratospheric water vapor concentration [25]; (9) strengthened Pacific trade winds [26] (previously, [27] had attributed weaker Pacific trade winds to anthropogenic global warming); (10) stadium waves in tropical Pacific circulation [28]; (11) coincidence [29]; (12) aerosol particulates from pine-trees [30]; (13) natural variability [31-32]; (14) cooler night-time temperatures in the Northern Hemisphere [33]; (15) predictions by those models that allowed for the possibility of a pause in global warming [34-35]; (16) the negative phase of the Pacific Decadal Oscillation [36-38]; (17) the Atlantic meridional overturning circulation [39]; (18) global dimming following the global brightening of 1983-2001 [40]; (19) relative frequencies of distinct el Niño types [41]; (20) surface cooling in the equatorial Pacific [42]; (21) Pacific cooling amplified by Atlantic warming [43]; (22) a combination of factors, including ENSO variability, solar decline and stratospheric aerosols [44]; (23) underestimated anthropogenic aerosol forcing [45]; (24) a new form of multidecadal variability distinct from but related to the ocean oscillations [46]; and (25) failure to initialize most models in order to conform with observation, particularly of oceanic conditions [47].
Finally, though the ARGO buoys measure ocean temperature change directly, before publication the temperature change is converted into zettajoules of ocean heat content change, which make the change seem larger. Converting the ocean heat content change back to temperature change is highly revealing. It shows how little change has really been measured. The increase in ocean heat content over the 94 ARGO months September 2005 to June 2013 was 10 x 1022 J = 100 ZJ (Fig. 6).
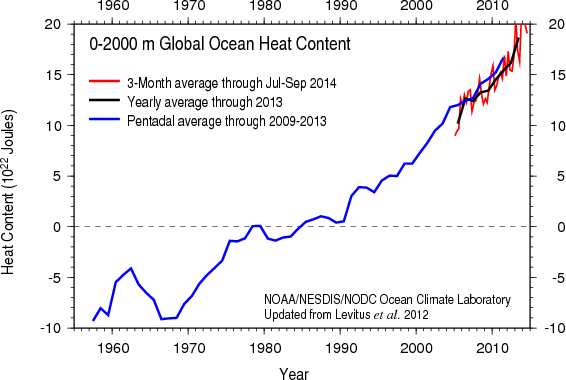
Figure 6. Ocean heat content change, 1957-2013, from NODC Ocean Climate Laboratory: http://www.nodc.noaa.gov/OC5/3M_HEAT_CONTENT.
Conversion: 650 million km3 x 4 MJ per tonne per Kelvin: each cubic meter is 1.033 tonnes. Then:
100 ZJ increase in ohc 100,000,000,000,000,000,000,000 J
To raise 650,000,000,000,000,000 m3
x 1.033 te m–3 671,450,000,000,000,000 te
x 4,000,000 J te 2,685,800,000,000,000,000,000,000 J per Kelvin
Then 100,000 / 2,685,800 = 0.037233 K in 94 months is equivalent to 0.0475 K per decade. Accordingly, even on the quite extreme NODC ocean heat content record, the change in mean ocean temperature in the upper 2000 m in recent decades has been less than 0.5 K per century equivalent.
References
- RSS (2014) Satellite-derived monthly global mean lower-troposphere temperature anomaly dataset: www.remss.com/data/msu/monthly_time_series/RSS_Monthly_MSU_AMSU_Channel_TLT_Anomalies_Land_and_Ocean_v03_3.txt. Accessed 1 July 2014
- UAH (University of Alabama at Huntsville) (2014) Satellite MSU monthly global mean lower-troposphere temperature anomalies. http://vortex.nsstc.uah.edu/data/msu/t2lt/uahncdc_lt_5.6.txt. Accessed 1 July 2014
- NCDC, 2014, National Climatic Data Center monthly global mean land and ocean surface temperature anomalies, 1880-2013,ftp://ftp.ncdc.noaa.gov/pub/data/anomalies/monthly.land_ocean.90S.90N.df_1901-2000mean.dat. Accessed 1 July 2014
- Morice, CP, Kennedy JJ, Rayner N, Jones PD (2012) Quantifying uncertainties in global and regional temperature change using an ensemble of observational estimates: The HadCRUT4 data set. J. Geophys Res 117:D08101. doi:10.1029/2011JD017187
- GISS, 2014, Goddard Institute for Space Studies monthly global mean land and sea surface temperature anomalies, 1880-2014, http://data.giss.nasa.gov/gistemp/tabledata_v3/GLB.Ts+dSST.txt. Accessed 1 July 2014
- McKitrick RR (2014) HAC-robust measurement of the duration of a trendless subsample in a global climate time series. Open J Stat 4:527-535
- Meehl GA, Arblaster JM, Fasullo JT et al (2011) Model-based evidence of deep-ocean heat uptake during surface-temperature hiatus periods. Nat Clim Change 1: 360–364
- Balmaseda MA, Trenberth KE, Källen E (2013) Distinctive climate signals in reanalysis of global ocean heat content. Geophys Res Lett 40:175401759
- Trenberth KE, Fasullo JT, Balmaseda MA (2014) Earth’s energy imbalance. J Clim 27:3129-3144
- Chen X, Tung KK (2014) Varying planetary heat sink led to global-warming slowdown and acceleration. Science 345: 897–903
- Wunsch C, Heimbach P (2014) Bidecadal thermal changes in the abyssal ocean. J Phys Oceanol 44: 2013–2030
- Cheng L, Zhu J (2014) Uncertainties of the ocean heat content estimation induced by insufficient vertical resolution of historical ocean subsurface observations. J Atm Oceanic Tech 31: 1383–1396
- Cheng L, Zhu J, Cowley R et al (2014a) Time, probe type, and temperature variable bias corrections to historical expendable bathythermograph observations. J Atm Oceanic Tech 31: 1793–1825
- Cheng L, Zheng F, Zhu J (2014b) Distinctive ocean interior changes during the recent climate hiatus. Geophys Res Lett submitted
- Cowtan K, Way RG (2014) Coverage bias in the HadCRUT4 temperature series and its impact on recent temperature trends. Quart J R Meteot Soc 140: 1934-1944
- Fyfe JC, Gillet NP, Zwiers FW (2013) Overestimated global warming over the past 20 years. Nat Clim Change 3: 767-769
- Chung CE, Cha H, Vilma T et al (2013) On the possibilities to use atmospheric reanalyses to evaluate the warming structure of the Arctic. Atmos Chem Phys 13: 11209-11219
- Kaufmann RK, Kauppi H, Stock JH (2011) Reconciling anthropogenic climate change with observed temperature 1998-2008. Proc Natl Acad Sci USA 108: 11790-11793
- Kühn T, Partanen A-I, Laakso A et al(2014) Climate impacts of changing aerosol emissions since 1996. Geophys ResLett 41: 4711-4718
- Neely RR, Toon OB, Solomon S et al(2013) Recent anthropogenic increases in SO2 from Asia have minimal impact on stratospheric aerosol. Geophys Res Lett 40. doi: 10.1002/grl.50263
- Santer BD, Bonfils C, Painter JF et al (2014) Volcanic contribution to decadal changes in tropospheric temperature. Nat Geosci 7:185-189
- Haywood J, Jones A, Jones GS (2014) The impact of volcanic eruptions in the period 2000-2013 on global mean temperature trends evaluated in the HadGEM2-ES climate model. Atmos Sci Lett 15: 92-96
- Stauning P (2014) Reduced solar activity disguises global temperature rise, Atmos Clim Sci 4: 60-63
- Estrada F, Perron P, Martinez-Lopez B (2013) Statistically derived contributions of diverse human influences to twentieth-century temperature changes. Nat Geosci 6: 1050–1055
- Solomon S, Rosenlof KH, Portmann RW et al(2010) Contributions of stratospheric water vapor to decadal changes of global warming. Science 327: 1219-1223
- England MH, McGregor S, Spence P et al (2014) Recent intensification of wind-driven circulation in the Pacific and the ongoing warming hiatus. Nat Clim Change 4: 222-227
- Vecchi ga, Soden BJ, Wittenberg AT, et al (2006) Weakening of tropical Pacific atmospheric circulation due to anthropogenic forcing. Nature 441: 73-76.
- Glaze Wyatt M, Curry JA (2013) Role for Eurasian Arctic shelf sea ice in a secularly varying hemispheric climate signal during the 20th century. Clim Dyn 42: 2763-2782
- Schmidt GA, Shindell DT, Tsigaridis K (2014) Reconciling warming trends. Nat Geosci 7(158-160). doi: 10.1038/ngeo2105
- Ehn M, Thornton JA, Kleist E, et al (2014) A large source of low-volatility secondary organic aerosol. Nature 506:476-479
- Watanabe M, Shiogama H, Tatebe H et al (2014) Contribution of natural decadal variability to global warming acceleration and hiatus. Nat Clim Change 4: 893–897
- Lovejoy S (2014) Return periods of global climate fluctuations and the pause. Geophys Res Lett 41:4704-47
- Sillmann, J, Donat MG, Fyfe JC et al (2014) Observed and simulated temperature extremes during the recent warming. Environ Res Lett 9. doi: 10.1088/1748-9326/9/6/064023
- Risbey J, Lewandowsky S, Langlais C,et al (2014) Nat Clim Change 4:835-840
- Guemas V, Doblas-Reyes FJ, Andreu-Burillo I et al (2013) Retrospective prediction of the global warming slowdown in the past decade. Nat Clim Change 3:649-653
- Maher N, Sen Gupta A, England MH (2014) Drivers of decadal hiatus periods in the 20th and 21st centuries. Geophys Res Lett 41:5978-5986
- Trenberth KE, Fasullo JT, Branstator G et al (2014) Seasonal aspects of the recent pause in surface warming. Nat Clim Change 4: 911–916
- Dong L, Zhou T (2014) The formation of the recent cooling in the eastern tropical Pacific Ocean and the associated climate impacts: a competition of global warming, IPO and AMO. J Geophys Res doi: 10.1002/2013JD021395
- Schleussner CF, Runge J, Lehmann J, et al (2014) The role of the North Atlantic overturning and deep ocean for multi-decadal global-mean-temperature variability. Earth Sys Dyn 5:103-115
- Rahimzadeh F, Sanchez-Lorenzo A, Hamedi M, et al (2014) New evidence on the dimming/brightening phenomenon and decreasing diurnal temperature range in Iran (1961-2009). Int J Climatol doi: 10.1002/joc.4107
- Banholzer S, Donner S (2014) The influence of different El Nino types on global average temperature. Geophys Res Lett 41:2093–2099
- Kosaka Y, Xie SP (2013) Recent global-warming hiatus tied to equatorial Pacific surface cooling. Nature 501: 403–40
- McGregor S, Timmermann A, Stuecker MF, England MH, Merrifield M, Jin FF, Chikamoto Y (2014) Recent Walker circulation strengthening and Pacific cooling amplified by Atlantic warming. Nature Clim. Change 4:888-892. doi: 10.1039/nclimate2330
- Huber M, Knutti R (2014) Natural variability, radiative forcing and climate response in the recent hiatus reconciled. Nat Geosci 7: 651–656
- Hansen J, Sato M, Kharecha PK, et al(2011) Earth’s energy imbalance and implications. Atmos. Chem Phys 11:13421-13449.
- Maclas D, Stips A, Garcia-Gorriz E (2014) Application of the Singular Spectrum Analysis Technique to Study the Hiatus on the Global Surface Temperature Record. Plos One. doi: 10.1371/journal.pone.0107222
- Meehl, GA, Teng H (2014) CMIP5 multi-model hindcasts for the mid-1970s shift and early 200s hiatus and predictions for 2016-2035. Geophys. Res. Lett. 41(5):17y11-1716
#
Related Links:
Eco-Activists Warn 2014 Could Be Hottest Year On Record – Satellites Disagree
Even ignoring satellite data Year-to-date ‘record’ temps are 0.21C *below* climate model projections
2014 might be 0.01C warmer than 2010!
No Record Temperatures According To Satellites – BBC put up a deliberately apocalyptic picture while telling us the world is on course for the warmest year on record. What they failed to tell us was that the more accurate satellites, which monitor atmospheric temperatures over nearly all of the globe, say no such thing. Figures from UAH are out for November, and these show a drop from the October anomaly of 0.27C to 0.33C. This means that at the end of November, this year is only in a tie for 3rd with 2005, and well below the record year of 1998, and 2010.
Study using dozens of models Claims: ‘Warming Climate Can Be Slowed in a Decade’ by cutting CO2
Climate Depot Note: If future temps continue to flatline or even cool, warmists can claim climate policy is responsible. They are already doing it! See: It’s Official — Temperature ‘Pause’ Caused By Climate Policies?! Medieval witchcraft lives! UK Energy Minister: Government policies ‘may have slowed down global warming’
Climate Depot’s Morano comment: ‘AP’s Borenstein can be trusted to shill for UN’s climate summit in Lima Peru, which I will be attending and speaking at. Borenstein relies on Michael Oppenheimer (who is the UN scientists on the payroll of Hollywood stars) and Climategate’s Michael Mann. Borenstein ignores tide gauges on sea level showing deceleration of sea level rise and ignores satellite temperatures which show the Earth in an 18 year ‘pause’ or ‘standstill’ of global warming. Borenstein tortures data in order to claim more weather extremes. We are currently at or near historic lows in tornadoes and hurricanes. Even droughts are on long term declines and floods show no trend. We know not to expect more from Borenstein.’ See: ‘Long sad history of AP reporter Seth Borenstein’s woeful global warming reporting’
Sea level claims debunked here:
Extreme weather claims debunked here:
Greenland ice claims debunked here:
Antarctica ice claims debunked here:
Overpopulation claims debunked here:
Analysis: Why ’90% of the missing heat’ cannot be hiding in the oceans