Special to Climate Depot
By Christopher Monckton of Brenchley,
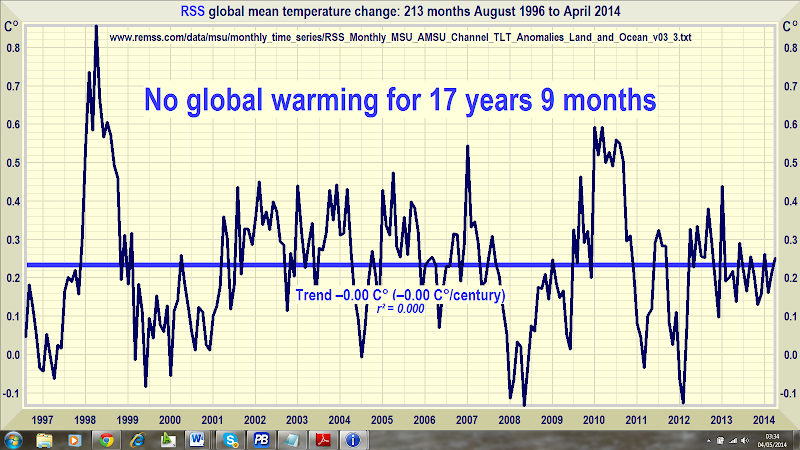
According to the RSS satellite data, whose value for April 2014 is just in, the global warming trend in the 17 years 9 months since August 1996 is zero. The 212 months without global warming represents more than half the 423-month satellite data record, which began in January 1979. No one now in high school has lived through global warming.
The long Pause may well come to an end by this winter, when an el Niño event is expected in the equatorial eastern Pacific, causing global temperature to rise quite sharply. The el Niños of 1998, 2007, and 2010 are visible in the graph. El Niños occur about every three or four years, though no one is entirely sure what triggers them. They cause a temporary spike in temperature, often followed by a sharp drop during the la Niña phase, as can be seen in 1999, 2008, and 2011-2012, where there was a “double-dip” la Niña.
The ratio of el Niños to la Niñas tends to fall during the 30-year negative or cooling phases of the Pacific Decadal Oscillation, the latest of which began in late 2001. So, though the Pause may pause for a few months at the turn of the year, it may well resume late in 2015.
Either way, it is ever clearer that global warming has not been happening at anything like the rate predicted by the climate models, and is not at all likely to occur even at the much-reduced rate now predicted. There could be as little as 1 Cº global warming this century, not the 3-4 Cº predicted by the IPCC.
Key facts about global temperature:
- The RSS satellite dataset shows no global warming at all for 213 months from August 1996 to April 2014. That is more than half the entire 423-month satellite record.
- The fastest centennial warming rate was in Central England from 1663-1762, at 0.9 Cº per century – before the industrial revolution began. It cannot have been our fault.
- The global warming trend since 1900 is equivalent to 0.8 Cº per century. This is well within natural variability and may not have much to do with us.
- The fastest warming trend lasting ten years or more occurred over the 40 years from 1694-1733 in Central England. It was equivalent to 4.3 Cº per century.
- Since 1950, when a human influence on global temperature first became theoretically possible, the global warming trend is equivalent to 1.2 Cº per century.
- The fastest warming rate lasting ten years or more since 1950 occurred over the 33 years from 1974 to 2006. It was equivalent to 2.0 Cº per century.
- In 1990, the IPCC’s mid-range prediction of the near-term warming trend was equivalent to 3.5 Cº per century.
- The global warming trend since 1990, when the IPCC wrote its first report, is equivalent to 1.4 Cº per century – two-fifths of what the IPCC had then predicted.
- In 2013 the IPCC’s new mid-range prediction of the near-term warming trend was for warming at a rate equivalent to 1.7 Cº per century – just half its 1990 prediction.
- Though the IPCC has cut its near-term warming prediction, it has not cut its centennial warming prediction of 3.7 Cº warming to 2100 on business as usual.
- The IPCC’s prediction of 3.7 Cº warming by 2100 is more than twice the greatest rate of warming lasting more than ten years that has been measured since 1950.
- The IPCC’s 3.7 Cº-by-2100 prediction is more than three times the observed real-world warming trend since we might in theory have begun influencing it in 1950.
- Since 1 January 2001, the dawn of the new millennium, the warming trend on the dataset of five major datasets is zero – 0.0 Cº per century. No warming for 13 years 3 months.
- Recent extreme weather cannot be blamed on global warming, because there has not been any global warming. It is as simple as that.
Technical note:
Our latest topical graph shows the RSS dataset for the 212 months August 1996 to April 2014 – more than half the 423-months satellite record.
Terrestrial temperatures are measured by thermometers. Thermometers correctly sited in rural areas away from manmade heat sources show warming rates appreciably below those that are published. The satellite datasets are based on measurements made by the most accurate thermometers available – platinum resistance thermometers, which not only measure temperature at various altitudes above the Earth’s surface via microwave sounding units but also constantly calibrate themselves by measuring via spaceward mirrors the known temperature of the cosmic background radiation, which is 1% of the freezing point of water, or just 2.73 degrees above absolute zero. It was by measuring minuscule variations in the cosmic background radiation that the NASA anisotropy probe determined the age of the Universe: 13.82 billion years.
The graph is accurate. The data are lifted monthly straight from the RSS website. A computer algorithm reads them down from the text file, takes their mean and plots them automatically using an advanced routine that automatically adjusts the aspect ratio of the data window at both axes so as to show the data at maximum scale, for clarity.
The latest monthly data point is visually inspected to ensure that it has been correctly positioned. The light blue trend line plotted across the dark blue spline-curve that shows the actual data is determined by the method of least-squares linear regression, which calculates the y-intercept and slope of the line via two well-established and functionally identical equations that are compared with one another to ensure no discrepancy between them. The IPCC and most other agencies use linear regression to determine global temperature trends. Interestingly, Professor Phil Jones of the University of East Anglia recommends it in one of the Climategate emails.
Dr Stephen Farish, Professor of Epidemiological Statistics at the University of Melbourne, kindly verified the reliability of the algorithm that determines the trend on the graph and the correlation coefficient, which is very low because the data are highly variable and the trend is flat.
Related Links:
Climate Depot Analysis: ‘There have been at least nine ten separate explanations for the standstill in global warming’ – 1) Low Solar Activity; 2) Oceans Ate Warming; 3) Chinese Coal Use; 4) Montreal Protocol; 5) Readjusted past temps to claim ‘pause’ never existed 6) Volcanoes 7) Decline in Water Vapor 8) Pacific Trade Winds 9) ’Stadium Waves’ 10) ‘Coincidence’
Sea level rise slows while satellite temperature ‘pause’ dominates measurement record
Antarctic Sea Ice Expands To New Records – Approaching The Largest Anomaly Ever Recorded
The global warming movement continues to lose scientists, many formerly with the UN IPCC.
Top Swedish Climate Scientist Says Warming Not Noticeable: ‘The warming we have had last a 100 years is so small that if we didn’t have climatologists to measure it we wouldn’t have noticed it at all’ – Award-Winning Dr. Lennart Bengtsson, formerly of UN IPCC: ‘We Are Creating Great Anxiety Without It Being Justified’
UN Scientists Who Have Turned on the UN IPCC & Man-Made Climate Fears — A Climate Depot Flashback Report – Warming fears are the “worst scientific scandal in the history…When people come to know what the truth is, they will feel deceived by science and scientists.” – UN IPCC Japanese Scientist Dr. Kiminori Itoh, an award-winning PhD environmental physical chemist.
‘Some of the most formidable opponents of climate hysteria include politically liberal physics Nobel laureate, Ivar Giaever; Freeman Dyson; father of the Gaia Hypothesis, James Lovelock — ‘Left-center chemist, Fritz Vahrenholt, one of the fathers of the German environmental movement’