By Christopher Monckton of Brenchley — Special to Climate Depot
Global Temperature Update
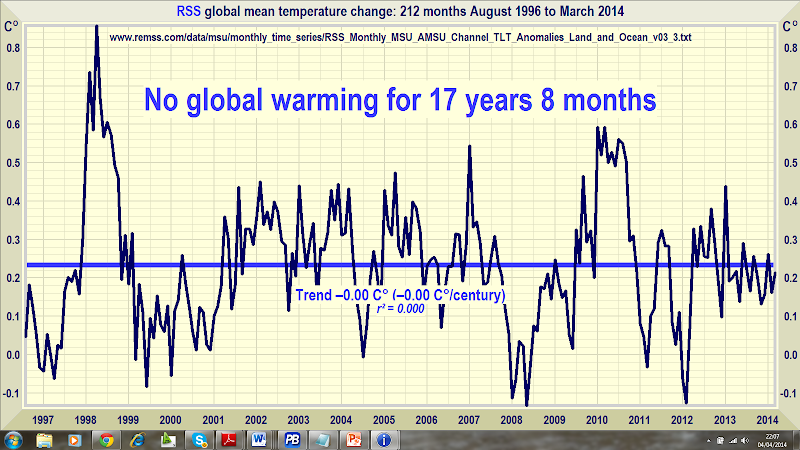
No global warming at all for 17 years 8 months
Global warming? What global warming? According to the RSS satellite data, whose value for March 2014 is just in, the global warming trend in the 17 years 8 months since August 1996 is zero. The 212 months without global warming represents just over half the 423-month satellite data record, which began in January 1979.
Dataset of datasets. The mean of the GISS, HadCRUt4, NCDC, RSS, and UAH monthly global mean surface or lower-troposphere temperature anomalies shows no global warming statistically distinguishable from zero over the 18 full years from March 1996 to February 2014. The 0.14 Cº trend over the 18-year period is within the ±0.15 Cº combined measurement, coverage, and bias uncertainties in the datasets. There may have been no global warming at all during the entire lifetimes of all students now in high school. Not that their teachers will have told them that.
The 18-year and centennial-equivalent warming trends on each of the five key datasets are:
|
Dataset |
18 years |
100 years |
|
GISS |
0.18 Cº |
0.98 Cº |
|
HadCRUT4 |
0.14 Cº |
0.80 Cº |
|
NCDC |
0.14 Cº |
0.75 Cº |
|
RSS satellite |
0.03 Cº |
0.16 Cº |
|
UAH satellite |
0.21 Cº |
1.17 Cº |
|
3 terrestrial |
0.15 Cº |
0.85 Cº |
|
2 satellite |
0.12 Cº |
0.66 Cº |
|
All 5 datasets |
0.14 Cº |
0.77 Cº |
Key facts about global temperature
- The RSS satellite dataset shows no global warming at all for 212 months from August 19996 to March 2014. That is just over half the entire 423-month satellite record.
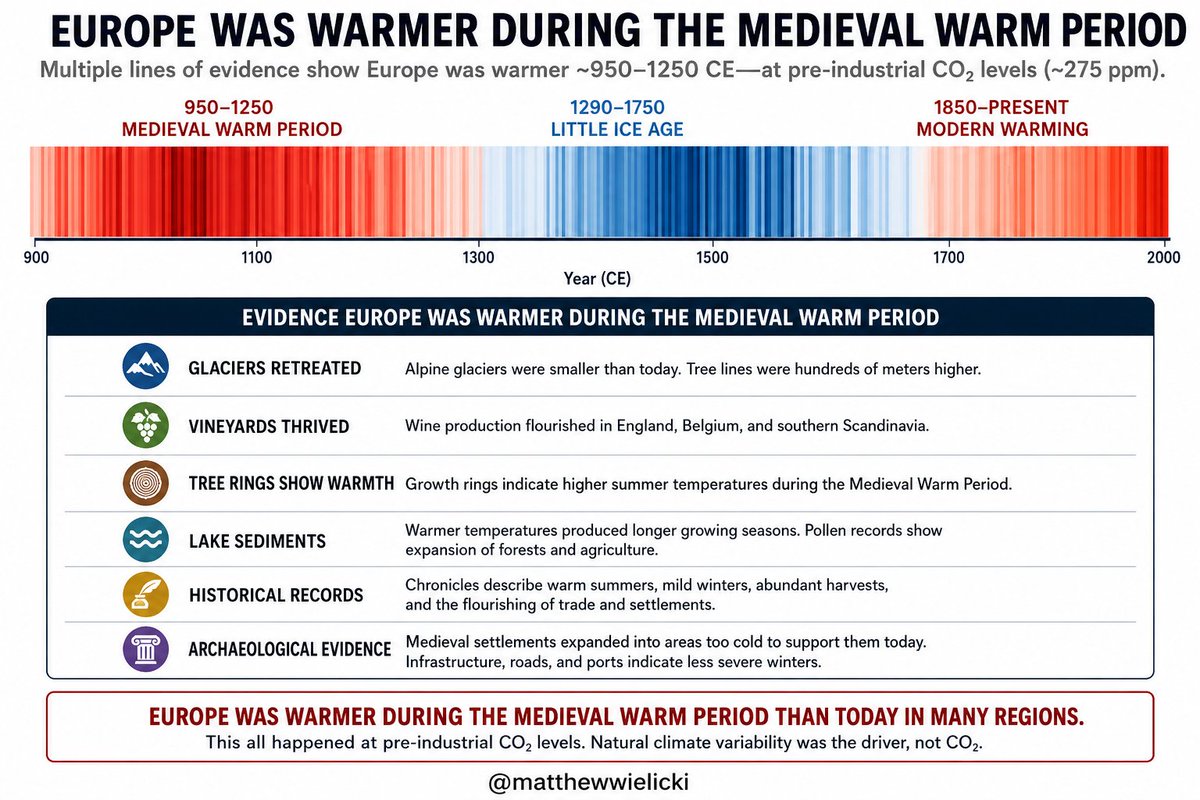
- The fastest centennial warming rate was in Central England from 1663-1762, at 0.9 Cº per century – before the industrial revolution began. It cannot have been our fault.
- The global warming trend since 1900 is equivalent to 0.8 Cº per century. This is well within natural variability and may not have much to do with us.
- The fastest warming trend lasting ten years or more occurred over the 40 years from 1694-1733 in Central England. It was equivalent to 4.3 Cº per century.
- Since 1950, when a human influence on global temperature first became theoretically possible, the global warming trend is equivalent to 1.2 Cº per century.
- The fastest warming rate lasting ten years or more since 1950 occurred over the 33 years from 1974 to 2006. It was equivalent to 2.0 Cº per century.
- In 1990, the IPCC’s mid-range prediction of the near-term warming trend was equivalent to 3.5 Cº per century.
- The global warming trend since 1990, when the IPCC wrote its first report, is equivalent to 1.4 Cº per century – two-fifths of what the IPCC had then predicted.
- In 2013 the IPCC’s new mid-range prediction of the near-term warming trend was for warming at a rate equivalent to 1.7 Cº per century – just half its 1990 prediction.
- Though the IPCC has cut its near-term warming prediction, it has not cut its centennial warming prediction of 3.7 Cº warming to 2100 on business as usual.
- The IPCC’s prediction of 3.7 Cº warming by 2100 is more than twice the greatest rate of warming lasting more than ten years that has been measured since 1950.
- The IPCC’s 3.7 Cº-by-2100 prediction is more than three times the observed real-world warming trend since we might in theory have begun influencing it in 1950.
- Since 1 January 2001, the dawn of the new millennium, the warming trend on the dataset of datasets is zero – 0.0 Cº per century. No warming for 13 years 2 months.
- Recent extreme weather cannot be blamed on global warming, because there has not been any global warming. It is as simple as that.
- RSS shows the least warming over the past 18 years; UAH, the other satellite dataset, shows the most. The difference is caused by varying adjustments to the data.
- Averaging the RSS and UAH data, and averaging the GISS, HadCRUT4 and NCDC data, shows a difference of only 1/30 Cº between the two trends.
Technical note
Our latest topical graph shows the RSS dataset for the 212 months August 1996 to March 2014 – just over half the 423-months satellite record.
Terrestrial temperatures are measured by thermometers. Thermometers correctly sited in rural areas away from manmade heat sources show warming rates appreciably below those that are published. The satellite datasets are based on measurements made by the most accurate thermometers available – platinum resistance thermometers, which not only measure temperature at various altitudes above the Earth’s surface via microwave sounding units but also constantly calibrate themselves by measuring via spaceward mirrors the known temperature of the cosmic background radiation, which is 1% of the freezing point of water, or just 2.73 degrees above absolute zero. It was by measuring minuscule variations in the cosmic background radiation that the NASA anisotropy probe determined the age of the Universe: 13.82 billion years.
The graph is accurate. The data are lifted monthly straight from the websites maintained by the keepers of the datasets. A computer algorithm reads them down from the text file, takes their mean and plots them automatically using an advanced routine that automatically adjusts the aspect ratio of the data window at both axes so as to show the data at maximum scale, for clarity.
The latest monthly data point is visually inspected to ensure that it has been correctly positioned. The light blue trend line plotted across the dark blue spline-curve that shows the actual data is determined by the method of least-squares linear regression, which calculates the y-intercept and slope of the line via two well-established and functionally identical equations that are compared with one another to ensure no discrepancy between them. The IPCC and most other agencies use linear regression to determine global temperature trends. Interestingly, Professor Phil Jones of the University of East Anglia recommends it in one of the Climategate emails.
Dr Stephen Farish, Professor of Epidemiological Statistics at the University of Melbourne, kindly verified the reliability of the algorithm that determines the trend on the graph and the correlation coefficient, which is very low because the data are highly variable and the trend is flat.
Related Links:
Climate Depot Analysis: ‘There have been at least nine ten separate explanations for the standstill in global warming’ – 1) Low Solar Activity; 2) Oceans Ate Warming; 3) Chinese Coal Use; 4) Montreal Protocol; 5) Readjusted past temps to claim ‘pause’ never existed 6) Volcanoes 7) Decline in Water Vapor 8) Pacific Trade Winds 9) ’Stadium Waves’ 10) ‘Coincidence’