
Via Meteorologist Joe D’Aleo
Latest storm likely to make the 2010s the snowiest decade in the east in the NOAA record
By Joseph D’Aleo, CCM (Certified Consulting Meteorologist)
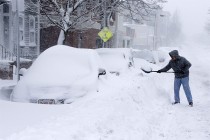
It was quite a storm. I have never seen Logan Airport report heavy snow with an air temperature of 1F (not wind chill) before. The ended up with 15.1 inches. Boxford had 23.8 inches.
Even as more cold and snow invades the central, near the east coast, the post storm blues have set in with the inevitability of an inside runner following rapidly on its heels. But snow loving friends, we have lived through quite a decade and the millennium so far has been a boon to snow lovers despite the continuing claims that snows are becoming rare and hurting winter sports as erroneously reported last week in Boston Magazine.
We here are using NOAA’s own NESIS scale – which we used to call the Kocin/Uccellini storms.
The Northeast Snowfall Impact Scale (NESIS)
Overview
While the Fujita and Saffir-Simpson Scales characterize tornadoes and hurricanes respectively, there is no widely used scale to classify snowstorms. The Northeast Snowfall Impact Scale (NESIS) developed by Paul Kocin and Louis Uccellini of the National Weather Service (Kocin and Uccellini, 2004) characterizes and ranks high-impact Northeast snowstorms. These storms have large areas of 10 inch snowfall accumulations and greater. NESIS has five categories: Extreme, Crippling, Major, Significant, and Notable. The index differs from other meteorological indices in that it uses population information in addition to meteorological measurements. Thus NESIS gives an indication of a storm’s societal impacts. This scale was developed because of the impact Northeast snowstorms can have on the rest of the country in terms of transportation and economic impact.
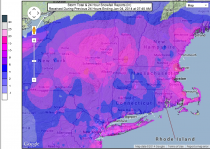
NESIS scores are a function of the area affected by the snowstorm, the amount of snow, and the number of people living in the path of the storm. The diagram below illustrates how NESIS values are calculated within a geographical information system (GIS). The aerial distribution of snowfall and population information are combined in an equation that calculates a NESIS score which varies from around one for smaller storms to over ten for extreme storms. The raw score is then converted into one of the five NESIS categories. The largest NESIS values result from storms producing heavy snowfall over large areas that include major metropolitan centers. For details on how NESIS scores are calculated at the National Climatic Data Center, see Squires and Lawrimore (2006).
References:
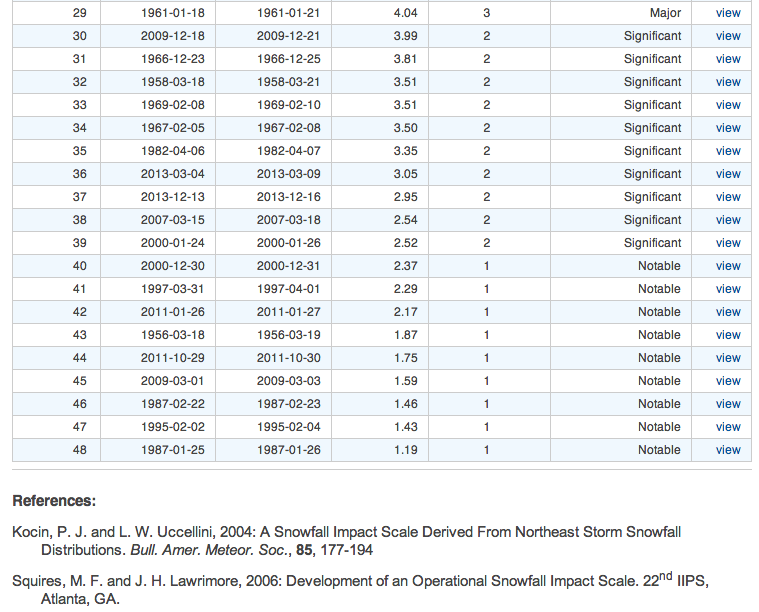
Kocin, P. J. and L. W. Uccellini, 2004: A Snowfall Impact Scale Derived From Northeast Storm Snowfall Distributions. Bull. Amer. Meteor. Soc., 85, 177-194
Squires, M. F. and J. H. Lawrimore, 2006: Development of an Operational Snowfall Impact Scale. 22nd IIPS, Atlanta, GA.
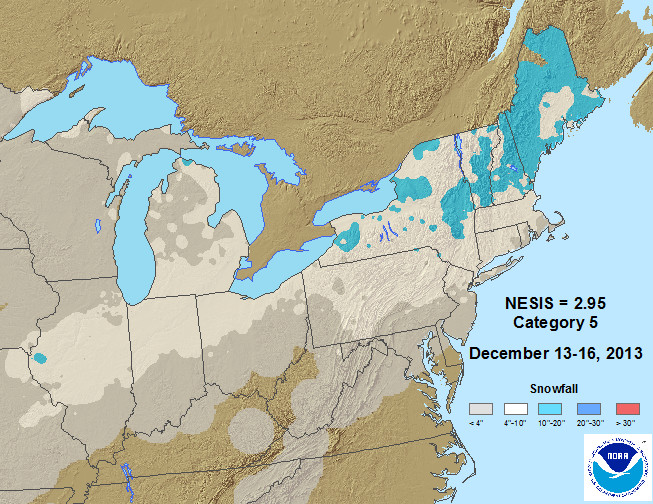
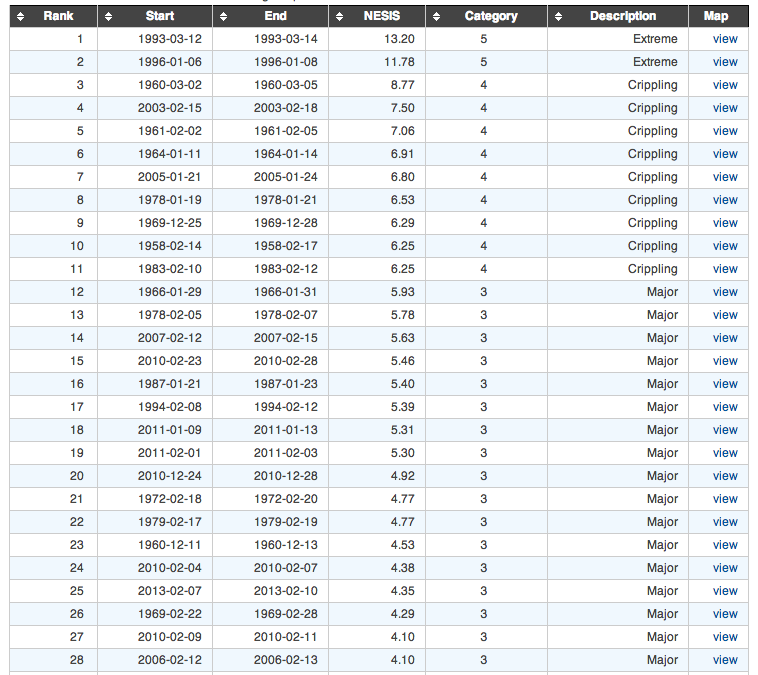
They had added the mid December storm to the Northeast NESIS list as a category 2 (Significant) event.

The table below is enlarged with hyperlink snow amount VIEW maps here.
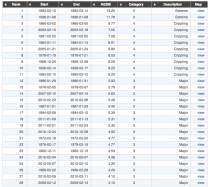
Enlarged Part 1
Enlarged Part 2
This week’s storm was at least as impactful and covered a wide stretch back to the Midwest.
If it joins the NESIS list, it will be storm 49 and make the 2010s the snowiest decade for the east coast in the record, surpassing the 1960s.
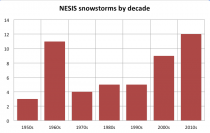
Of course we are just beginning the 4th year of the decade. Also note that 21 of the 49 have been this millennium.
Posted on 01/04 at 08:39 AM – By Joseph D’Aleo
Meteorologist Joseph D’Aleo served as the first Director of Meteorology at The Weather Channel and was the Chief Meteorologist at Weather Services International Corporation and served as chairman of the American Meteorological Society’s (AMS) Committee on Weather Analysis and Forecasting. D’Aleo founded the website International Climate and Environmental Change Assessment Project at Icecap.us – Mr. D’Aleo is a graduate of the University of Wisconsin BS, MS and did his doctoral studies in Air Resources at NYU. Mr. D’Aleo is currently co chief Meteorologist at Weatherbell.com.
#
Related Links:
Five Of The Six Snowiest Winters Have Occurred Since David Viner Declared The End Of Snow
This Sunday’s NFL Game in Green Bay: Coldest Ever? – Forecast is now -8 deg. F for game time
December 31 Global Sea Ice Area (Both Arctic & Antarctic Ice Combined) Was The Largest Ever Recorded For The Date ‘ – Planet Earth currently has the most sea ice ever measured this time of year’
Clitantic scientists trapped in Antarctic ice claim expanding sea ice caused by ‘global warming’ — But data and studies refute claims – Global warming scientists faced with absurd reality
’Scientists Trapped In Record Antarctic Sea Ice Announce That It Is Disappearing‘ (Via Real Science)
Growing number of scientists are predicting global cooling: Russia’s Pulkovo Observatory: ‘We could be in for a cooling period that lasts 200-250 years’
‘Sun Sleeps’: Danish Solar Scientist Svensmark declares ‘global warming has stopped and a cooling is beginning…enjoy global warming while it lasts’
Prominent geologist Dr. Don Easterbrook warns ‘global COOLING is almost a slam dunk’ for up to 30 years or more
Australian Astronomical Society warns of global COOLING as Sun’s activity ‘significantly diminishes’


