By Meteorologist Paul Dorian – Arcfieldweather.com
March 4, 2024

As long as temperatures in the Arctic region remain close-to-normal during the summer season (gray area), there will likely be a limit as to the amount of melting of sea ice. The plot shown here is for the full year of 2023 and indeed, temperatures were nearly normal during the summertime which continues a long-term trend. Data courtesy Danish Meteorological Institute
Overview
Temperatures are currently running at warmer-than-normal levels in the Arctic region (not shown) during this late stage of the winter season with actual air temperatures generally well below the freezing mark. This above-normal trend in temperatures during the cold season in the Arctic region has been quite consistent during the past many years. Meanwhile, temperatures during the past several summer months of June, July and August have been nearly normal and this is especially important with respect to Arctic sea ice as this is the melting season in the Arctic region when actual air temperatures can average right near or even slightly above the freezing mark. As long as temperatures in the Arctic region remain nearly normal during the summer (melting) season, the chance for a significant drop off in sea ice will be limited. Indeed, given this consistent temperature trend in recent decades, Arctic sea ice has shown resiliency both in terms extent and in volume. One possible explanation of this persistent temperature pattern across the Arctic region with nearly normal summertime conditions and warmer-than-normal in the other nine months of the year (i.e., the cold season) can be increased levels of water vapor in the atmosphere.
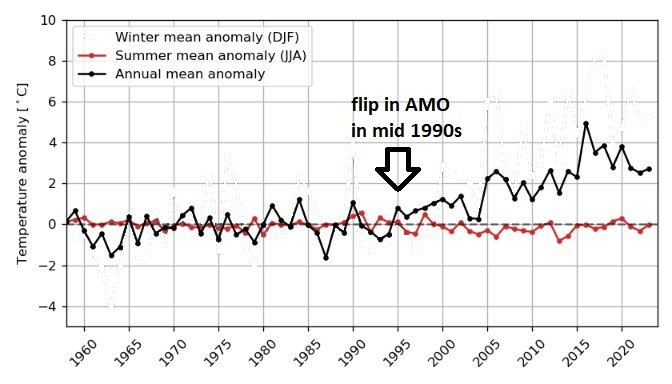
Anomaly of the +80N mean temperature index is shown here back to 1960, compared with climate (annual mean minus the corresponding climate value). “All year” anomaly is illustrated with the black line and has climbed since the middle 1990s. The “summertime” anomaly of June, July, and August is illustrated with red and has held at nearly normal levels. An important shift in the Atlantic Multidecadal Oscillation (AMO) took place during the middle 1990’s when it flipped from a “negative-to-positive” phase. Reference climate is ECMWF-ERA40 1958-2002. Plot courtesy Danish Meteorological Institute
Arctic temperatures and the impact on sea ice
Temperatures have followed a persistent trend in the Arctic region during the past several years, in fact, going all the way back to the beginning of the 21st Century. Specifically, temperatures have been running at nearly normal levels during the all-important summer (melting) season of June, July, and August and then usually at well above-normal levels during the remaining nine months of the year.
Nearly normal temperatures in the summer months of June, July and August are typically at levels just right near or slightly above the freezing mark and as long as they remain there during this the melting season, chances for any significant drop-off in Arctic sea ice will be limited. Well above-normal temperatures in the other nine months of the year have minimal impact on the melting of Arctic sea ice as – even though they may average at well above-normal levels – they are generally way below the freezing mark. Indeed, with this dependable temperature trend in recent years, Arctic sea ice has been rather resilient both in terms of extent and volume.

This plot shows the annual Atlantic Multidecadal Oscillation (AMO) detrended index values from the 1850’s to the present. There was an important shift in the AMO during the middle 1990’s from negative-to-positive (indicated by arrow on plot) associated with a warming of sea surface temperatures in the Northern Atlantic Ocean. The thin blue line indicates 3-month averages and the thick blue line represents the 11-year rolling average. Data source: NOAA’s Earth System Research Laboratory, last full year shown is 2022, diagram updated January 2023
Arctic sea ice extent has been running at below-normal levels since the middle 1990’s at which time there was an important shift in the Atlantic Multidecadal Oscillation (AMO) to one featuring warmer-than-normal sea surface temperatures in the North Atlantic Ocean. The Arctic sea ice extent headed steadily downward after that shift and reached its lowest point in 2012 at levels not seen before during the satellite era which goes back to the late 1970’s. Since then, Arctic sea ice extent has held rather steady with a general sideways trend during the past ten years or so.
Graph showing monthly Arctic sea ice extent since January 2000 with a general “sideways” trend during the past ten years or so. The lowest point in the minimum Arctic sea ice area extend came during 2012 (indicated with arrow). The area covered by sea ice is defined as having at least 15% sea ice cover. The thin blue line shows monthly values, and the thick blue line shows the simple running 13 month average. The red lines show the 1979-2023 average. Data provided by the National Snow and Ice Data Center (NSIDC). Last month shown: January 2024. Latest figure update: 6 February 2024.
In addition to sea ice extent, an important climate indicator to monitor is sea ice volume as it depends on both ice thickness and extent. Arctic sea ice volume is difficult to monitor on a continuous basis as observations from satellites, submarines and field measurements are all limited in space and time. As a result, one of the best ways to estimate sea ice volume is through the usage of numerical models which utilizes all available observations. One such computer model comes from the University of Washington and is called the Pan-Arctic Ice Ocean Modeling and Assimilation System (PIOMAS, Zhang and Rothrock, 2003). This model-derived Arctic sea ice volume shows a steady downward trend from the middle 1990s to the low point that was reached in 2012. Since then, Arctic sea ice volume has been showing resiliency with a general sideways trend during the past several years.
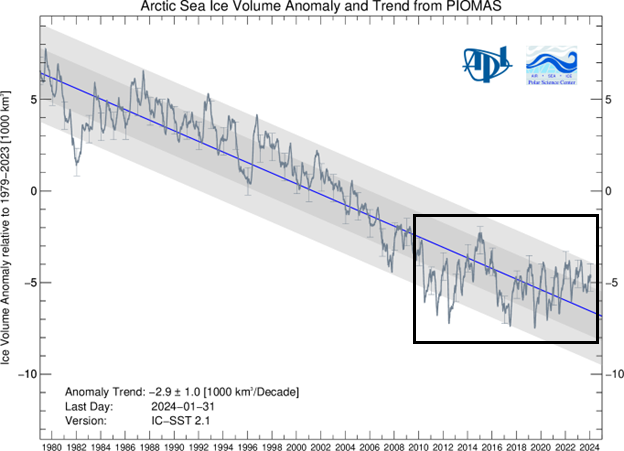
Arctic sea ice volume as estimated by the University of Washington’s PIOMAS numerical model shows resilience during the last ten years or so with a “sideways” trend. This model output data is updated on a monthly basis and is shown here through January 2024. Details on the PIOMAS model are available here.
Possible role of water vapor
One possible explanation for the behavior of temperatures in the Arctic region during the past couple of decades has to do with increased amounts of water vapor in the atmosphere. Overall, water vapor content has been higher-than-normal in the Arctic region during the past couple of decades largely as the result of warmer-than-normal sea surface temperatures in both the North Atlantic (positive AMO) and the Pacific Ocean (multiple El Nino events).
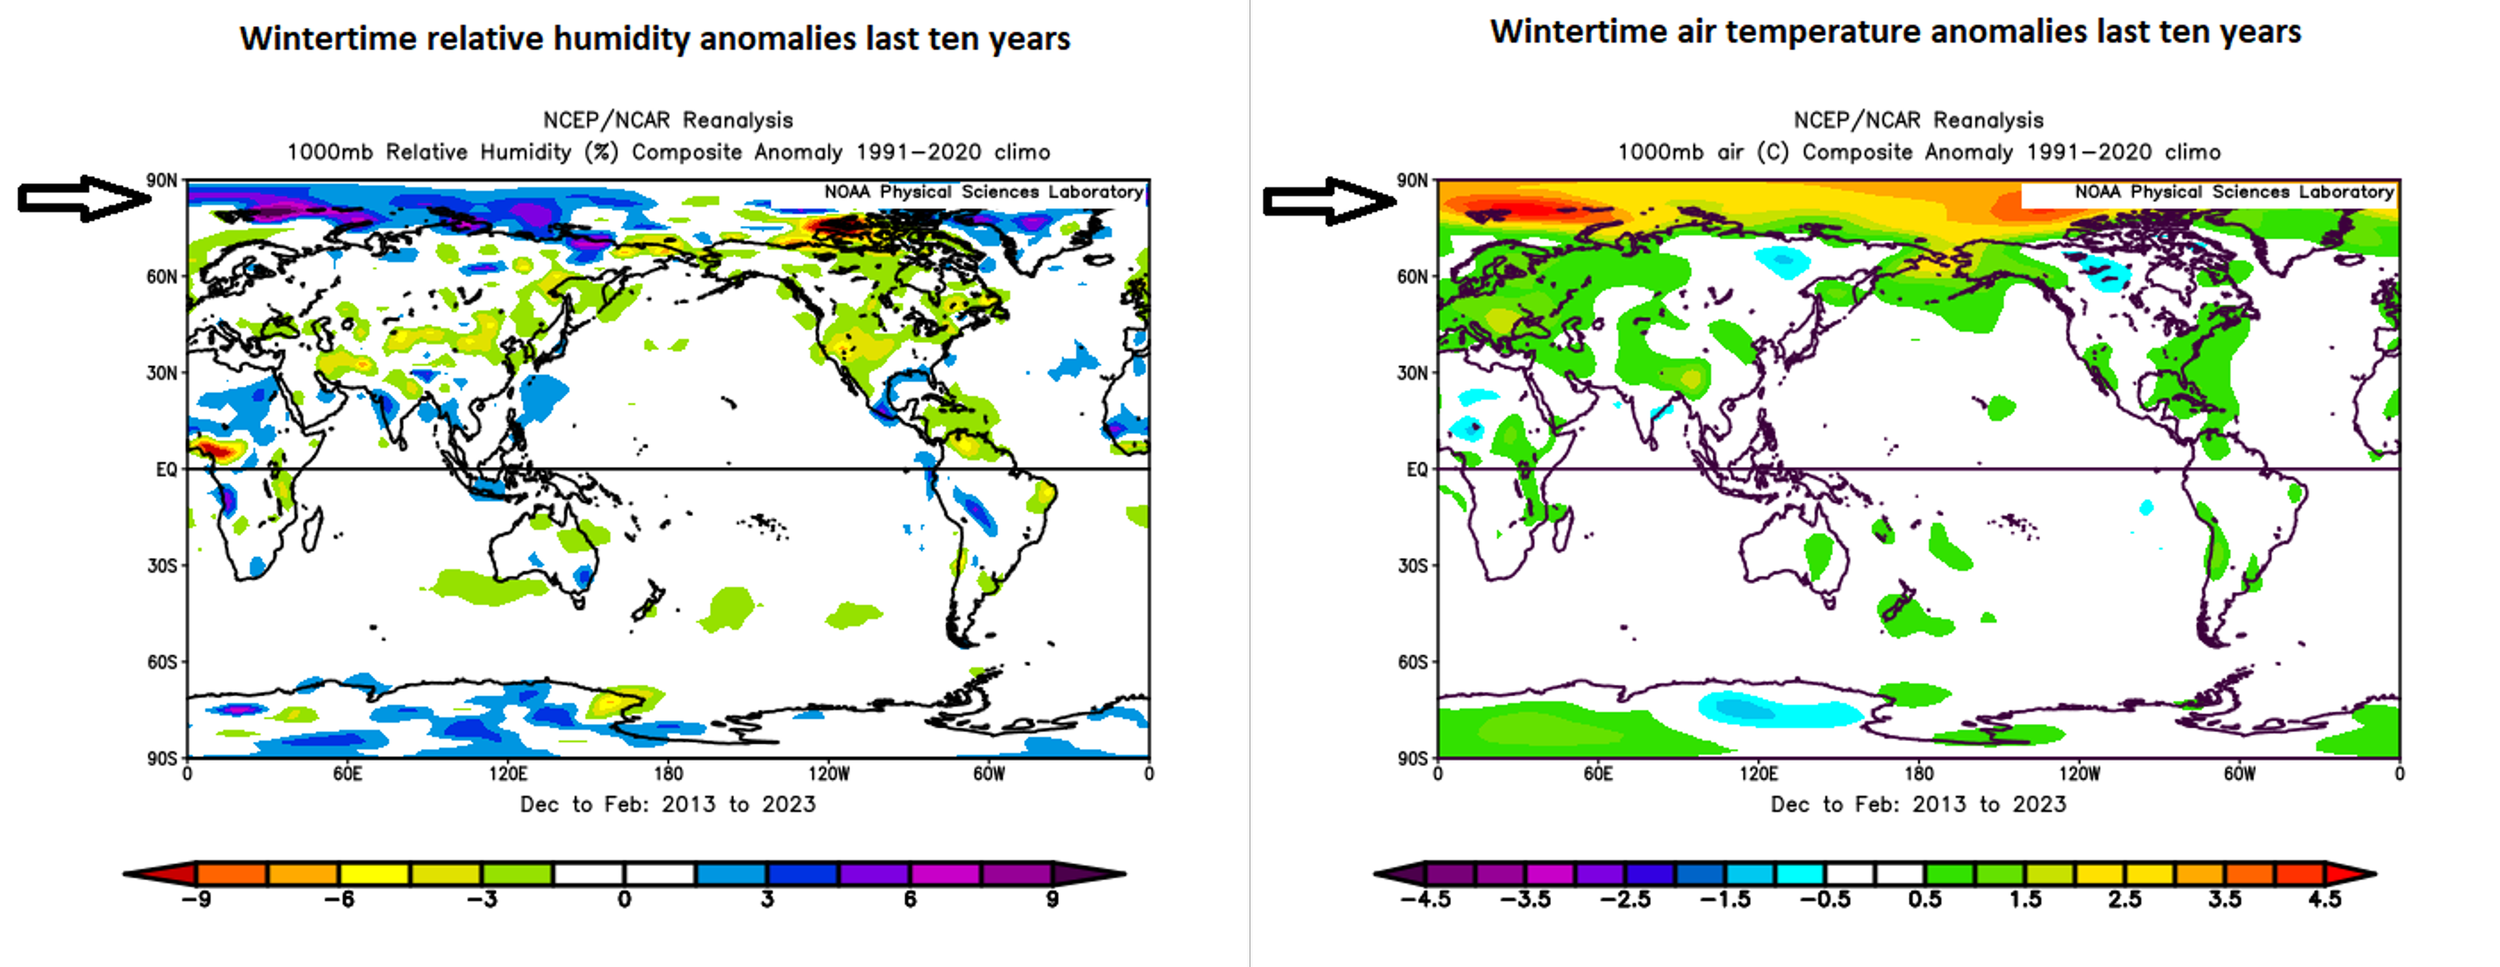
Relative humidity (left) and surface temperatures (right) have averaged higher-than-normal during the wintertime in the Arctic region (indicated with arrows) for the last ten years (2013-2023). An increase in water vapor (and relative humidity) in the cold, dry cold season of the Arctic can have much more of an impact on air temperatures as compared with the warmer summer (melting) season. Maps courtesy NOAA/NCAR
Given the warmer-than-normal water temperatures, there has been increased evaporation and this, in turn, generates more overall water vapor in the atmosphere. An increase in water vapor will have a much bigger impact on temperatures in very cold and dry atmospheric conditions and less of an impact in a warmer and more humid environment. In other words, an increase in overall water vapor could very well result in warmer-than-normal temperatures during the cold seasons in the Arctic when it is typically very cold and dry, and likely have little, if any, impact during the warmer, more humid summer (melting) season.
Meteorologist Paul Dorian
Arcfield
arcfieldweather.com