https://rclutz.com/2023/12/03/cop28-triggers-leap-in-arctic-ice/
By Ron Clutz / December 03, 2023
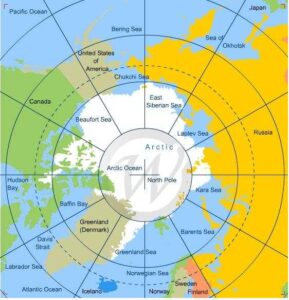
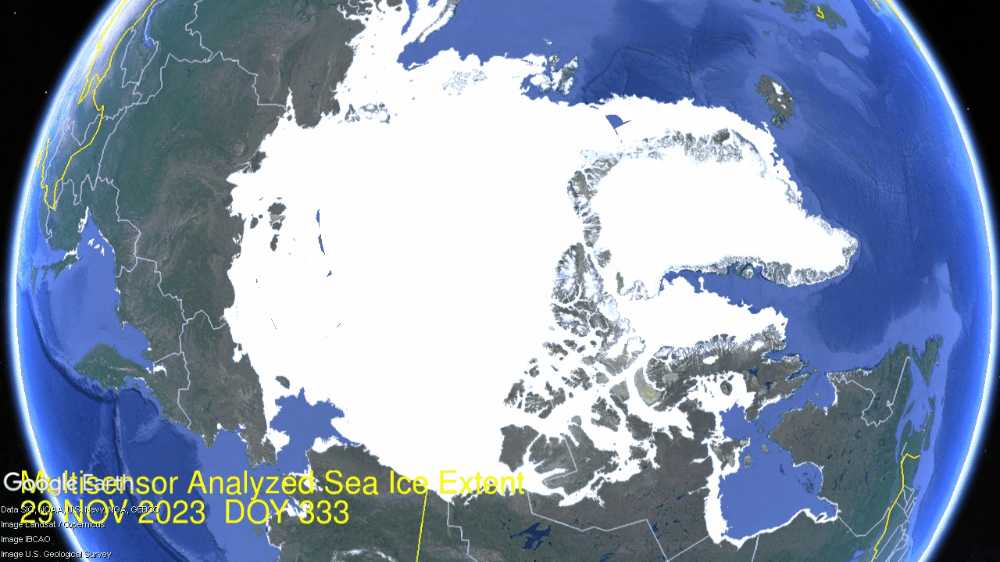
The animation shows remarkable growth of Arctic ice extent just since COP28 began. As noted in the previous Arctic ice post, Hudson Bay (lower right) was a lagging region, but freezing accelerated there. To the north Baffin Bay ice extended. As well, Both Bering and Okhotsk seas (far left) added fast ice on coastlines. In all, half a Wadham, 507k km2 of ice extent was added in just three days.
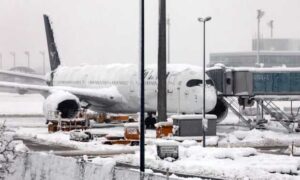
A Lufthansa aircraft at the snow-covered Munich airport on Saturday. Photograph: Karl-Josef Hildenbrand/AP
Coincidently, COP28 also triggered heavy snow bringing chaos to southern Germany causing Munich to suspend flights to anywhere, including Dubai.
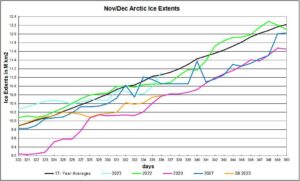
The graph below shows the gains in ice extent erasing a brief deficit to average.Arctic2023336
MASIE shows a gain of ~0.5M km2 from day 334 to 336 overcoming a brief deficit to average. SII (Sea Ice Index) also rose but is still estimating ice extent 500k km2 lower.
The table below shows the distribution of ice in the Arctic Ocean basins.
Region 2023336 Day 336 2023-Ave. 2007336 2023-2007
(0) Northern_Hemisphere 11113626 11059843 53782 10853632 259993
(1) Beaufort_Sea 1070966 1069301 1665 1054586 16380
(2) Chukchi_Sea 765844 797154 -31311 607874 157970
(3) East_Siberian_Sea 1087137 1080765 6372 1023256 63882
(4) Laptev_Sea 897845 897835 9 897845 0
(5) Kara_Sea 812779 796332 16446 829462 -16683
(6) Barents_Sea 350616 259899 90717 222769 127847
(7) Greenland_Sea 711570 538651 172919 541176 170393
(8) Baffin_Bay_Gulf_of_St._Lawrence 571757 697517 -125760 755390 -183633
(9) Canadian_Archipelago 854860 853409 1451 852556 2304
(10) Hudson_Bay 553841 636088 -82247 812965 -259124
(11) Central_Arctic 3220281 3198662 21619 3177278 43003
(12) Bering_Sea 82391 154107 -71716 27916 54475
(13) Baltic_Sea 23276 4889 18387 2898 20378
(14) Sea_of_Okhotsk 106202 70731 35471 46377 59826
As shown in the table above, the main deficits to average are in Hudson and Baffin Bays, along with less ice in Bering Sea. Offsetting are surpluses elsewhere, especially in Barents and Greenland seas.
Arctic map
algore_ice_gone_by_2013