By
Snow extent in the Northern Hemisphere at the end of November represents an important parameter for the early winter forecast. This year snow extent is running much higher than average and according to existing global estimates, it is now beyond the highest ever observed so far. Winter forecast, especially in its early phase and in Europe, might be strongly influenced by such a large snow extent, although many other factors need attention.
SNOW EXTENT IN NOVEMBER 2022
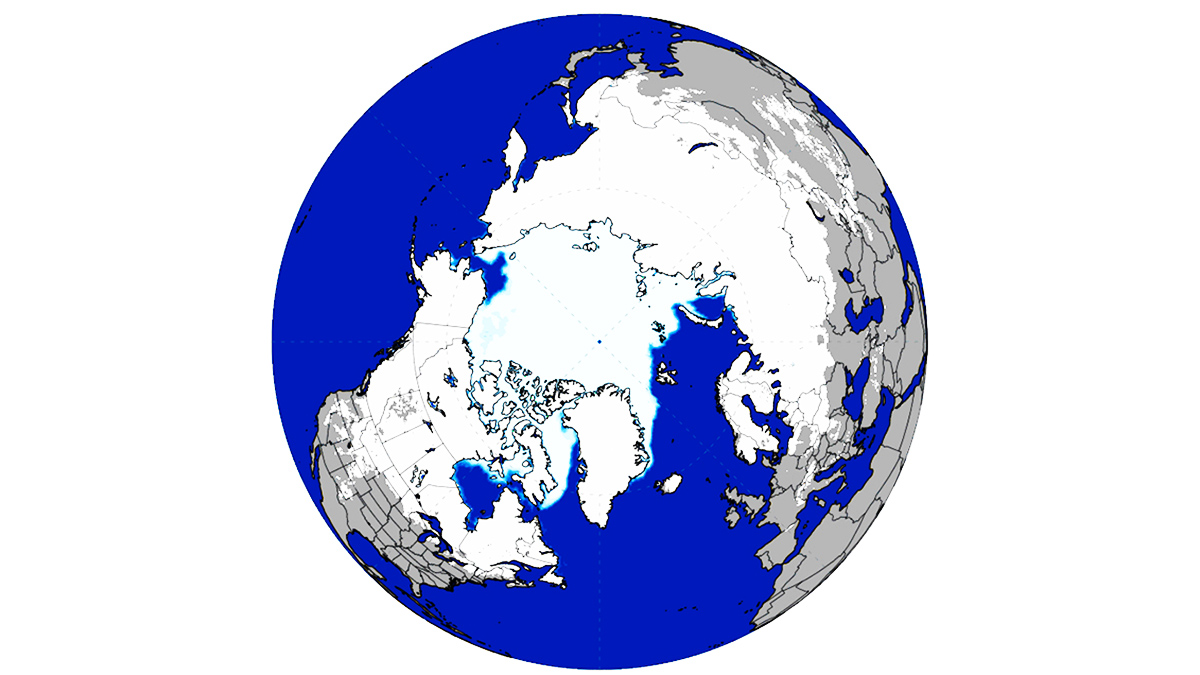
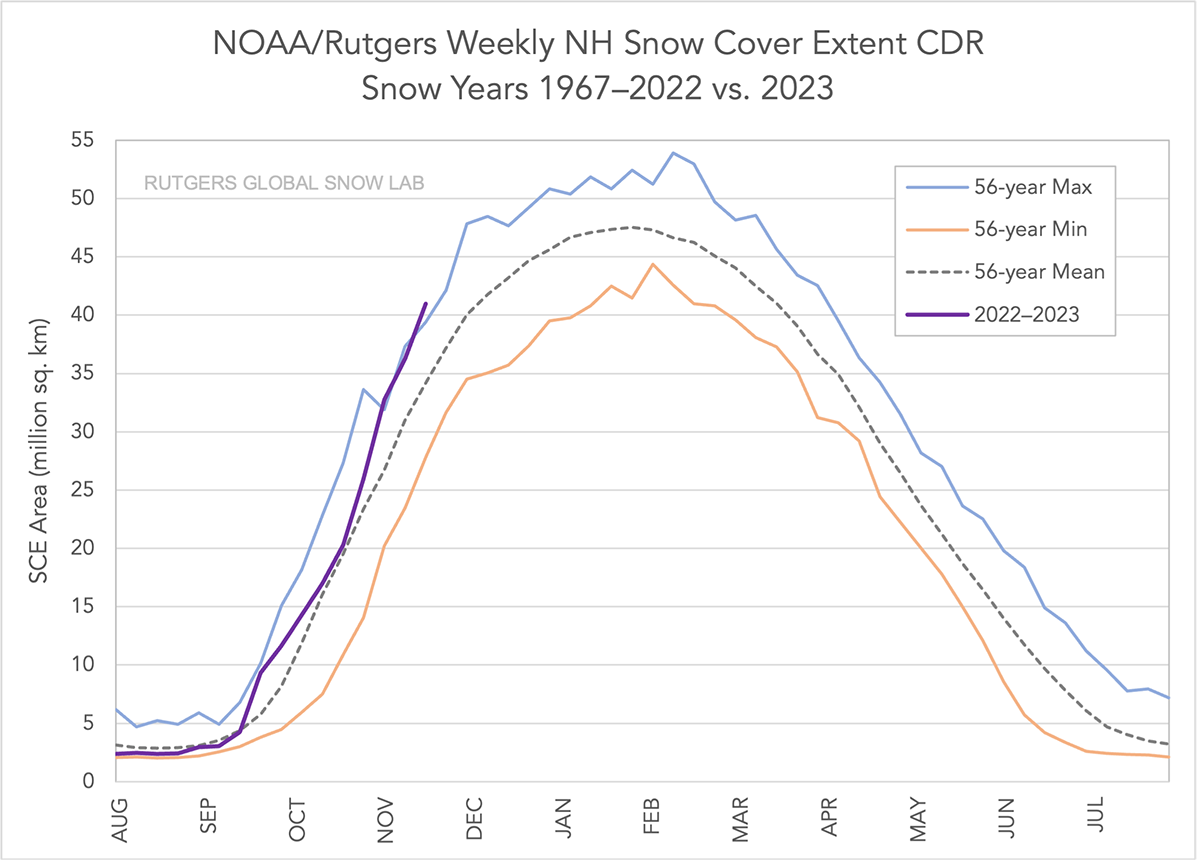
Northern Hemisphere snow extent is currently indeed very high, now at about 41 million square kilometers, according to the NOAA/Rutgers Global Snow Lab. The most recent snow cover information is given in the image below.
The Weekly Northern Hemisphere snow cover extent for the winter season 2022-2023 in purple is plotted together with the mean (grey dashed line), maximum (blue), and minimum (orange) snow cover extent for each week. Mean weekly snow cover extent and extremes were calculated using the 56-year period from October 1966 to July 2022.
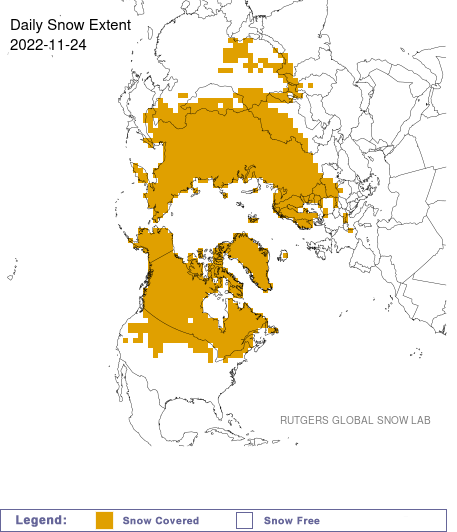
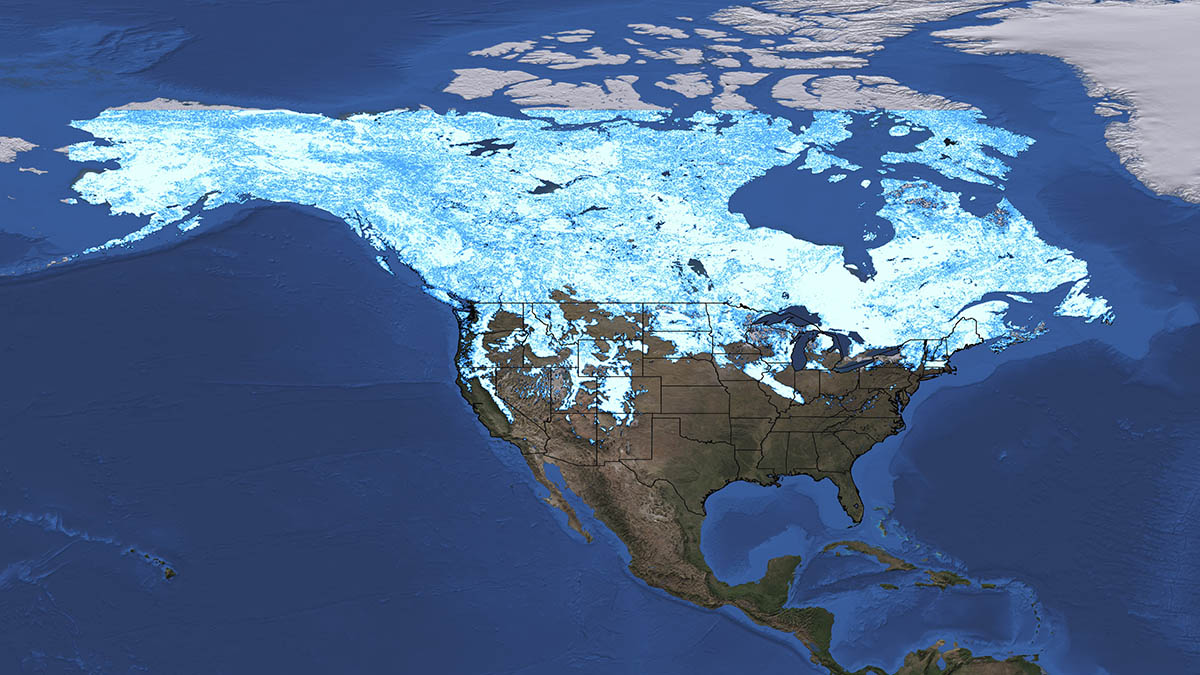
Looking at the below Rutgers Daily Snow Extent map, it is clearly noticeable how Russia is completely covered in snow now. Snow is also seen overwhelming all of Canada, and Alaska, as well as a good portion of the Lower 48. This is an important parameter for the early winter forecast.
You could probably forecast a colder-than-normal winter based on Autumnal Northern Hemisphere snow cover extent alone. It’s the largest snow extent in decades. Having so much snow on the ground means any arctic outbreak is going to be a little bit colder. But why should be like this?
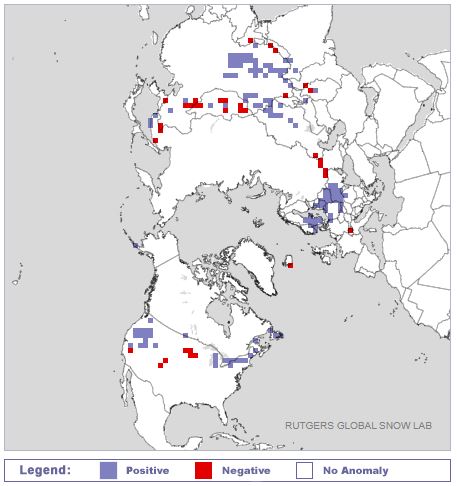
The image below shows the daily snow cover departure from the long-term average. In blue and red are respectively shown the positive (more snow extent than the long-term average) and negative (less snow extent than the long-term average) anomalies. In Eurasia vast areas with larger snow extent is present especially over the eastern European countries boarding Russia and Central China.
In North America snow extent for the end of November is more south than normal, especially in the North West and North East sectors of the U.S: Small and scattered negative anomalies are less significant in the picture, mostly affecting central Mongolia, North East China, and the central U.S.
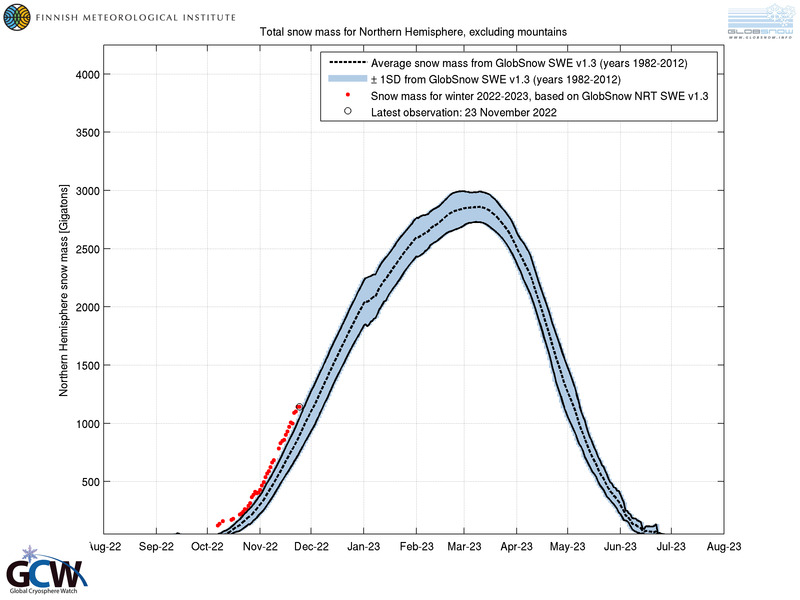
According to the Finnish Meteorological Institute, also the total snow mass for the Northern Hemisphere is tracking comfortably above the 1982-2012 average. This result is based on the current Northern Hemisphere snow-water equivalent relative to the long-term mean and variability.
Snow extent grew pretty fast in the last 30 days, as it should generally be in this period of course, but 2022 is setting a clearly very favorable season for snow on the ground. In the video below you can see how fast the snow extent increased in the last 4 weeks.
By the way, as a curiosity, the temperature is always colder on the ground in winter and at night in calm conditions, that is without or with the very weak wind. That’s because the Earth warms up and cools off much faster than the atmosphere does. More, colder air is denser, therefore the air near the ground is colder at night than the higher air. That’s why for instance your thermometer says +1 or +2 degrees Celsius, but you might see frost on the ground.
Extensive snow extent early in the season is an indicator of persistent cold as we head into winter proper, mainly due to albedo and emissivity feedback.
Albedo is defined as the fraction of light that is reflected by a body or surface. On average, the Earth reflects about 30 percent of the sun’s radiation, but when fresh snow covers the ground that value nearly triples and it is close to 1.0. In fact, snow has the greatest albedo on Earth, from less than 0.60 for wet and melting snow to greater than 0.85 for fresh snow.
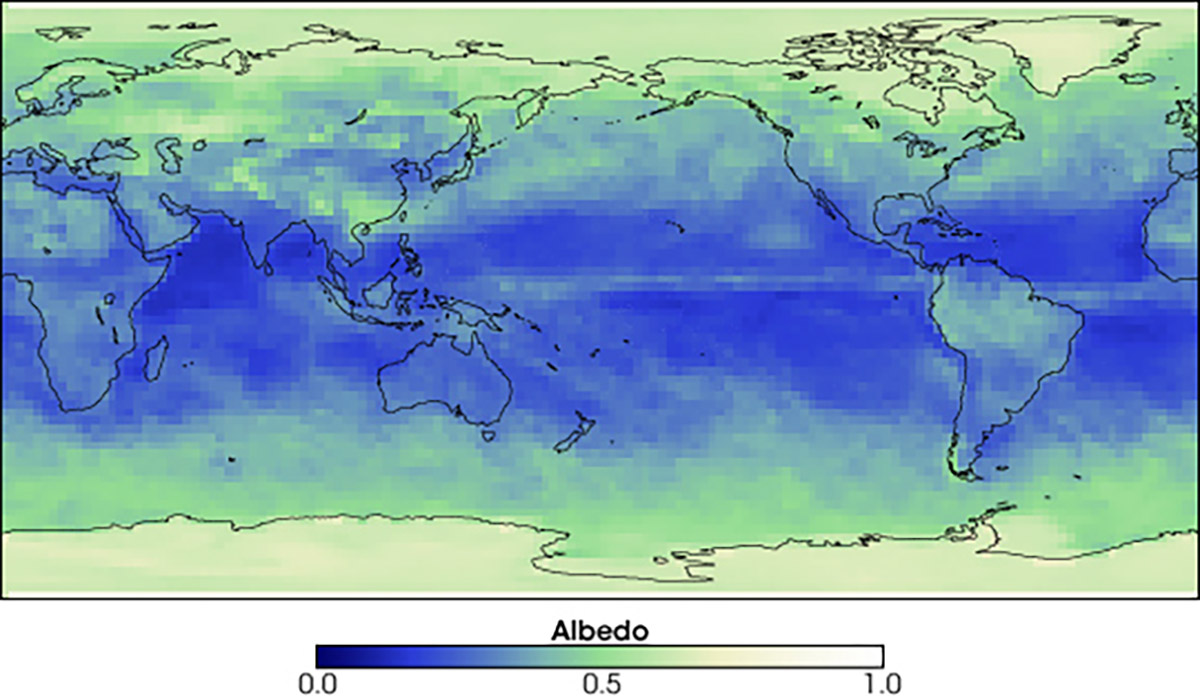
The albedo of fresh snow could be as higher as 0.95, which means it reflects back to space 95 percent of the sun’s radiation, keeping the ground and air much cooler.
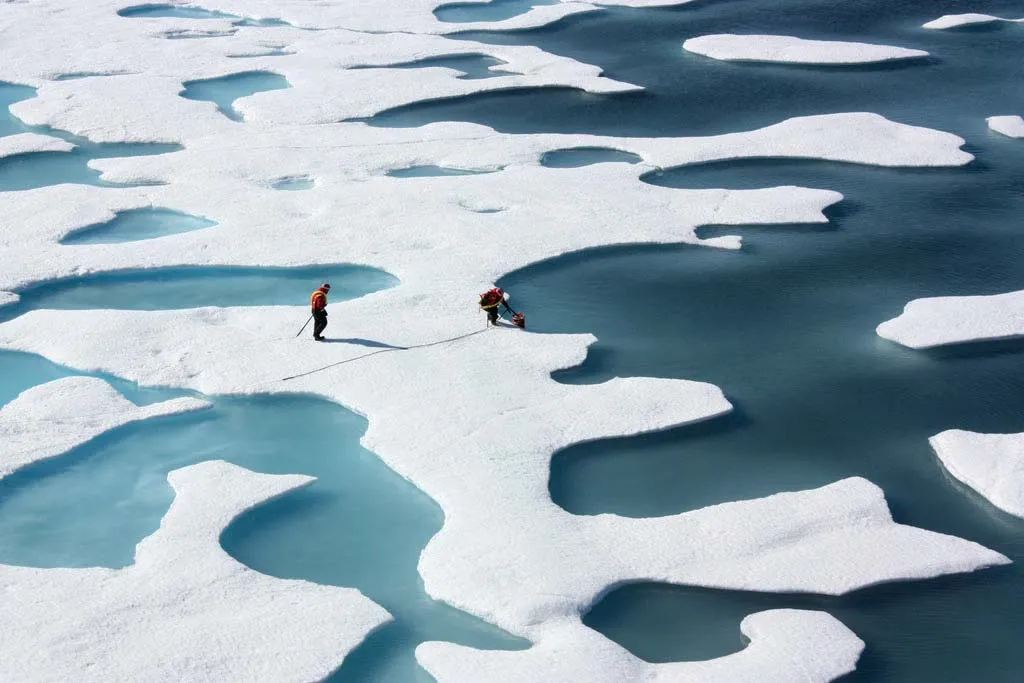
It represents an important parameter in climatology since recent albedo decreases in the Arctic have increased heat absorption at the surface leading to the so-called Arctic Amplification. Practically, Arctic lands and sea are warming faster than other environments on Earth due to the positive feedback induced by the darker surface of the land and sea in summer, where there is no snow or ice on the ground or sea ice melted.
original image from britanica.com
Because of the changes in the solar elevation and the global radiation with time and geographical location, the albedo effect on the surface radiation balance, thus the surface temperature, also changes spatially and temporally.
But besides albedo, snow has also high emissivity that cools the ground. Over the thermal infrared part of the radiative spectrum, snow acts almost as a “blackbody.” The emissivity of snow varies from 0.96 to 0.99, with an average of about 0.98. Without going too much into the details, we can say that such value is generally higher than any other land surface emissivities. This means, when the ground is covered in snow the higher emissivity of a snow surface causes an increase in the outgoing longwave radiation, thus cooling the snow surface.
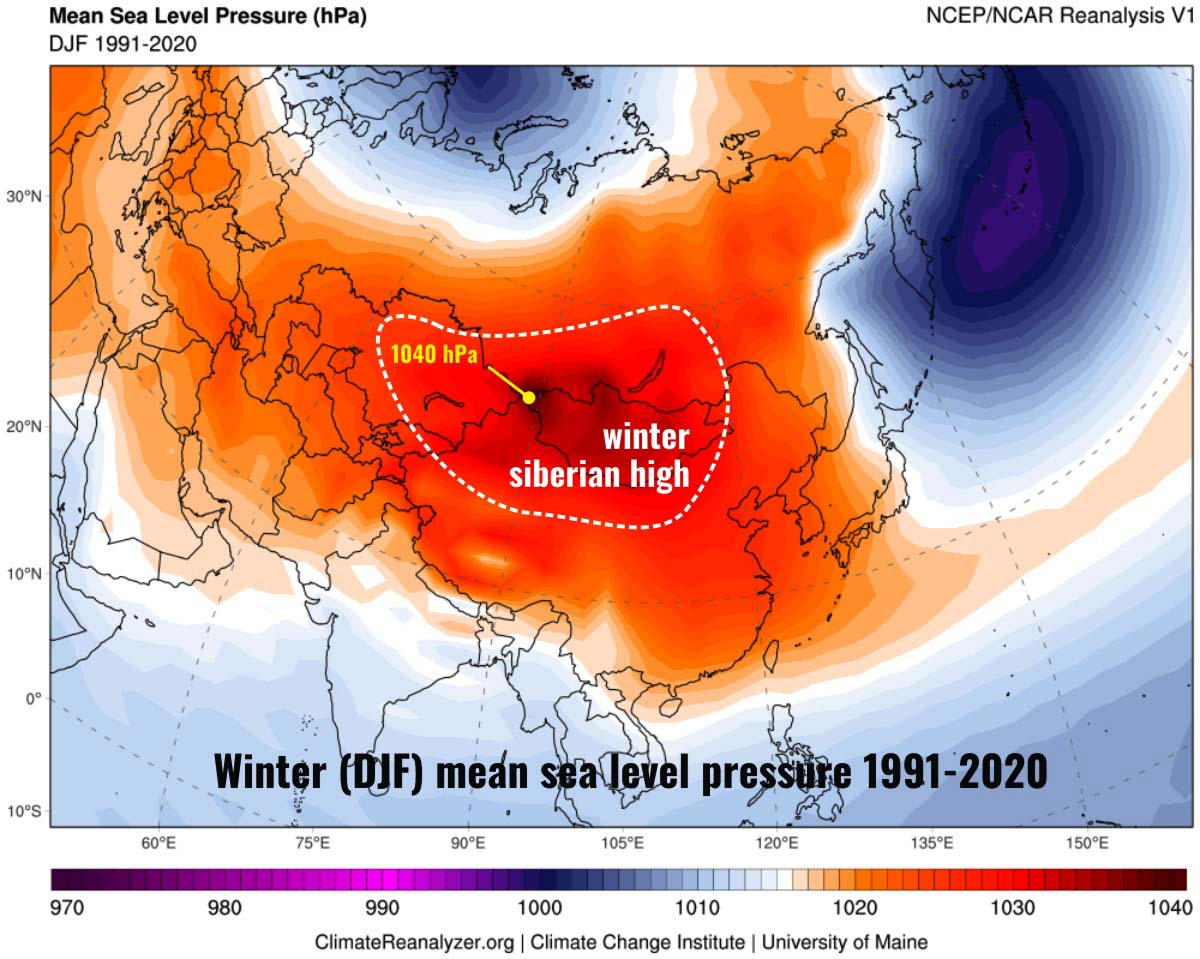
The overall impact of snow cover on the ground thermal regime depends on several factors: the timing, duration, accumulation, and melting processes of seasonal snow cover. In general, cold, dry, and clear-sky conditions generate higher emissivity of snow surface resulting in surface cooling and very often the development of a low-level temperature inversion. This is the way how the well-known Siberian High forms at this time of the year.
The Siberian High is a massive pool of cold dry air that accumulates in the northeastern part of Eurasia from September until April. It is usually centered on Lake Baikal. It reaches its greatest size and strength in the winter when the air temperature near the center of the high-pressure area is often lower than −40 degrees Celsius. The Siberian High is the most important atmospheric center of action in Eurasia during the winter months.
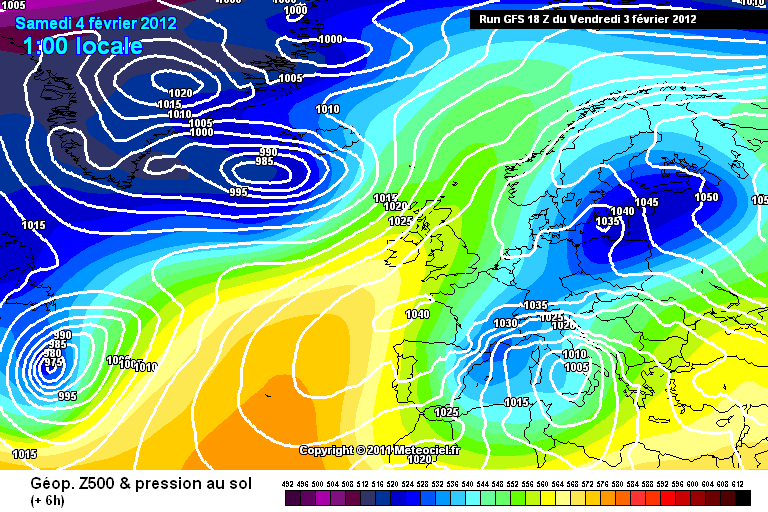
The Siberian High could strongly affect the weather in western Europe when specific patterns develop and typical retrogressive flows occur producing unusually frigid conditions over the “old continent”. In the image below we can see an example from early February 2012 when a historical cold outbreak affected Europe and the Mediterranean.
The associated air mass moves in the low troposphere being formed by very cold, dry, and dense air. The Siberian High is defined as a surface anticyclones form due to downward motion through the troposphere, the atmospheric layer where weather occurs.
Preferred areas within a synoptic flow pattern in higher levels of the troposphere are beneath the western side of troughs. On weather maps, these areas show converging winds (isotachs), also known as confluence, or converging height lines near or above the level of non-divergence, which is near the 500 hPa pressure surface (roughly 5500 meters) about midway up the troposphere. Because they weaken with height, these high-pressure systems are cold.
The intensity of the Siberian High, experienced a marked decrease in the last 50 years, showing a strong correlation with the temperature rise during the same period. In general, the Siberian High and the winter temperature in Europe have an almost perfect mirroring relationship during 1960–2010, suggesting a direct impact of the former on the latter.
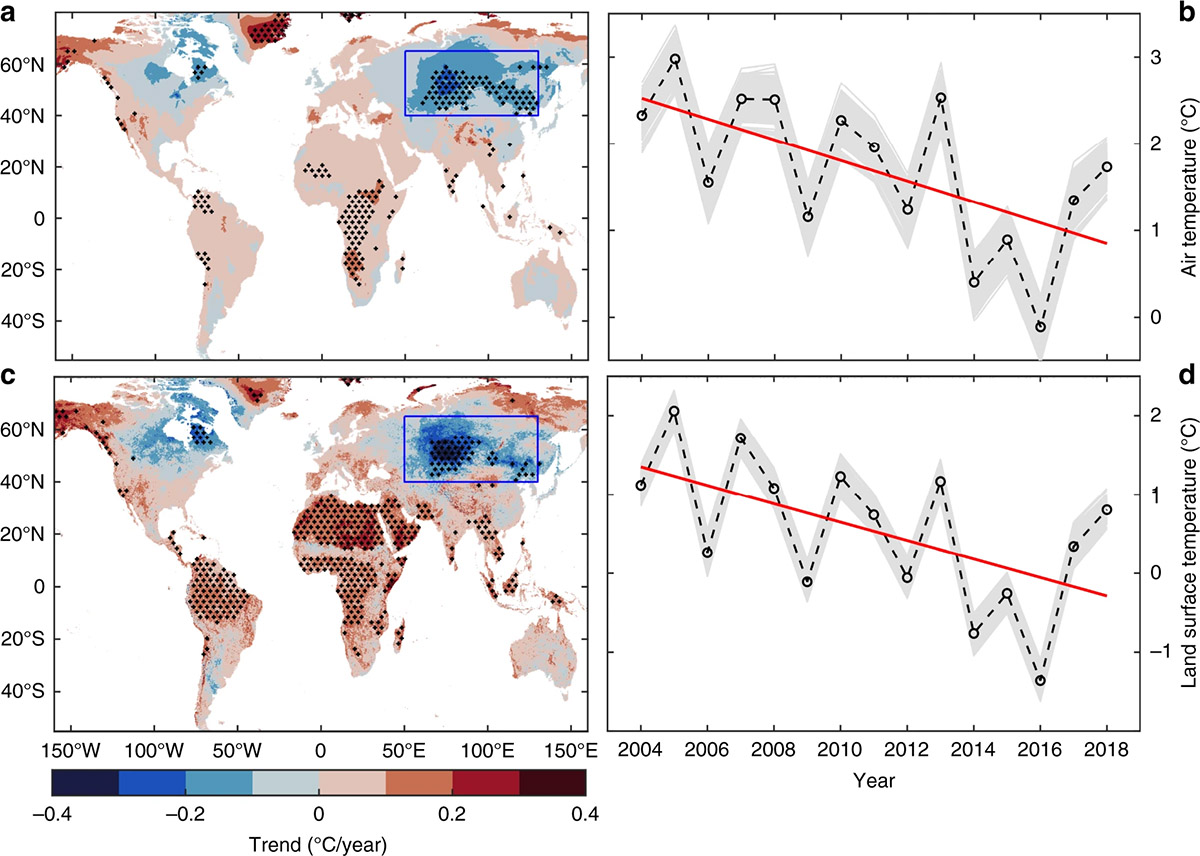
Autumn trends of Land air temperatures from 2004 to 2018 in central Eurasia
Nevertheless, numerous studies have found recently an unexpected phenomenon of extensive fall and winter cooling over central Eurasia not fully reflecting the nature of climate variability over time. A team of scientists has shown how autumn cooling in Eurasia is likely influenced by the Pacific Decadal Oscillation (PDO) and Siberian high (SH). Since 2004, the strengthening of the PDO and SH explains approximately 54% and 18% of the autumn cooling in Eurasia, respectively.
The relationship between autumn snow cover and the ensuing winter temperatures is generally much stronger for Eurasia than for North America. For Eurasia the average snow cover extent during the autumn explained as much as 52% of the variance in the winter (December–February) temperatures compared to only 12% for North America, a study found.
Nevertheless, when the average winter snow cover is correlated with the average winter temperature the relationship is better for North America than for Eurasia. As much as 46% of the variance in the winter temperature is explained by the winter snow cover in North America compared to only 12% in Eurasia. This is because extensive snow cover over North America decreases surface air temperature directly via local diabatic cooling.
More, coincident with the strengthened Siberian High and the accelerated East Asian jet stream in January, and December lower surface air temperature in North America decreases surface air temperature over midlatitude Asia. Hence, December North American snow cover could potentially be exploited for sub-seasonal predictability over Asia.
HOW SNOW FORMS?
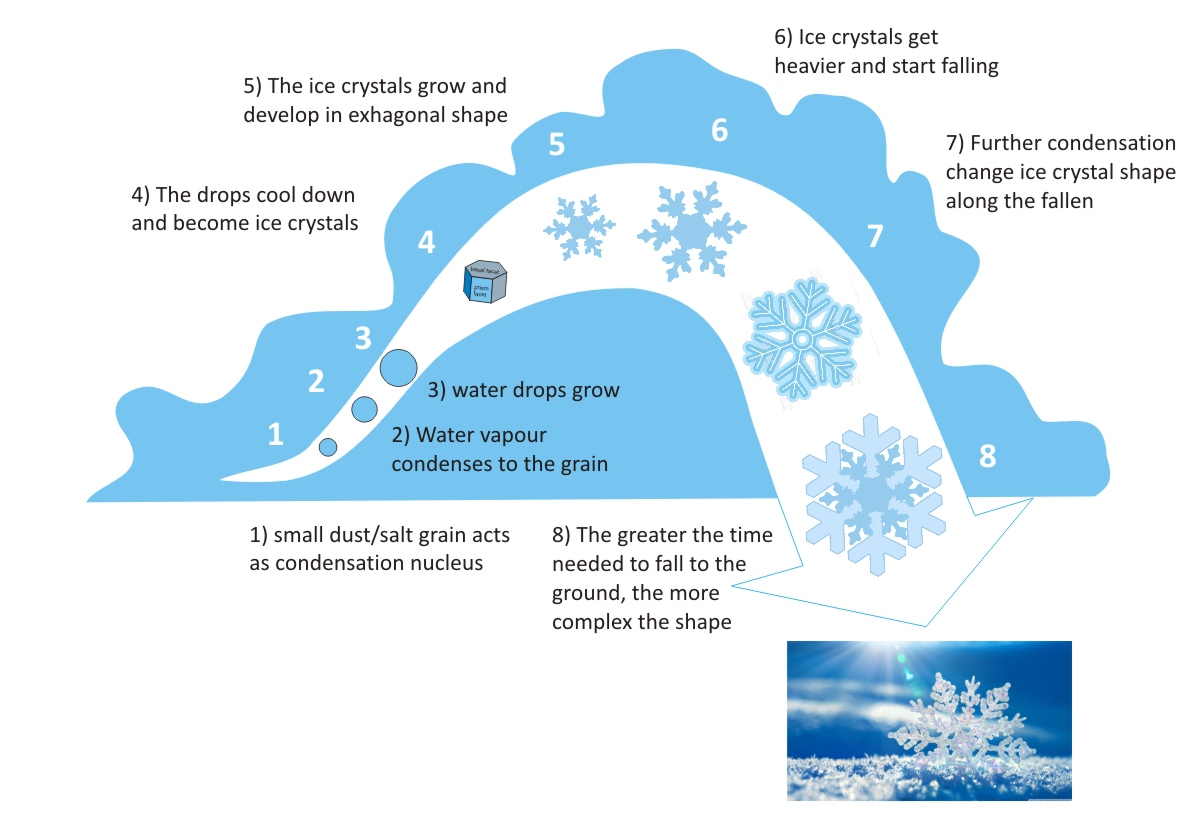
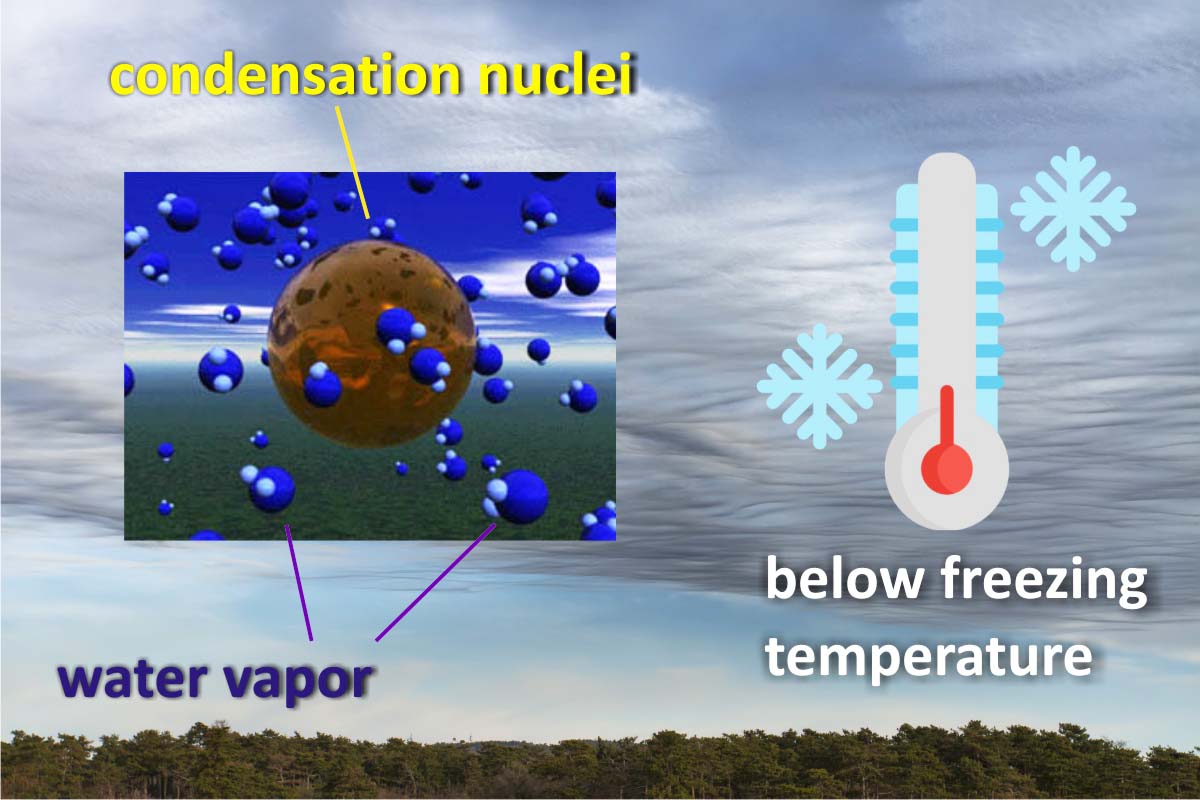
Clouds form when water vapor, which is an invisible gas, condenses and turns into liquid water droplets or ice crystals. To do so, water vapor needs to stick to the so-called condensation nuclei. When water vapor in the atmosphere condenses directly into ice, bypassing the liquid phase, the resulting forms are properly called snow crystals.
The word “snowflake” is a more general meteorological term, used to describe several different types of winter precipitation. Snowflakes are anything from individual snow crystals to agglomerations of many crystals that collide and stick together, falling to earth as flimsy puffballs. Snowflakes that descend through moist air that is slightly warmer than 0 °C will melt around the edges and stick together to produce big flakes. In the image below you can visualize the eight main steps from the first tiny ice crystal to the composite snowflake.
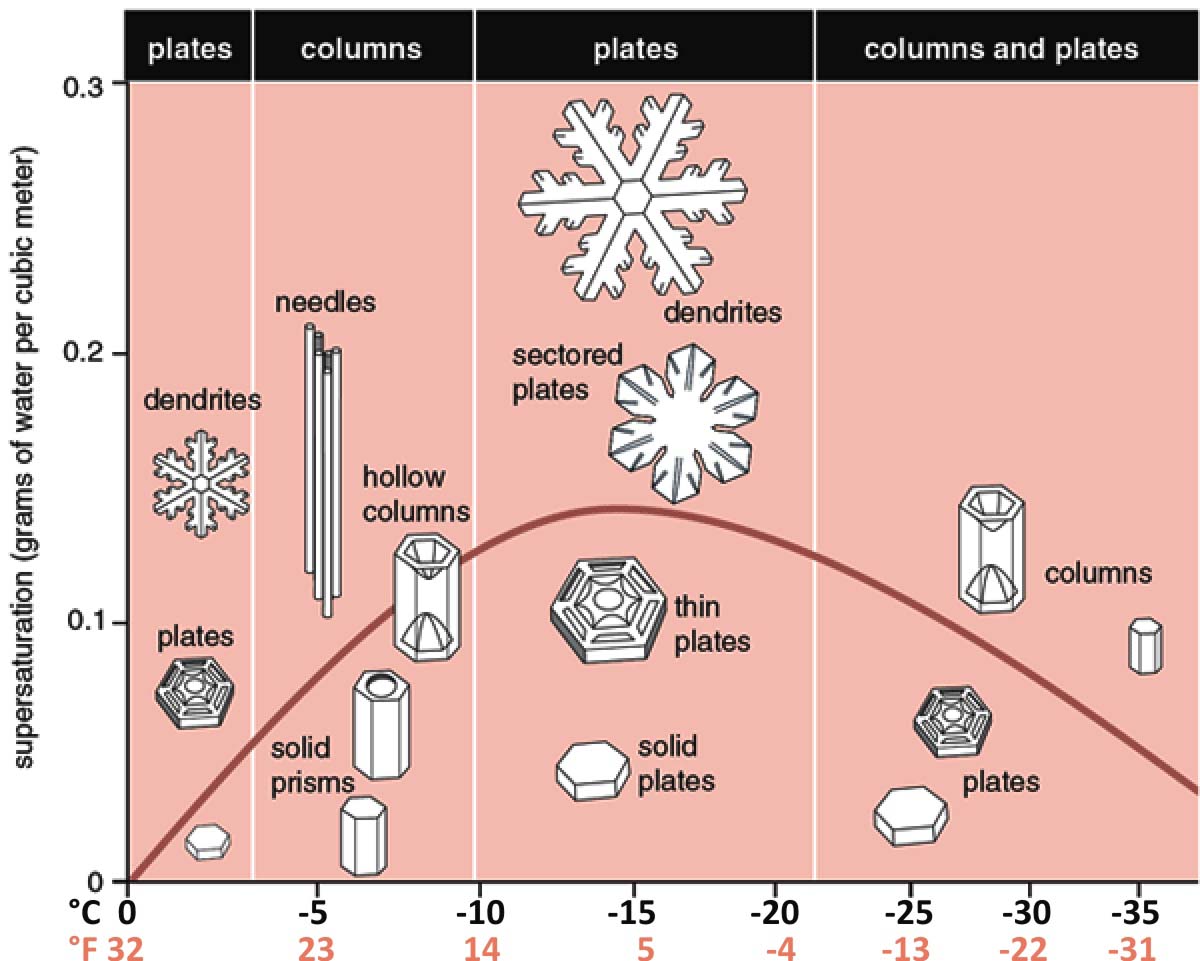
Although the general theory is well known, the formation of atmospheric snow crystals still remains a largely unsolved problem. The morphology diagram below qualitatively describes the growth of snow crystals as a function of temperature and water vapor supersaturation.
Snowflake shape strictly depends on temperature formation. Thin, flat, stellar-dendrite snow crystals are almost always taken in a narrow temperature range near −15°C. Slender columnar and needle-like crystals appear only when the temperature is near −5°C. Composite snow crystal types, like the capped column, form when growth conditions change as the crystal develops. No matter the temperature at the ground surface, the shape of a snowflake depends on conditions in the cloud.
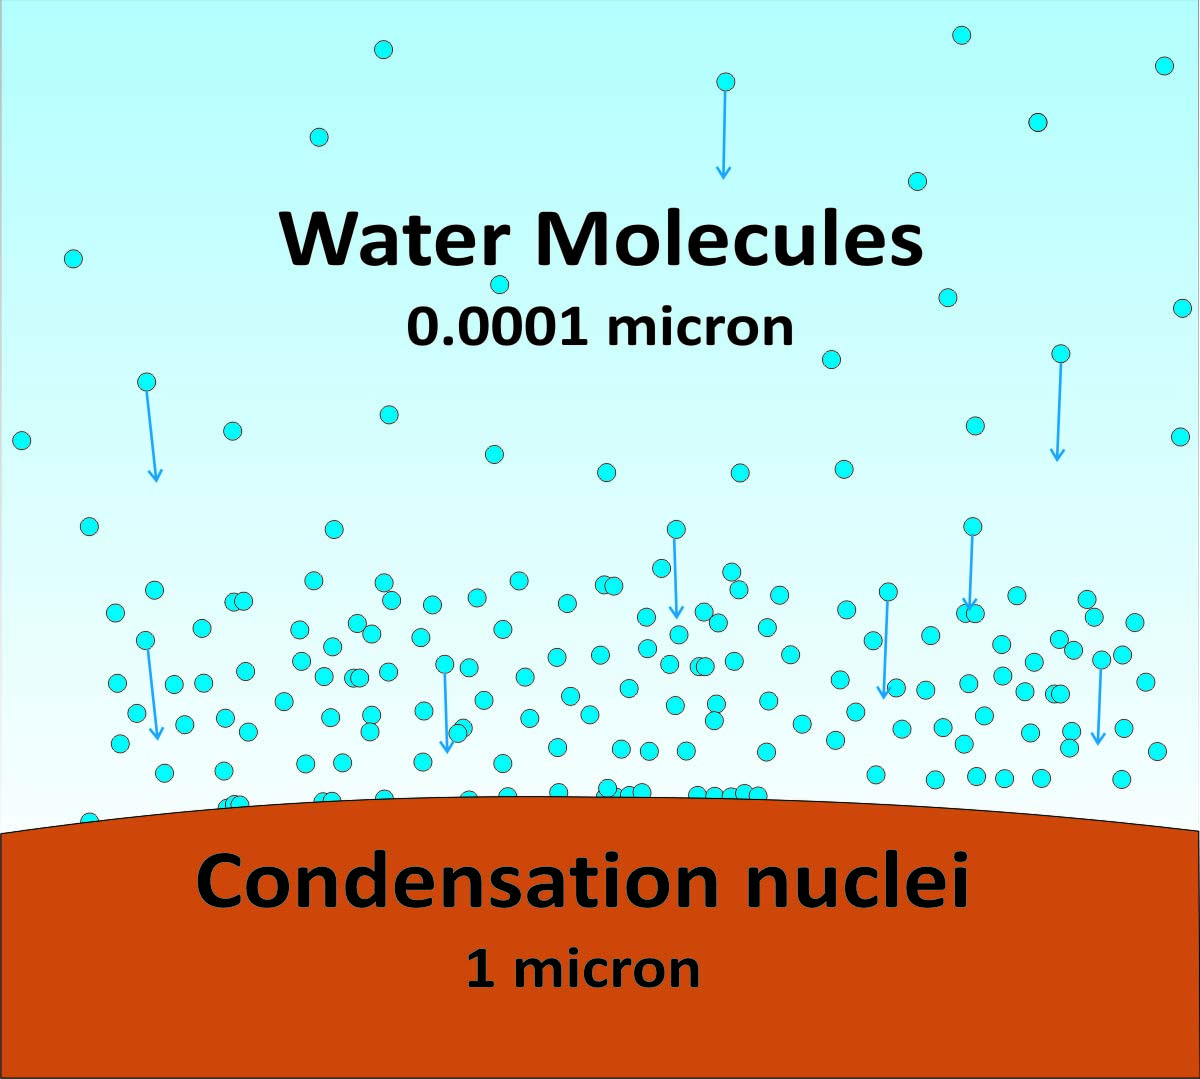
Hygroscopic nuclei have sizes from 0.01 to 10 micrometers. One micrometer, also commonly known as a micron, is equal to one millionth of a millimeter or 39 millionths of an inch. In the classification by size, the smallest is called Aitken nuclei having diameters less than 0.4 micrometers with concentrations of 1000-5000 every cubic centimeter. One cubic centimeter is roughly equal to 0.06 cubic inch. They are so small that a high degree of supersaturation is required for the vapor condenses on them.
Large nuclei, on the other hand, have diameters 0.4-1 micrometer and concentrations of a few hundred per cubic centimeter. Giant nuclei have diameters of 1-10 micrometers and concentrations of just 0.1-1 per cubic centimeter. In the picture below you have an idea of how small are the water molecules when compared to condensation nuclei.
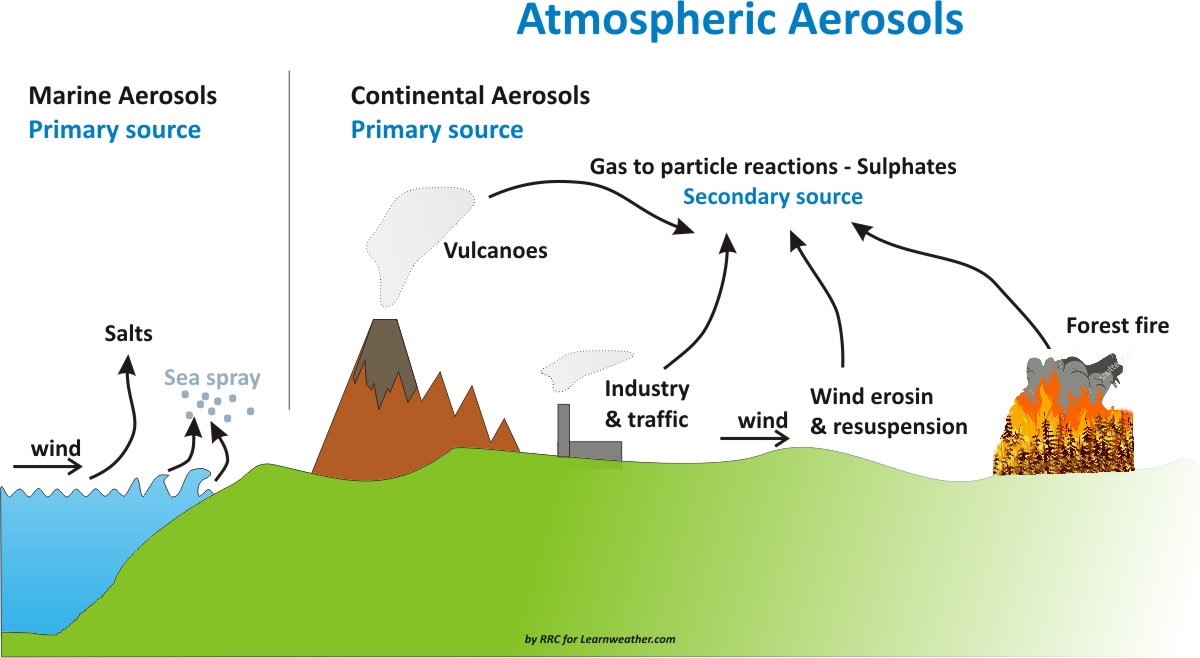
The main group of hygroscopic nuclei is salt whose main source is obviously the sea when the waves break. Their concentration increases with increasing wind speed on which the wave motion depends. Equally numerous droplets of salt water are expelled into the atmosphere by intense evaporation when the lava of some effusive volcanoes like in Hawaii reaches the sea surface.
Another group of nuclei is all those particles composed of sulfates present in the atmosphere as products of the combustion of other substances.
The particles that the winds remove from the ground constitute a third important source of nuclei. Those with diameters greater than 10-20 micrometers fall quickly to the ground due to their weight, while the smaller ones can be transported to great heights and large distances.
Now, not all winter solid precipitation during extreme events falls to the ground as snow. A winter storm is a weather event where the precipitation is mainly snow, sleet, or freezing rain. Often coupled with strong winds and below-freezing temperatures, winter storms can be dangerous.
In the winter, most precipitation forms as snow within the clouds because temperatures at the top of the storm are cold enough to make snowflakes as we saw above. Winter storms begin with moist air rising up into the atmosphere, just like other types of storms. Rising air is common at a cold front, where warm air is lifted above cold air and is necessary for cloud formation and precipitation.
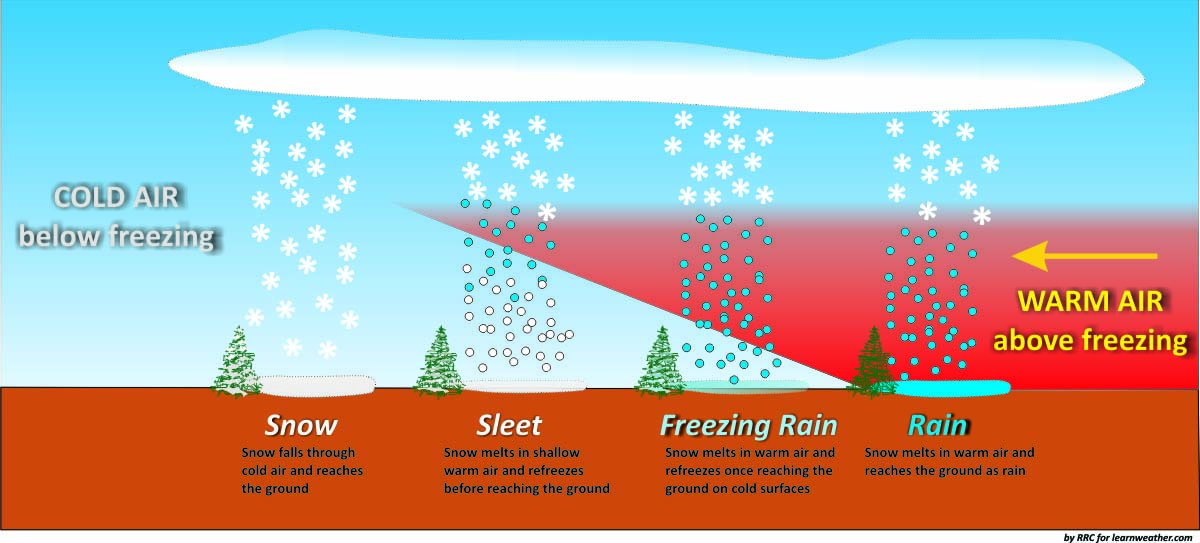
In the image above we show different types of winter precipitation. Besides snowfalls, sleet forms when the snowflakes falling towards the surface first pass through a layer of air that is above freezing temperature. This causes the snowflakes to partially melt, and then pass through a layer of air that is below freezing temperature. The snowflakes re-freeze into pellets of ice before falling to the ground.
Similar to sleet formation, freezing rain forms when snow passes through a layer of warmer air, allowing it to become rain, and then through a layer of much colder air. The rain is not able to re-freeze through the shallow layer of cold air near the surface. The rain is supercooled through this process and freezes instantly upon contact with cold surfaces.
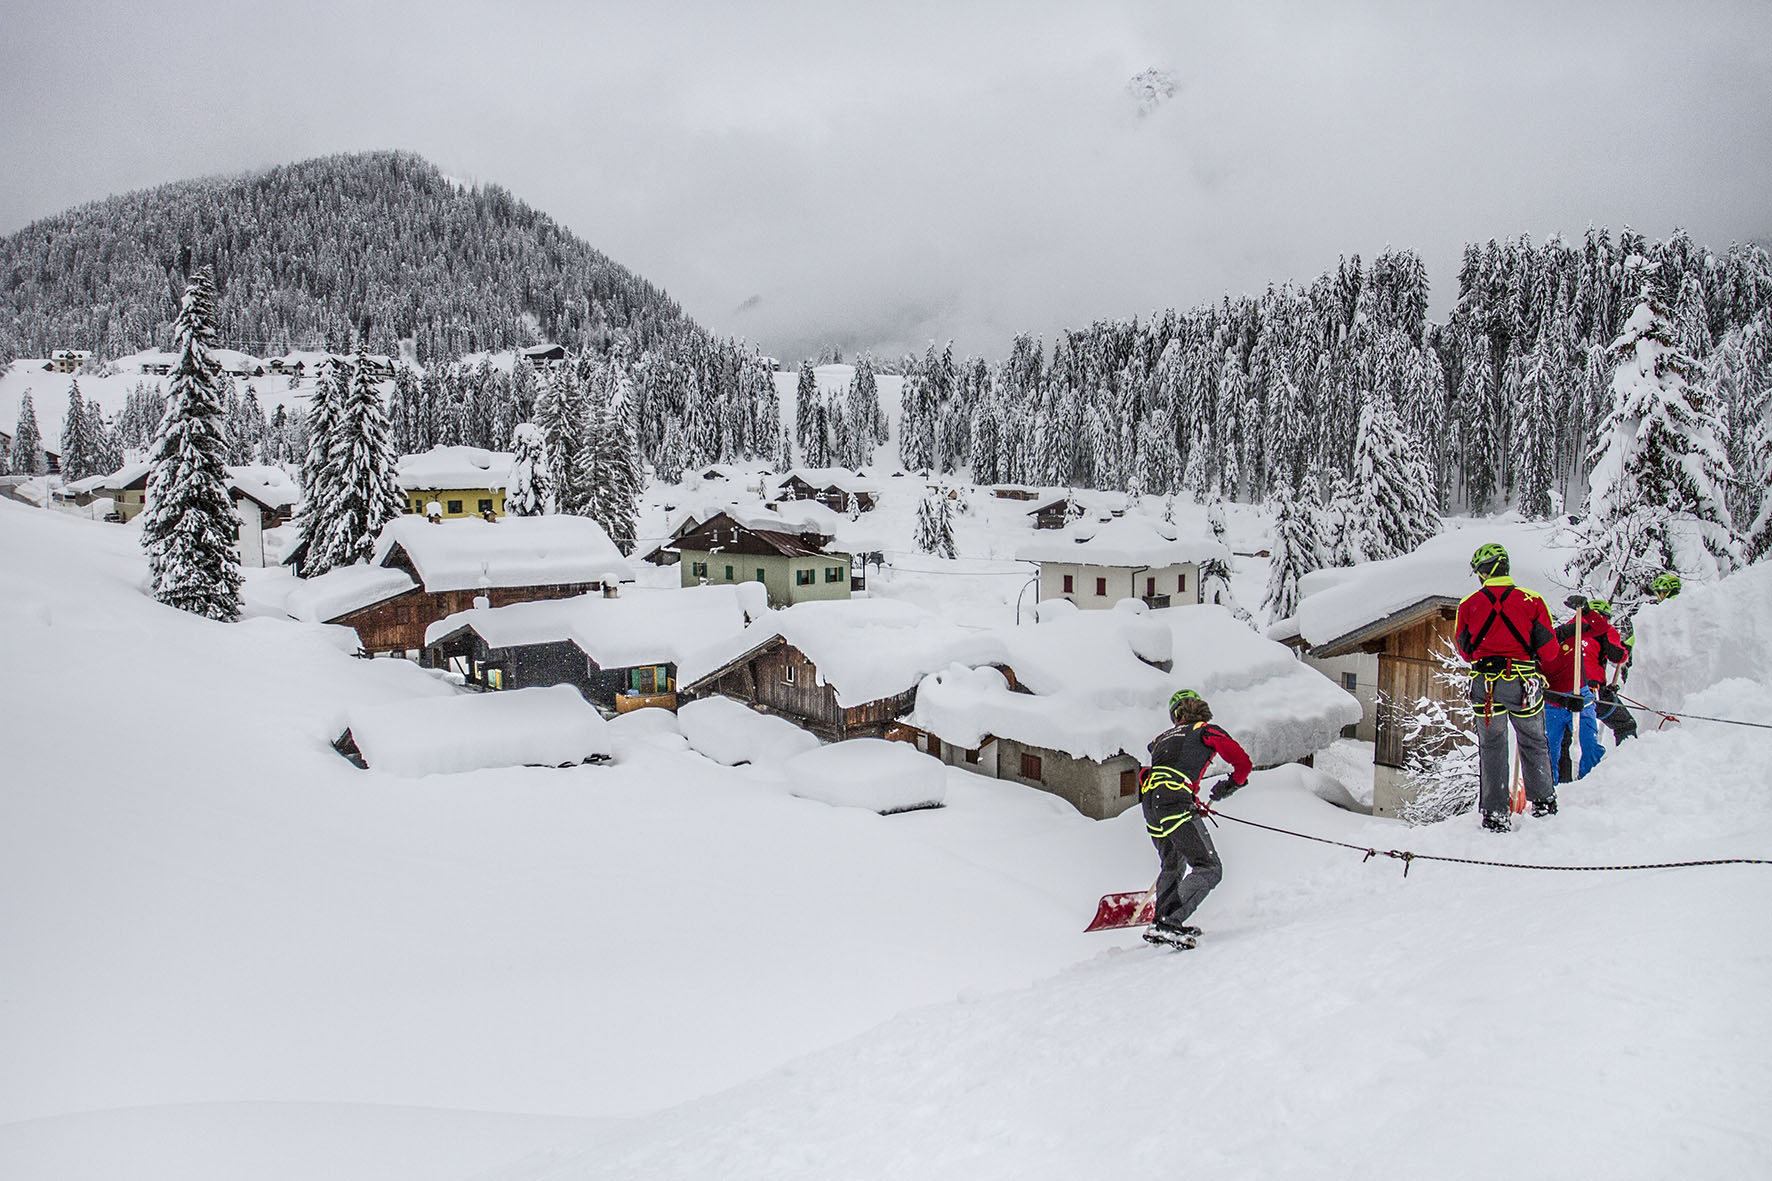
extreme snowfall in the Alps around the town of Sappada in January 2021. Photo credits Renato R. Colucci
Extreme snowfall events remain a major damaging category of extreme weather events, particularly in the northern hemisphere. Extreme Snowfall is a distinct case of precipitation since the predicted strengthening of the hydrological cycle allows for potentially more snowfall, as long as the temperature remains sufficiently cold for snow to occur.
These contrasting forces lead to a difference between forecasts of a significant decrease in mean snowfall, and a much less noticeable decrease, or even increase, in extreme snowfalls. In order to properly understand how such apparently conflicting mechanism works, it is first useful to review how solid precipitation forms and occurs. The three ingredients for snow to form are below-freezing temperatures, condensation nuclei, and water vapor in the air.
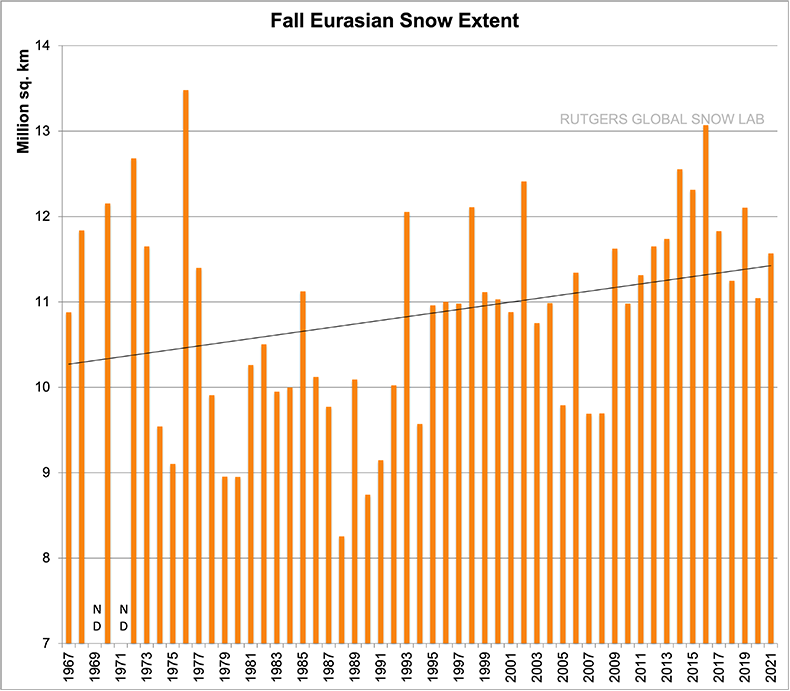
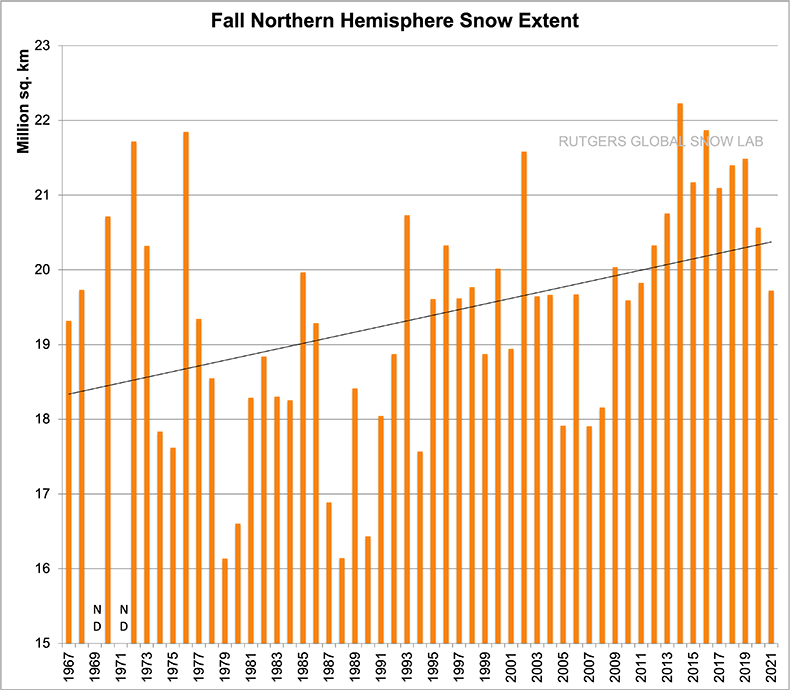
FALL SNOW EXTENT IS INCREASING LATELY
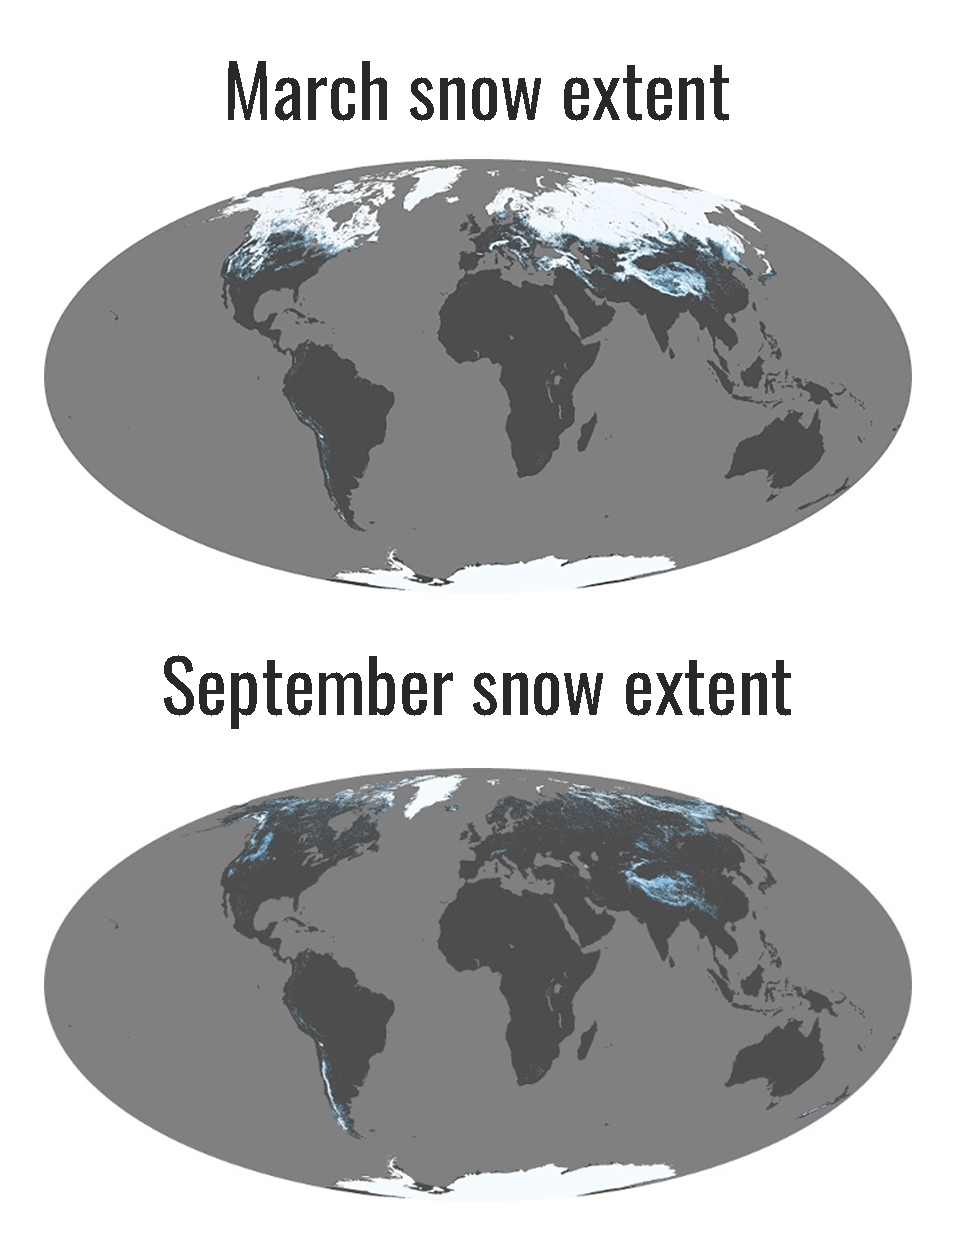
Apparently, what we are observing this year seems to fit with the recent trend in Fall Snow Extent observed both in North America and Eurasia. As can be seen from the images below showing the snow extent in Eurasia, in the late 1960s the average was slightly above 10 million square kilometers, while now increased by about 1 million square kilometers in Eurasia.
In North America, the snow extent in Fall raised from a bit more than 8 million square kilometers to a bit less of 9 million square kilometers. Overall, the Fall Northern Hemisphere snow extent increased by about 2 million square kilometers, from a bit more than 18 million square kilometers to a bit more than 20 million square kilometers. Nevertheless, the annual variability is very large.
A larger-than-usual snow extent in the Northern Hemisphere at the end of the Autumn is surely a good start for the upcoming winter season. Nevertheless, several factors have to be taken into account. Snow extent is not enough to ensure a cold start of the winter season itself although it represents a useful piece of the puzzle if other events will lead to arctic outbreaks in Europe and North America.
We will keep you updated on this and much more, so make sure to bookmark our page. Also, if you have seen this article in the Google App (Discover) feed or social media, click the like button (♥) to see more of our forecasts and our latest articles on weather and nature in general.