By Physicist Dr. Ralph Alexander
You’ve probably heard that methane, one of the minor greenhouse gases, allegedly makes an outsized contribution to global warming. But the current obsession with methane emissions is totally unwarranted and based on a fundamental misunderstanding of basic physics.
This misconception has been explained in detail by atmospheric physicists William Happer and William van Wijngaarden, in a recent summary of an extensive paper being prepared for a research publication. Happer is an emeritus professor at Princeton University with over 200 scientific papers to his credit, while van Wijngaarden is a professor at York University in Canada. The new paper compares the radiative forcings – disturbances that alter the earth’s climate – of methane (CH4) and carbon dioxide (CO2).
The largest source of CH4 in the atmosphere is emissions from cows and other livestock, in burps from animal mouths during rumination – not farts, as is popularly believed – together with decay of animal dung. Natural gas is mostly CH4, and large quantities of CH4 are sequestered on the seafloor as methane clathrates.
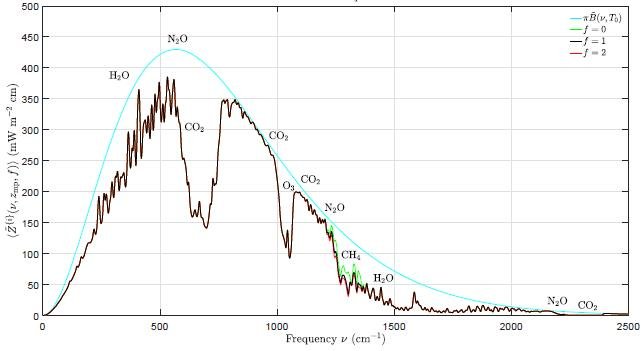
Hype about the impact of CH4 on climate change abounds, both in the media and in pronouncements from scientific organizations. One environmental website claims that “At least 25% of today’s global warming is driven by methane from human actions.” To show how small an effect CH4 actually has on global warming in comparison with CO2, Happer and van Wijngaarden have calculated the outgoing radiation spectrum for various greenhouse gases at the top of the atmosphere.
The calculated spectrum is shown in the figure below, as a function of wavenumber or spatial frequency. The blue curve is the spectrum for an atmosphere with no greenhouse gases at all, while the black curve is the spectrum including all greenhouse gases. Removing the CH4 results in the green curve; the red curve, barely distinguishable from the black curve, represents a doubling of the CH4 concentration from its present 1.9 ppm to 3.8 ppm.

The tiny decrease in area underneath the curve, from black to red, as the CH4 level is doubled corresponds to a total forcing increase of 0.8 watts per square meter. This increase in forcing, which decreases the earth’s cooling radiation emitted to space and thus results in warming, is trivial compared with the total greenhouse gas forcing of about 140 watts per square meter at the top of the troposphere, or 120 watts per square meter at the top of the whole atmosphere.
The 25% attribution of global warming to CH4 that I mentioned above probably comes from comparing its 0.8 watts per square meter forcing increase for doubled CH4 to the 3 watts per square meter additional forcing for doubling of CO2, which I discussed in a previous post – 0.8 being approximately 25% of 3. However, the fallacy in such a comparison is that it completely ignores the much smaller concentration of CH4 relative to CO2, and a much smaller rate of increase from year to year.
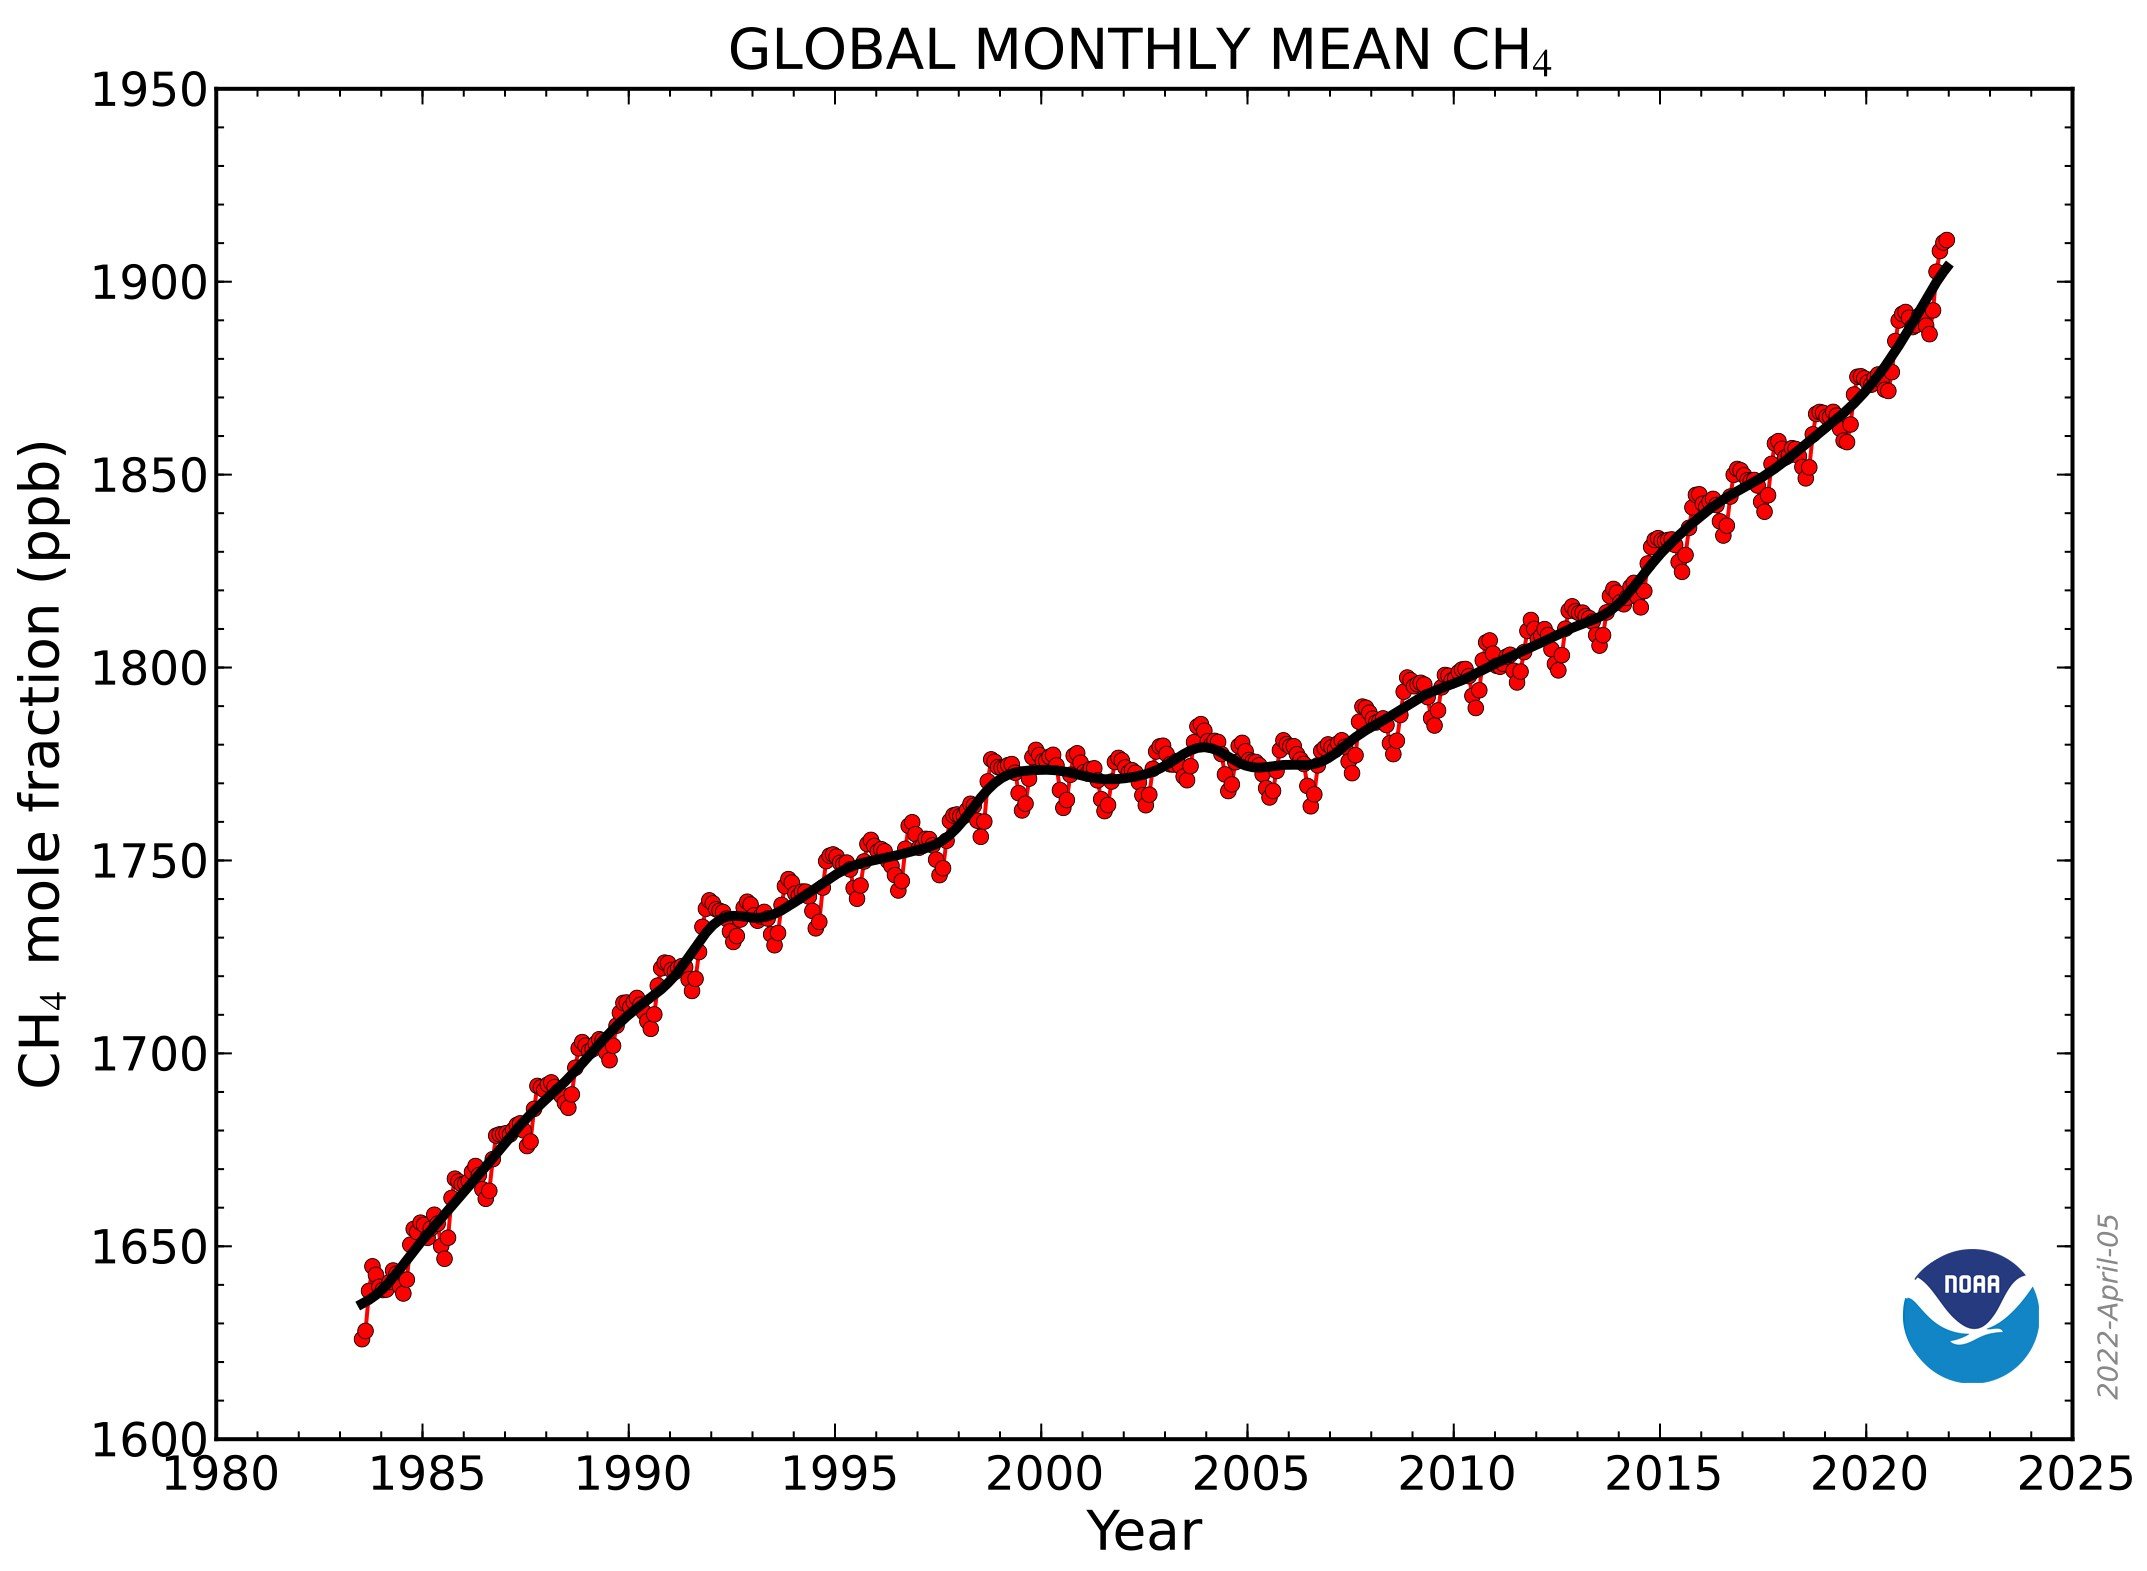
The yearly abundance of CH4 in the atmosphere since 1980, as measured by NOAA (the U.S. National Oceanic and Atmospheric Administration), is depicted in the next figure. Currently, the CH4 concentration is about 1.9 ppm (1900 ppb), two orders of magnitude lower than the CO2 level of approximately 415 ppm.

Combining the forcing calculations with the concentration data, the forcing per added molecule for CH4 is about 30 times larger than it is for CO2. But the rate of increase in the CH4 level over the last 10 years, of about 0.0076 ppm (7.6 ppb) per year, is about 300 times smaller than the rate of increase in the CO2 level, which is around 2.3 ppm per year. This means the contribution of CH4 to the annual increase in forcing is only 30/300 or one tenth that of CO2.
Although the CH4 concentration increased at a faster rate in 2020 and 2021, the rate has fluctuated in the past, both speeding up and slowing down (from 2000 to 2008, for example) for years at a time – as you can see from the figure above. But even if the rate were to permanently double, the CH4 contribution to the forcing increase would still be just one fifth (0.2) of the CO2 contribution. That’s nowhere near NOAA’s contention that “methane is roughly 25 times more powerful than carbon dioxide at trapping heat in the atmosphere.”
It won’t be any different in the future. Using average rates of increase for CH4 and CO2 concentrations from the past, Happer and van Wijngaarden have evaluated forcings at the top of the troposphere for the next 50 years, as shown in the following figure; the forcings are increments relative to today.

As can be seen, both projected forcings will still be small a half century from now. Panic over methane (or CO2) is completely unnecessary.


