Clutz on sea levels: “Altimetry Estimates Are Unreliable. Tidal Gauges show slow, steady coastal rise. Land subsiding or rebounding Makes Local Differences. There was an adjustment made to the dataset, and the “acceleration” comes by starting from the dip in 2013.”

On Temperatures: “Amid numerous periods of warming and cooling, hidden is the fact that Alpine glaciers were much smaller in the past, as evidenced by higher tree lines previous to the modern era.”
“99% of the world land ice is on top of Antarctica (88%) and Greenland (11%). All the fuss in the media above concerns fluctuations in less than 1% of glacier mass. Seen in the context of annual ranges of temperatures, a rise of 1 degree Celsius over 150 years would escape our notice were it not for alarmists constantly beating drums about it…

The geological and paleontological evidence overwhelmingly says that today’s average global temperature of about 15 degrees C and CO2 concentrations of 420 ppm are nothing to fret about. Even if they rise to about 17–18 degrees C and 500–600 ppm by the end of the century, it may well balance or improve the lot of mankind…Planetary temperatures have been far higher than today, both long ago (over 600 million years) and recently (last 10,000 years) with no doomsday loop occurring.

On CO2 levels: “It is claimed global warming is a one-way street from rising GHGs, when in fact higher CO2 concentrations are a consequence and by-product, not a driver and cause, of the current naturally rising temperatures…The alleged harm from CO2 is from warming, and the warming observed is much, much less than predictions. In fact, warming as small as we are observing is almost certainly beneficial.”
On Ocean acidification: “The claim that the surface-water of the oceans has declined in pH from 8.2 to 8.1, since the industrial revolution, is based on sparse, contradictory evidence, at least some of which is problematic computer modeling.”
https://rclutz.com/2022/05/21/un-false-alarms-from-key-climate-indicators/
By
The Climate Crisis du jour comes from the World Meteorological Organization (WMO) public relations (PR) announcement Four key climate change indicators break records in 2021.
As we shall see, each of them, along with other WMO claims, depends on first buying the story of global warming/climate change, and then looking at the world in a myopic, lop-sided way to confirm an alarmist POV. Below are discussions of the main points from this latest attempt to monger fear in support of the IPCC agenda.
Sea Level Rise is Accelerating! Not.
WMO says: Global mean sea level reached a new record high in 2021, after increasing at an average 4.5 mm per year over the period 2013 -2021. This is more than double the rate of between 1993 and 2002 and is mainly due to the accelerated loss of ice mass from the ice sheets. This has major implications for hundreds of millions of coastal dwellers and increases vulnerability to tropical cyclones.
WMO Proof:
 Rational Response
Altimetry Estimates Are Unreliable
Tidal Gauges show slow, steady coastal rise
Land subsiding or rebounding Makes Local Differences
The claim of accelerating sea level rise depends on estimates from satellites regarding the entire ocean, such as this one:

There was an adjustment made to the dataset, and the “acceleration” comes by starting from the dip in 2013. Moreover, this is a highly processed reconstruction that is contradicted by tidal gauge measurements at the coastlines where people live and where the issue matters. For example, take New York City, where J. Hansen predicted flooding by 2009:

Already in 2021, observations have diverged greatly from the model-projected sea level rise, and there are many other examples confirming this. And do remember the longer range perspective on sea levels:

Earth’s Cryosphere is Melting! Not.
WMO Says: Cryosphere: Although the glaciological year 2020-2021 saw less melting than in recent years, there is a clear trend towards an acceleration of mass loss on multi-decadal timescales. On average, the world’s reference glaciers have thinned by 33.5 meters (ice-equivalent) since 1950, with 76% of this thinning since 1980. 2021 was a particularly punishing year for glaciers in Canada and the US Northwest with record ice mass loss as a result of heatwaves and fires in June and July. Greenland experienced an exceptional mid-August melt event and the first-ever recorded rainfall at Summit Station, the highest point on the ice sheet at an altitude of 3 216 m.
Rational Response
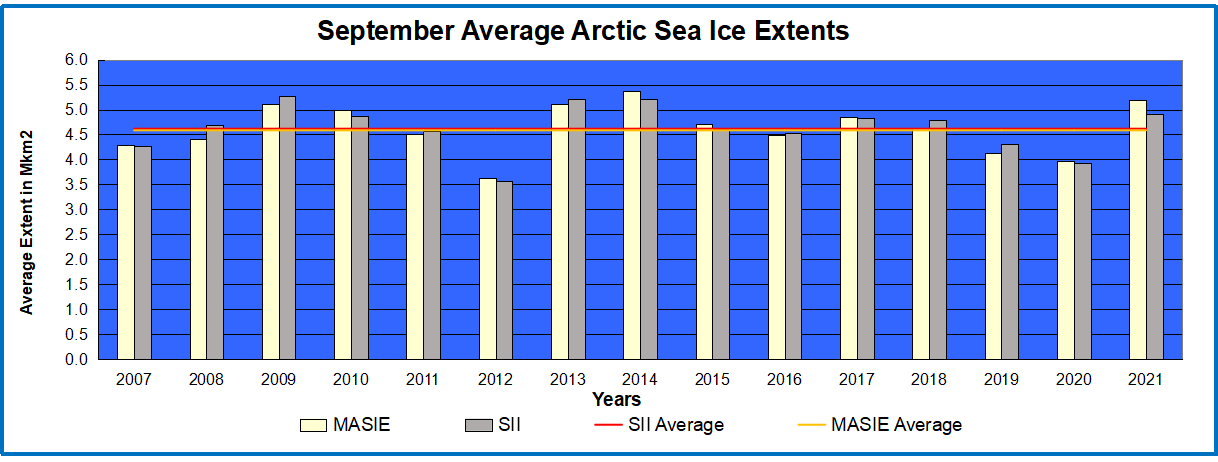
The warning about coastal flooding is based on fears that the sea will rise because frozen water will be added to the current ocean volume. A lot of reporting claims Arctic Sea Ice is retreating, not mentioning this is drift ice, floating on water, and thus not a threat to increase water volume. Even so, the quasi-60 year cycle of Arctic ice extents has been flat since it’s most recent bottom in 2007.
More pertinent is the concerns raised over land-based ice that does have the potential to add water to the ocean. For perspective, consider this:
![]()
To consider the impact of the above ice sheet melting, compare the thickness of the Laurentide ice sheet with some of our civilization’s landmarks (H/T RiC Communications):

With much ado about any retreat of land glaciers, no matter how small or short-lived, many people are unaware of the natural range of glacier fluctuations. For example, alpine glaciers:

Amid numerous periods of warming and cooling, hidden is the fact that Alpine glaciers were much smaller in the past, as evidenced by higher tree lines previous to the modern era.
The great majority of land ice is located firstly upon Antarctica, and secondly on Greenland. While there are fluctuations up and down, the trend is far from certain, and very small compared to the mass of these two ice sheets.
A recent study by Bamber et al. provides perspectives on the amplitude of ice sheet changes:

Here the realities are obvious 99% of the world land ice is on top of Antarctica (88%) and Greenland (11%). All the fuss in the media above concerns fluctuations in less than 1% of glacier mass. Secondly, the bottom line is should present melt rates continue ( a big if ) the world would lose 3% of land ice in 1000 years. Note also the wide range of estimates of the smallest category of glaciers, and also the uncertain reported volume change for East Antarctica. Note that the melt rates are for 2012 to 2016, leaving out lower previous rates and periods when ice mass gained.
Global Temperatures are Going Ever Higher! Not.
WMO says: The global annual mean temperature in 2021 was around 1.11 ±0.13 °C above the 1850-1900 pre-industrial average, less warm than some recent years owing to cooling La Niña conditions at the start and end of the year. The most recent seven years, 2015 to 2021, are the seven warmest years on record.
Rational Response:
Seen in the context of annual ranges of temperatures, a rise of 1 degree Celsius over 150 years would escape our notice were it not for alarmists constantly beating drums about it.
The geological and paleontological evidence overwhelmingly says that today’s average global temperature of about 15 degrees C and CO2 concentrations of 420 ppm are nothing to fret about. Even if they rise to about 17–18 degrees C and 500–600 ppm by the end of the century, it may well balance or improve the lot of mankind.
After all, bursts of civilization during the last 10,000 years uniformly occurred during the red portions of the graph below. The aforementioned river civilizations—the Minoan, the Greco-Roman era, the Medieval flowering, and the industrial and technological revolutions of the present era. At the same time, the several lapses into the dark ages happened when the climate turned colder (blue).
And that’s only logical. When it’s warmer and wetter, growing seasons are longer, and crop yields are better—regardless of the agricultural technology and practices of the moment. And it’s better for human and community health, too—most of the deadly plagues of history have occurred in colder climates, such as the Black Death of 1344–1350.
Greenhouse Gases Higher Than Ever! Not.
WMO says: Greenhouse gas concentrations reached a new global high in 2020, when the concentration of carbon dioxide (CO2) reached 413.2 parts per million (ppm) globally, or 149% of the pre-industrial level. Data from specific locations indicate that they continued to increase in 2021 and early 2022, with monthly average CO2 at Mona Loa in Hawaii reaching 416.45 ppm in April 2020, 419.05 ppm in April 2021, and 420.23 ppm in April 2022.
Rational Response:
The Radiative effect from increasing CO2 has been saturated, so that the next doubling from 400 to 800 ppm will barely affect temperatures. From William Happer presentation:
 Schwarzschild was the theorist who first figured out how the real Earth, including the greenhouse gases in its atmosphere, radiates to space. That is described by the jagged black line. The important point here is the red line. This is what Earth would radiate to space if you were to double the CO2 concentration from today’s value. Right in the middle of these curves, you can see a gap in spectrum. The gap is caused by CO2 absorbing radiation that would otherwise cool the Earth. If you double the amount of CO2, you don’t double the size of that gap. You just go from the black curve to the red curve, and you can barely see the difference. The gap hardly changes.
Yet, the Climate Crisis Narrative employs two deceptive devices which are contradicted by earth’s climate history:
a. Planetary temperatures have been far higher than today, both long ago (over 600 million years) and recently (last 10,000 years) with no doomsday loop occurring.
b. It is claimed global warming is a one-way street from rising GHGs, when in fact higher CO2 concentrations are a consequence and by-product, not a driver and cause, of the current naturally rising temperatures.
The alleged harm from CO2 is from warming, and the warming observed is much, much less than predictions. In fact, warming as small as we are observing is almost certainly beneficial. It gives slightly longer growing seasons. You can ripen crops a little bit further north than you could before. So, there is completely good news in terms of the temperature directly. But there is even better news. By standards of geological history, plants have been living in a CO2 famine during our current geological period.

The Ocean Is Turning Acid! Not.
WMO says: Ocean acidification. The ocean absorbs around 23% of the annual emissions of anthropogenic CO2 to the atmosphere. This reacts with seawater and leads to ocean acidification, which threatens organisms and ecosystem services, and hence food security, tourism and coastal protection. As the pH of the ocean decreases, its capacity to absorb CO2 from the atmosphere also declines. The IPCC concluded that “there is very high confidence that open ocean surface pH is now the lowest it has been for at least 26,000 years and current rates of pH change are unprecedented since at least that time.”
Rational Response
Firstly ocean pH varies greatly on all time scales. From US Senate testimony:
“In the oceans, major climate warming and cooling and pH (ocean pH about 8.1) changes are a fact of life, whether it is over a few years as in an El Niño, over decades as in the Pacific Decadal Oscillation or the North Atlantic Oscillation, or over a few hours as a burst of upwelling (pH about 7.59-7.8) appears or a storm brings acidic rainwater (pH about 4-6) into an estuary.”
Secondly, sea life is adapted to changing pH, and some prefer more acidic levels. IPCC has ignored extensive research showing positive impacts on marine life from lower pH. These studies are catalogued at CO2 Science with this summary:
There are numerous observations of improvement in calcification of disparate marine life in realistic rates of PH change due to increased CO2.
“In the final graphical representations of the information contained in our Ocean Acidification Database, we have plotted the averages of all responses to seawater acidification (produced by additions of both HCl and CO2) for all five of the life characteristics of the various marine organisms that we have analyzed over the five pH reduction ranges that we discuss in our Description of the Ocean Acidification Database Tables, which pH ranges we illustrate in the figure below.”
“The most striking feature of Figure 11 is the great preponderance of data located in positive territory, which suggests that, on the whole, marine organisms likely will not be harmed to any significant degree by the expected decline in oceanic pH. If anything, in fact, the results suggest that the world’s marine life may actually slightly benefit from the pH decline.”
Finally, massive mineral deposits ensure our ocean will remain non-acidic in coming centuries. At Patrick Moore observed:
“It is a fact that people who have saltwater aquariums sometimes add CO2 to the water in order to increase coral growth and to increase plant growth. The truth is CO2 is the most important food for all life on Earth, including marine life. It is the main food for photosynthetic plankton (algae), which in turn is the food for the entire food chain in the sea.”
Summary:
The claim that the surface-water of the oceans has declined in pH from 8.2 to 8.1, since the industrial revolution, is based on sparse, contradictory evidence, at least some of which is problematic computer modeling. Some areas of the oceans, not subject to algal blooms or upwelling, may be experiencing slightly lower pH values than were common before the industrial revolution. However, forecasts for ‘average’ future pH values are likely exaggerated and of debatable consequences. The effects of alkaline buffering and stabilizing biological feedback loops seem to be underappreciated by those who carelessly throw around the inaccurate term “ocean acidification.”
Footnote on Climate Hype
Alarming claims are usually detected because they involve myopia, an error in perception, combined with lop-sided judgment weighing proportional significance of factors.
- CO2 Alarm is Myopic: Claiming CO2 causes dangerous global warming is too simplistic. CO2 is but one factor among many other forces and processes interacting to make weather and climate.

Myopia is a failure of perception by focusing on one near thing to the exclusion of the other realities present, thus missing the big picture. For example: “Not seeing the forest for the trees.” AKA “tunnel vision.”
2. CO2 Alarm is Lopsided: CO2 forcing is too small to have the overblown effect claimed for it. Other factors are orders of magnitude larger than the potential of CO2 to influence the climate system.

Lop-sided refers to a failure in judging values, whereby someone lacking in sense of proportion, places great weight on a factor which actually has a minor influence compared to other forces. For example: “Making a mountain out of a mole hill.”
To avoid myopia, pay attention to the temporal and spatial contexts for effects discussed. To avoid lop-sided judgment, pay attention to the impact of factors proportional to the baseline inertia of climate system components.

Source: RiC Communicatrions https://www.ric-communications.ch/projekte/simple-science-4