https://link.springer.com/article/10.1140/epjp/s13360-021-02243-9
A critical assessment of extreme events trends in times of global warming
The European Physical Journal Plus volume 137, Article number: 112 (2022)
A critical assessment of extreme events trends in times of global warming
Excerpts:
Abstract
This article reviews recent bibliography on time series of some extreme weather events and related response indicators in order to understand whether an increase in intensity and/or frequency is detectable. The most robust global changes in climate extremes are found in yearly values of heatwaves (number of days, maximum duration and cumulated heat), while global trends in heatwave intensity are not significant. Daily precipitation intensity and extreme precipitation frequency are stationary in the main part of the weather stations. Trend analysis of the time series of tropical cyclones show a substantial temporal invariance and the same is true for tornadoes in the USA. At the same time, the impact of warming on surface wind speed remains unclear. The analysis is then extended to some global response indicators of extreme meteorological events, namely natural disasters, floods, droughts, ecosystem productivity and yields of the four main crops (maize, rice, soybean and wheat). None of these response indicators show a clear positive trend of extreme events. In conclusion on the basis of observational data, the climate crisis that, according to many sources, we are experiencing today, is not evident yet. It would be nevertheless extremely important to define mitigation and adaptation strategies that take into account current trends.
…
To date, global observations do not show any significant trends in both the number and the energy accumulated by hurricanes, as shown in Fig. 1 and as claimed in several specific papers [13] for the USA, which report the trend dating back to over 160 years ago, or for other regions of the globe [14, 15].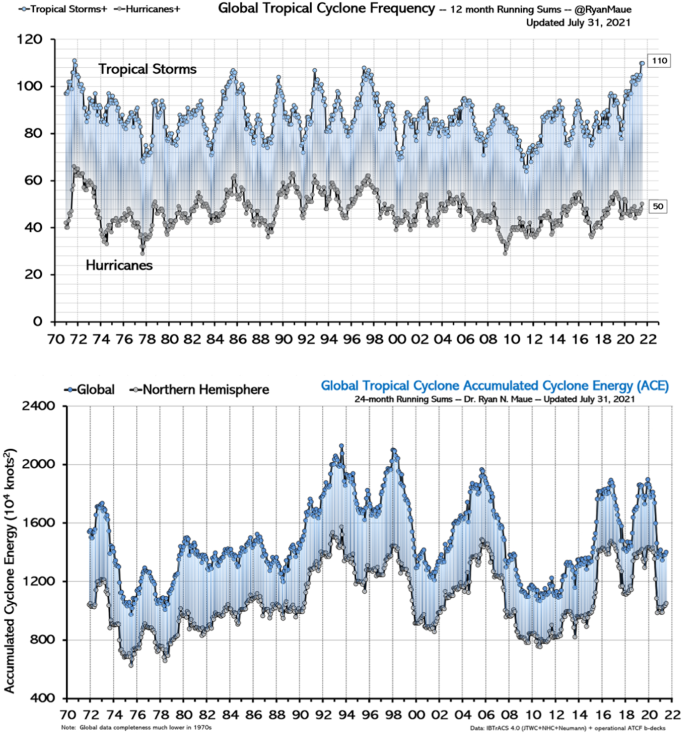
Historical trend of the Tropical Cyclone frequency (above) and accumulated energy ([16]; updated data from http://climatlas.com/tropical/)
…
Particular attention should be paid to the IPCC statement which reports strong increase in the frequency and activity of tropical cyclones in the North Atlantic. To get more information on this issue, NOAA [17] analysed much longer time series (> 100 years) of Atlantic hurricane activity.
Existing records of past Atlantic tropical storms or hurricane numbers (from 1878 to present) indeed show a pronounced upward trend; however, the density of Atlantic shipping reports was relatively low during the first decades of this period: if the storms of the modern era (after 1965) had hypothetically occurred during those decades, a considerable number of storms probably would not have been observed by the naval observation network.
Therefore, after adjusting the time series to take into account the smaller observational capacities of the past, there remains only a small nominally positive upward trend of the tropical storms from 1878 to 2006. Statistical tests indicate that this trend is not significantly distinguishable from zero.
…
Furthermore, Landsea et al. [18] noted that the rising trend in Atlantic tropical storm counts is almost entirely due to the increase in only short-lived storms (< 2 days), which were most likely overlooked in the early parts of the record, as they would have had less opportunity for casual encounters with ship traffic.
If we look at hurricanes in the Atlantic basin, rather than all tropical storms, the result is similar: the reported number of hurricanes during the 1860s and 1880s was similar to nowadays and again there is no significant positive trend since that time. Evidence of an upward trend is even weaker for hurricanes hitting the coast of the USA, which show a slightly negative trend starting in the 1900s or late 1800s.
…
,
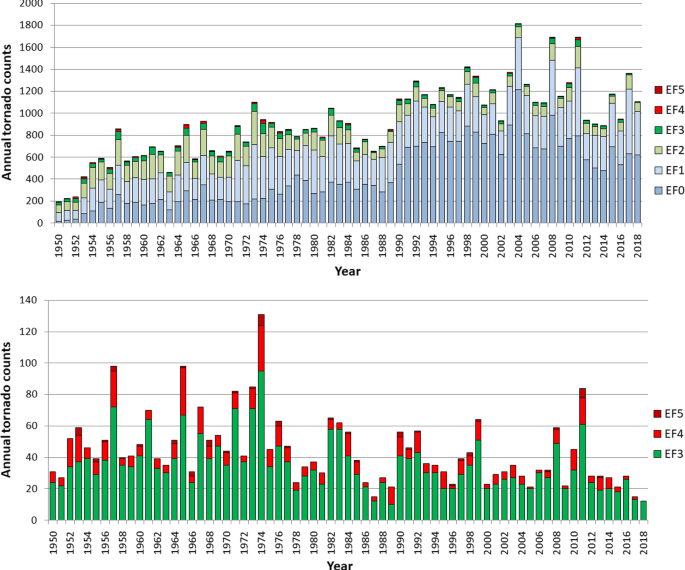
With increased Doppler radar coverage, population growth and increased attention to tornado reports, there has been an increase in the number of tornado reports in recent decades. This can create the misleading appearance of a growing frequency of tornadoes.
However, by consulting the time series shown in Fig. 3 [24], we realize that the increase in the number of tornadoes since 1950 is almost entirely due to weak events (EF0-EF1 in the advanced Fujita scale), those that in the past in many cases escaped the observation and which today are more easily identified thanks to a wide range of systems ranging from cell phone cameras to satellites and Doppler radars. In contrast, strong to violent tornadoes (categories EF-3 to EF-5 on the advanced Fujita scale), likely reported also before the Doppler radar era, show no increase over time.
While the increase in the frequency and persistence of heat waves can easily be explained by increasing global temperatures, the observed increase in tropical cyclones in the North Atlantic, as well as having unclear reasons as claimed by the IPCC [6], seems to be a local phenomenon and substantially due to better reporting as supported by NOAA and as we will better see in the paragraph dedicated to this type of phenomena. In other areas of the planet, a decrease in the same phenomena is observed and in still others no trend is observed, essentially bringing the global evaluations to a substantial temporal invariance.
…
Fearing a climate emergency without this being supported by data, means altering the framework of priorities with negative effects that could prove deleterious to our ability to face the challenges of the future, squandering natural and human resources in an economically difficult context, even more negative following the COVID emergency.