https://realclimatescience.com/2021/08/extreme-fraud-at-noaa/
NOAA’s Climate Extremes Index shows summer afternoon temperatures much above normal are affecting more and more of the US, with the past decade was highest on record.

They show an upwards trend beginning around fifty years ago.

U.S. Climate Extremes Index (CEI) | Extremes | National Centers for Environmental Information (NCEI)
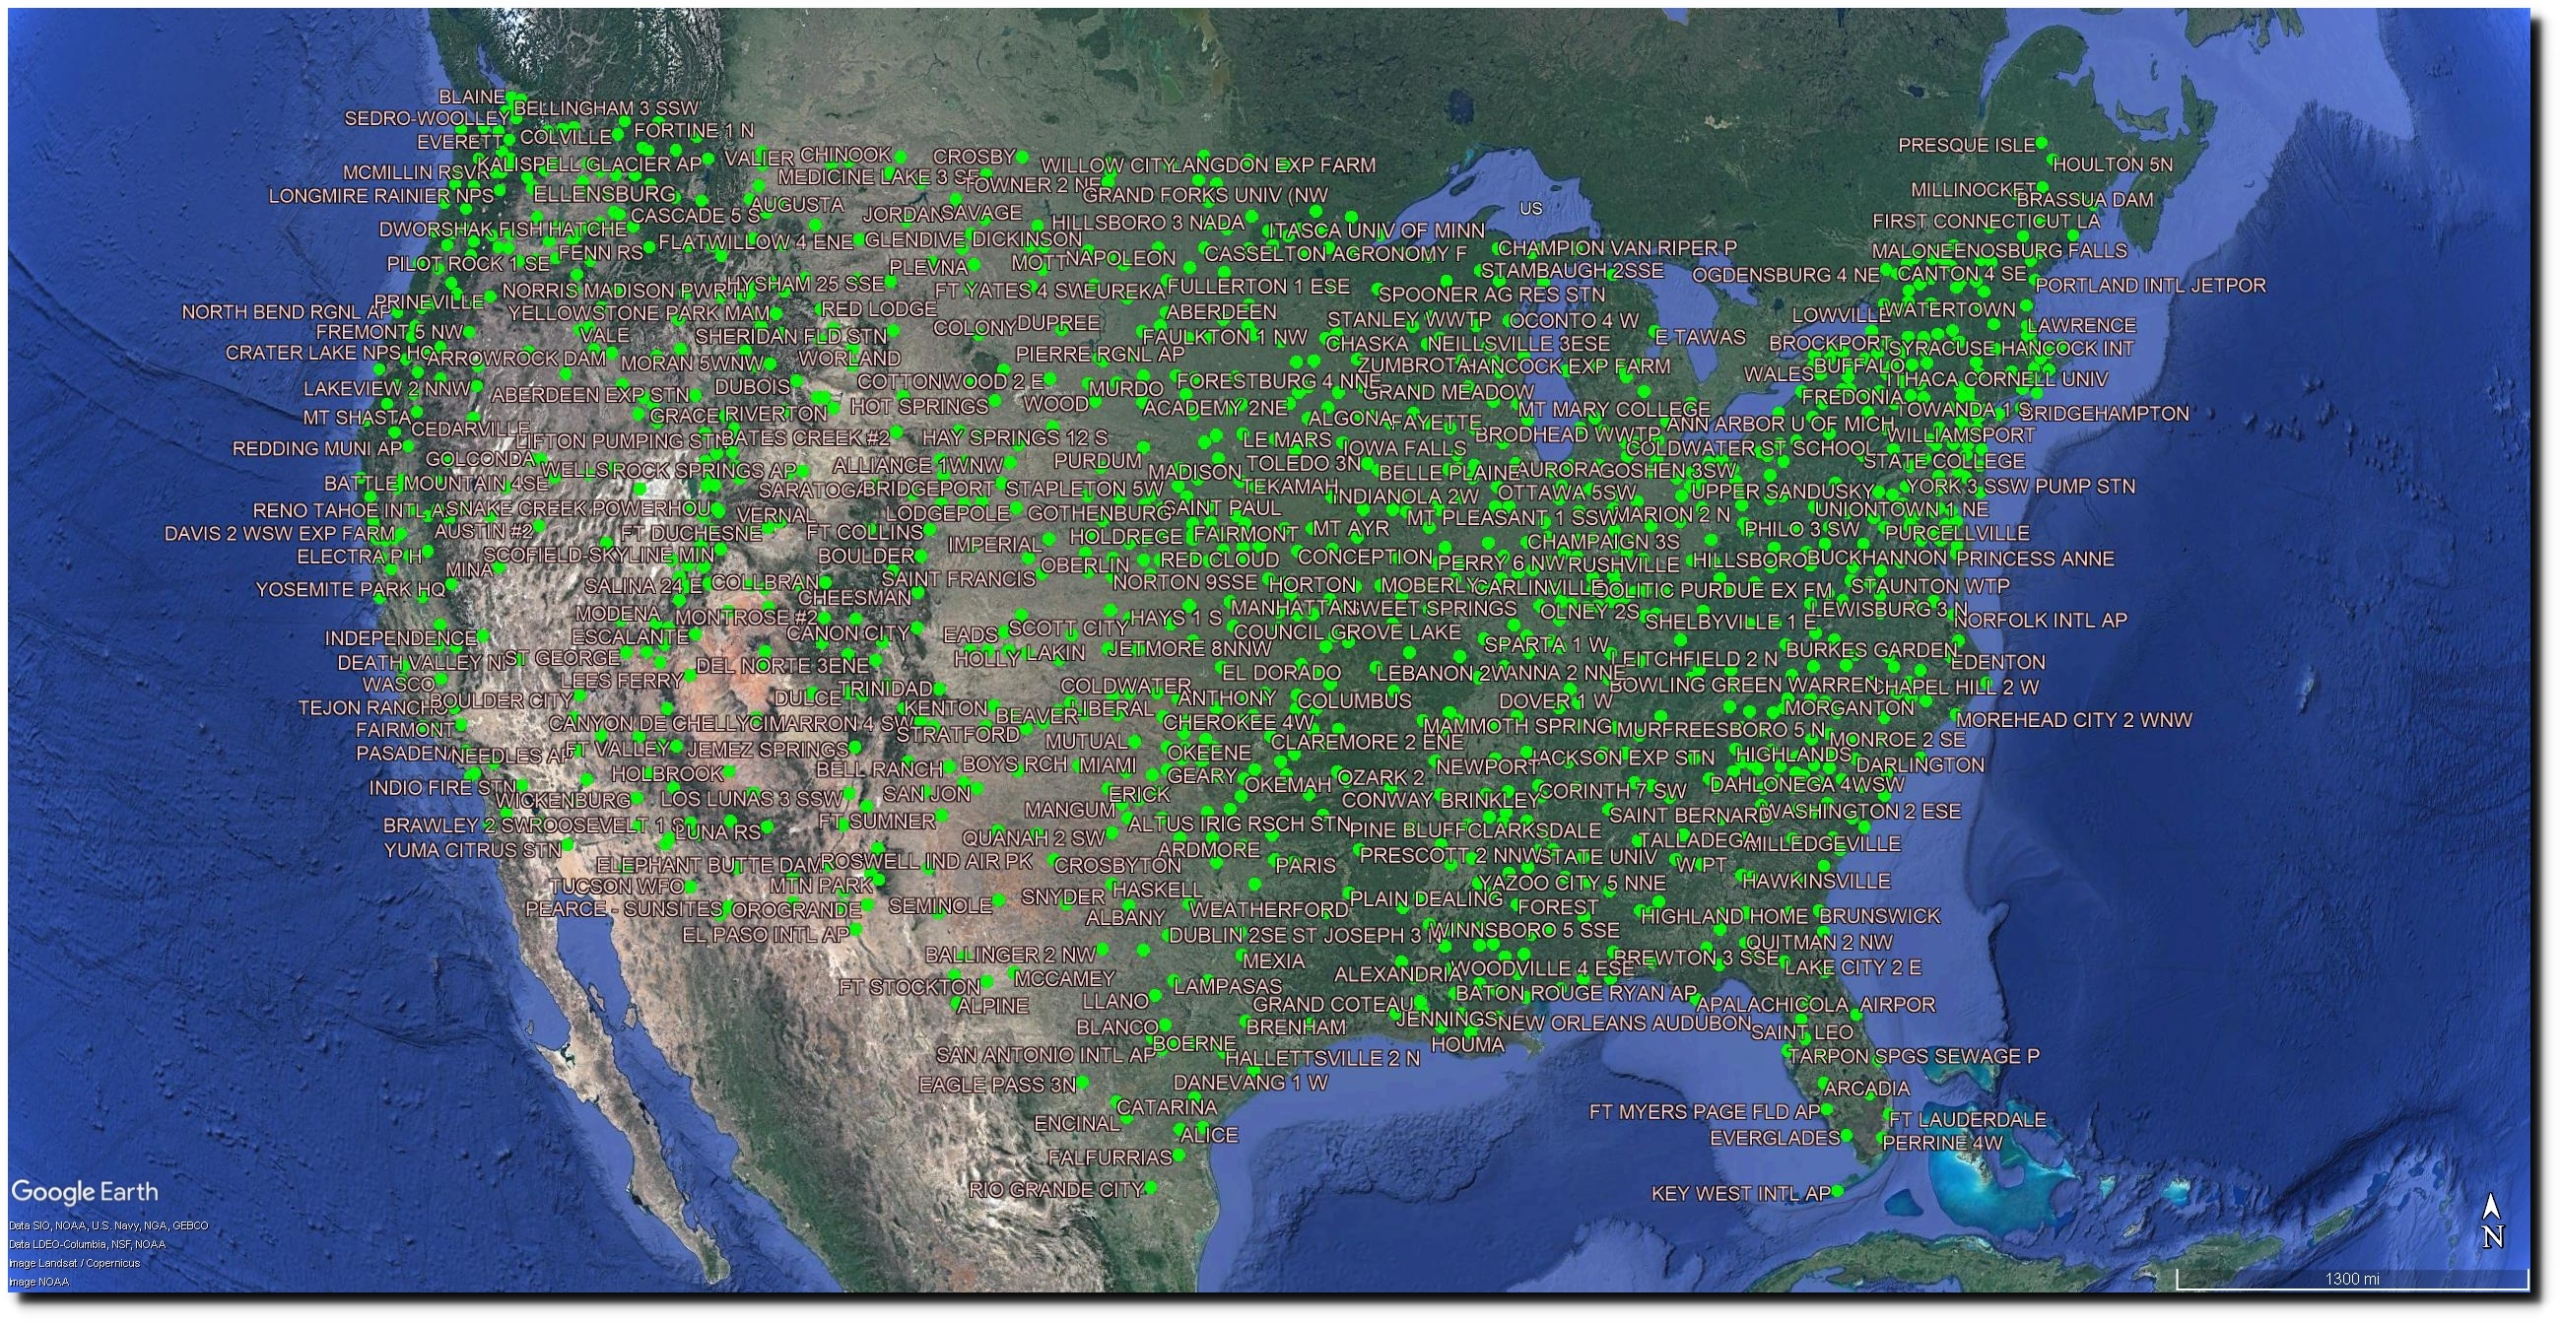
But their thermometer data shows the exact opposite, as does the National Climate Assessment. There are 1,218 stations in the United States Historical Climatology Network.
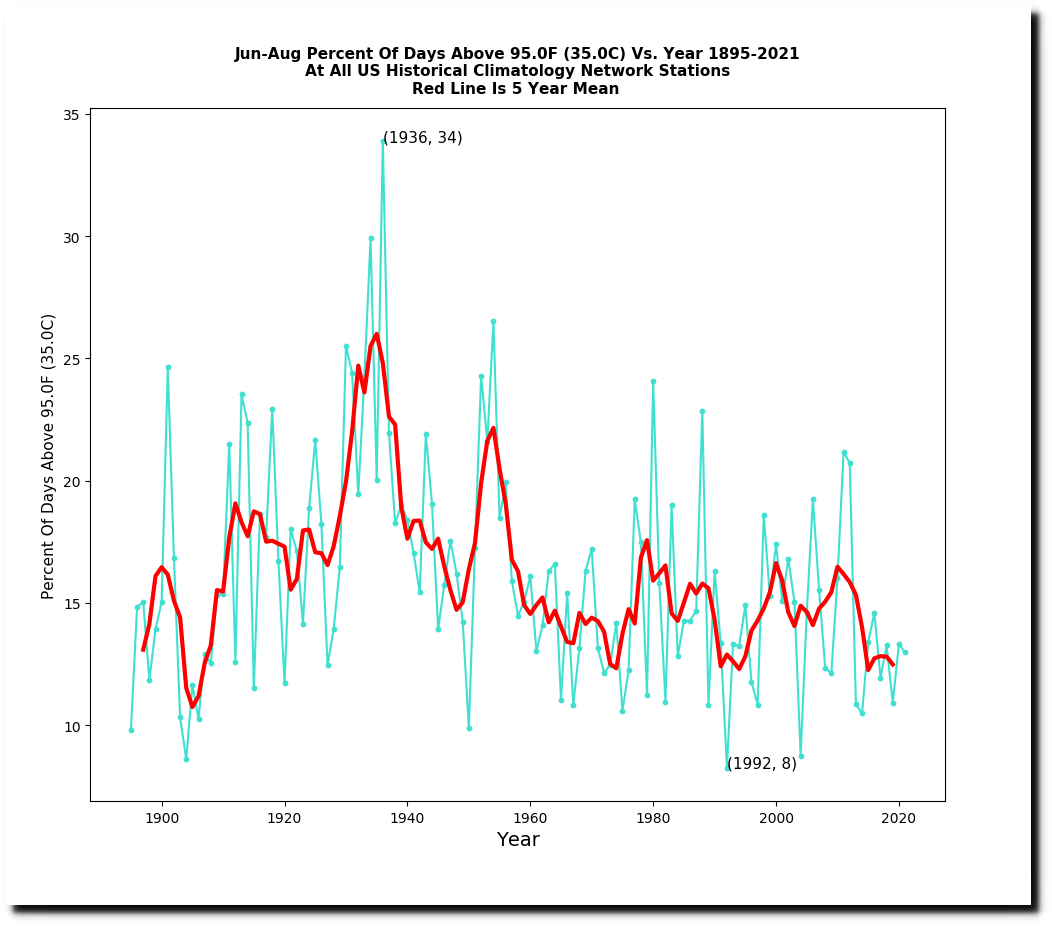
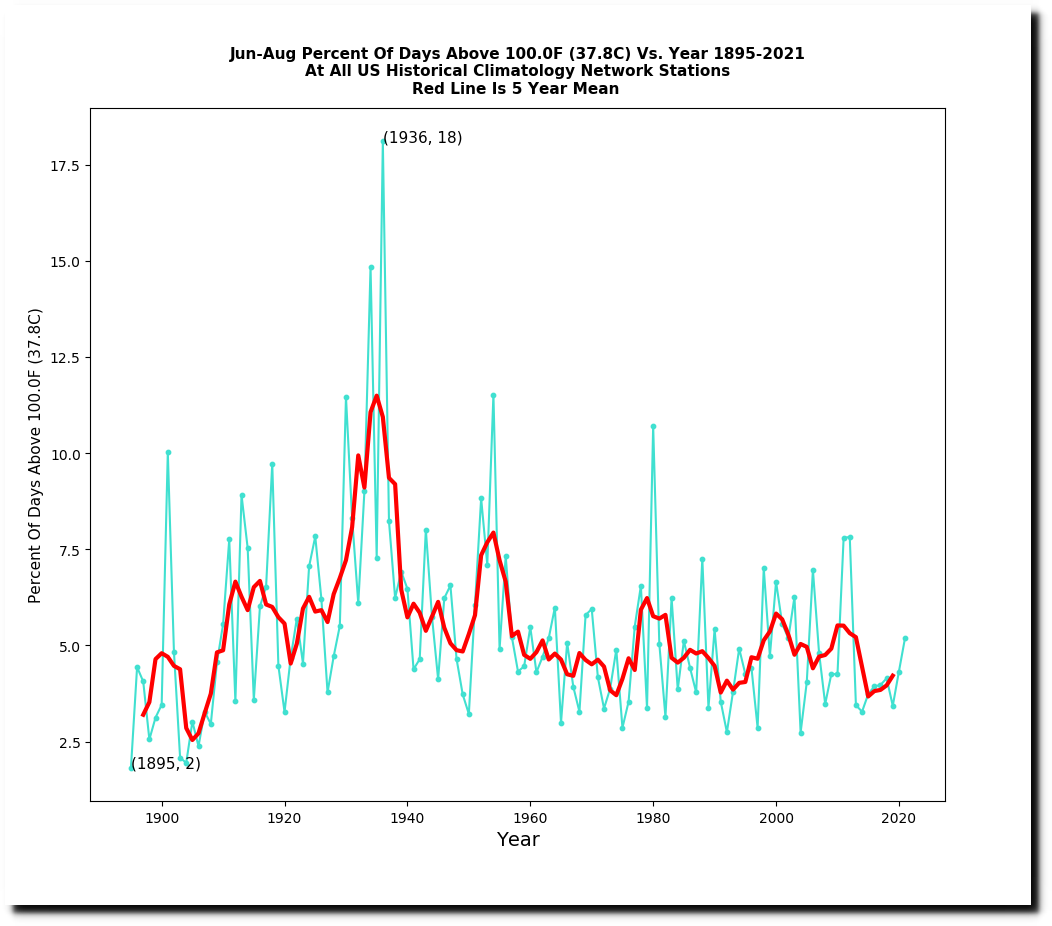
The percentage of stations reaching 95F sometime during the summer has declined sharply over the past ninety years.


So has the frequency of hot days.


Temperature Changes in the United States – Climate Science Special Report
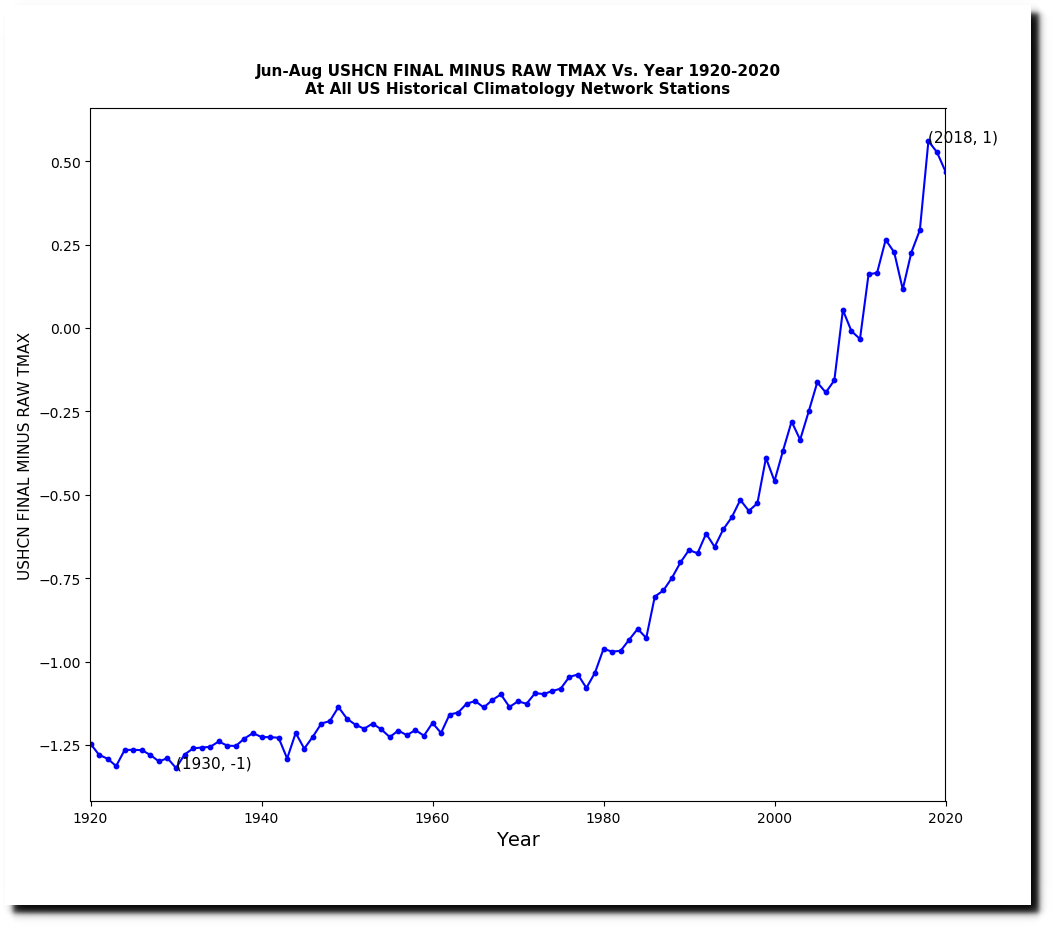
Here is how they reversed the trend. This is the NOAA daily temperature data for the US.

ftp://ftp.ncdc.noaa.gov/pub/data/ghcn/daily/ghcnd_hcn.tar.gz
Their raw monthly data set is nearly identical.
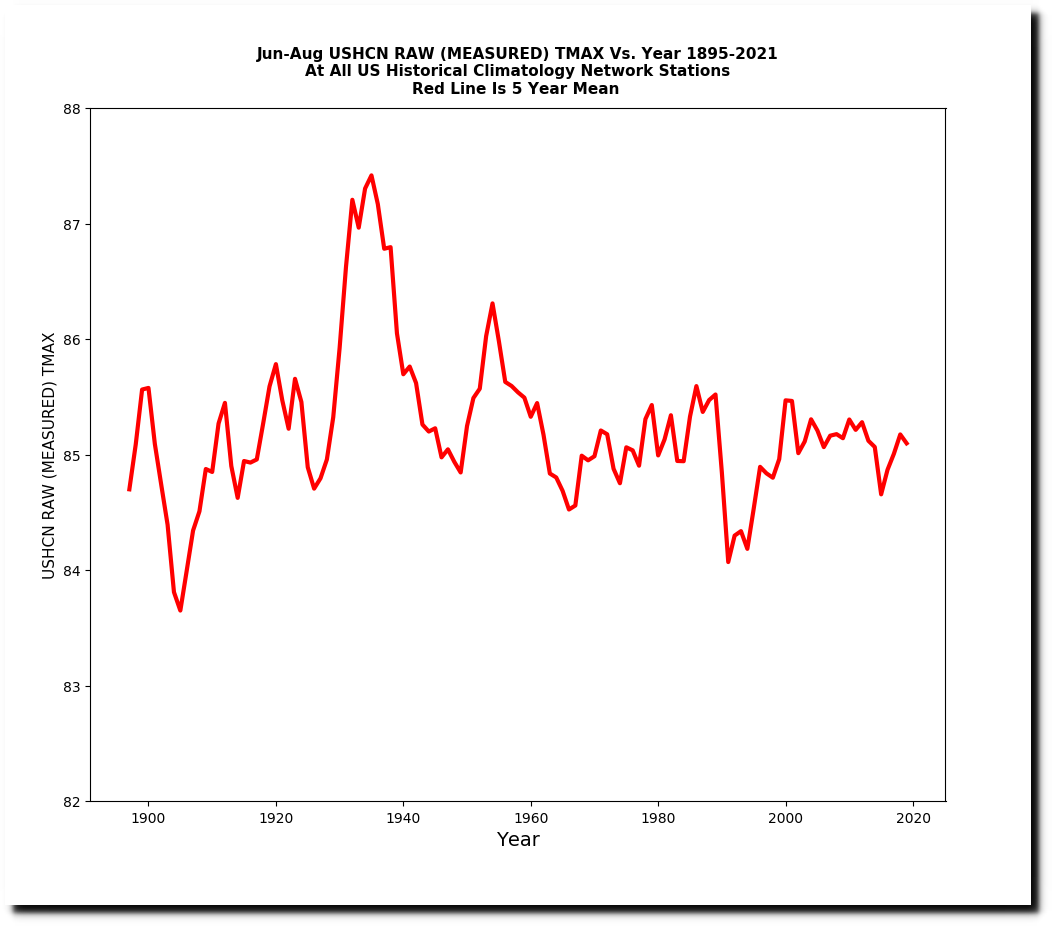
ftp://ftp.ncdc.noaa.gov/pub/data/ushcn/v2.5/ushcn.tmax.latest.raw.tar.gz
Time of Observation Bias adjusted data is not much different.
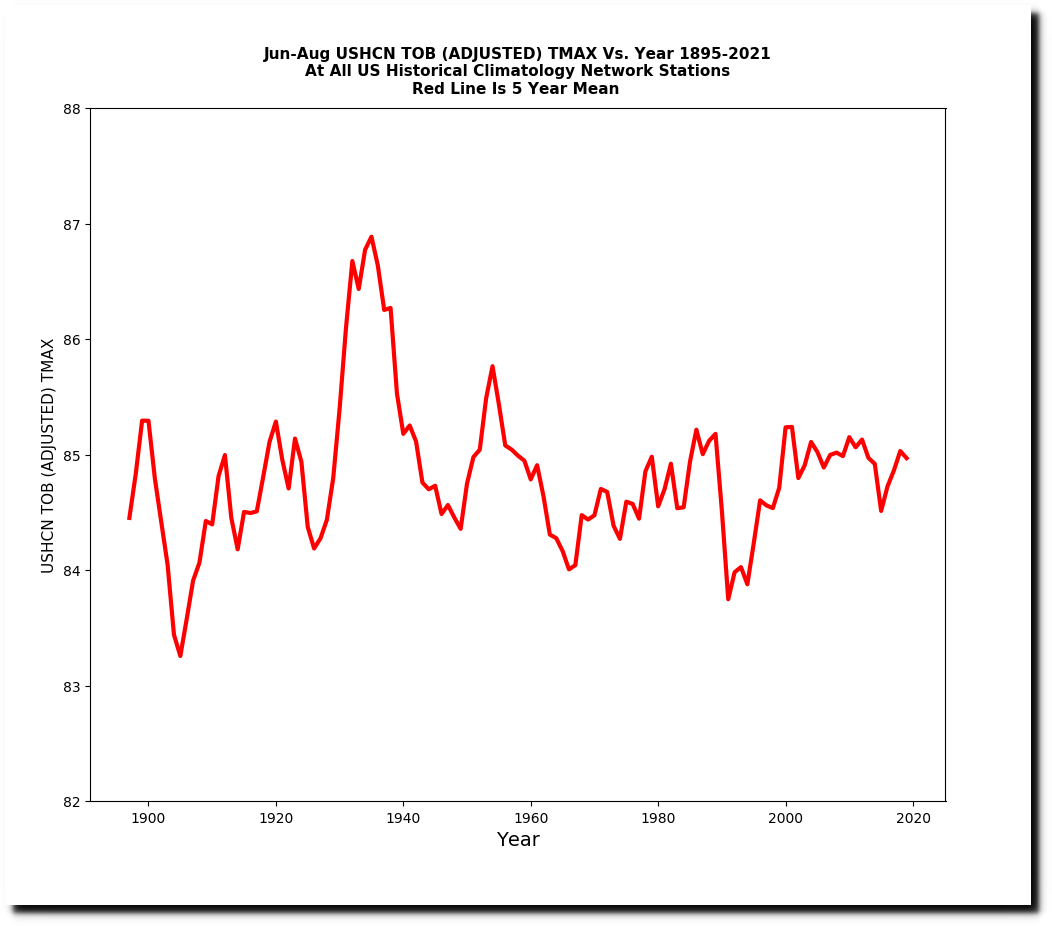
ftp://ftp.ncdc.noaa.gov/pub/data/ushcn/v2.5/ushcn.tmax.latest.tob.tar.gz
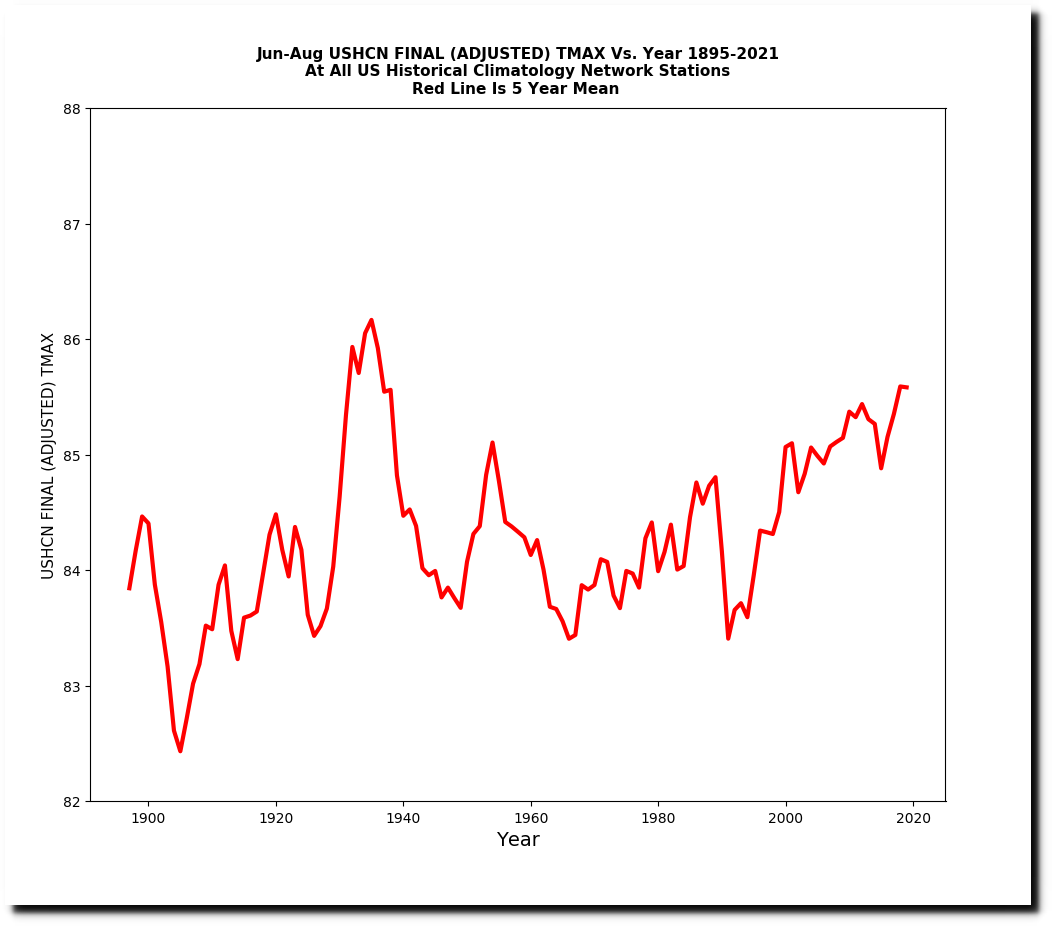
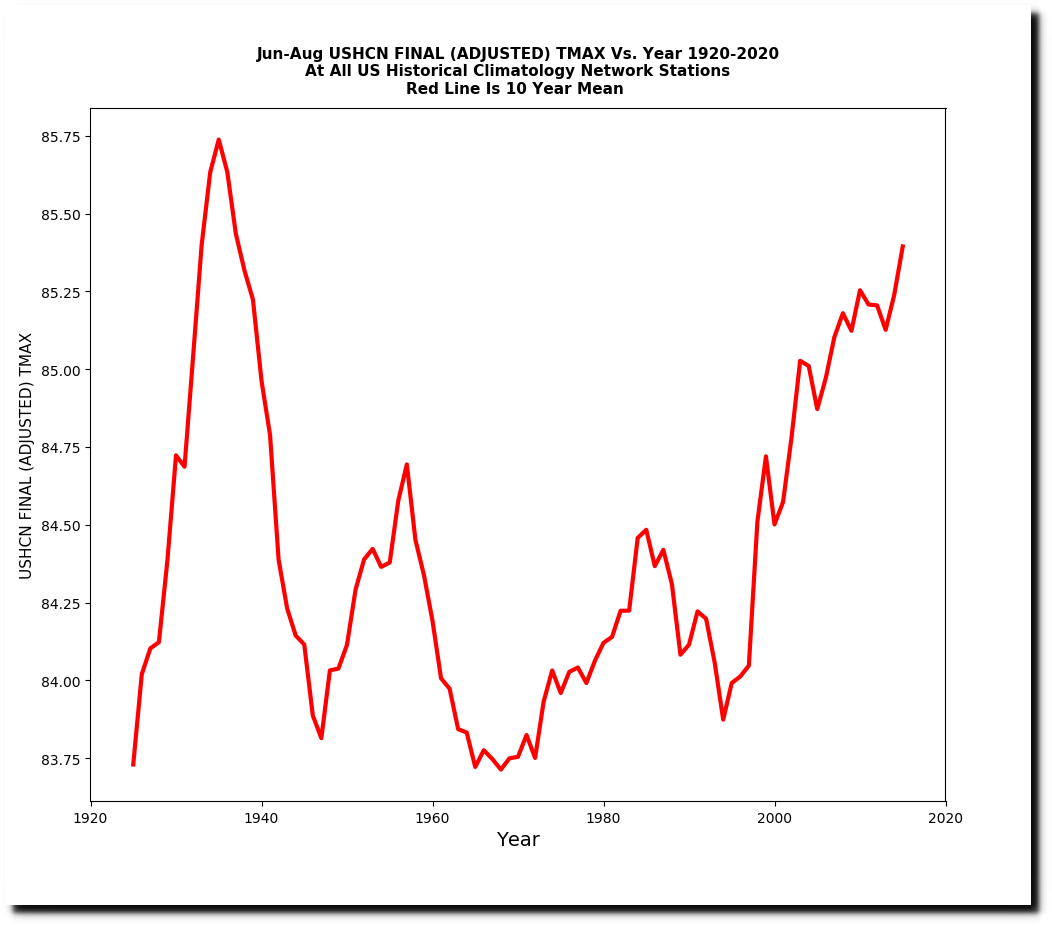
But the final adjusted data set shows a strong warming trend over the past fifty years.
ftp://ftp.ncdc.noaa.gov/pub/data/ushcn/v2.5/ushcn.tmax.latest.tob.tar.gz
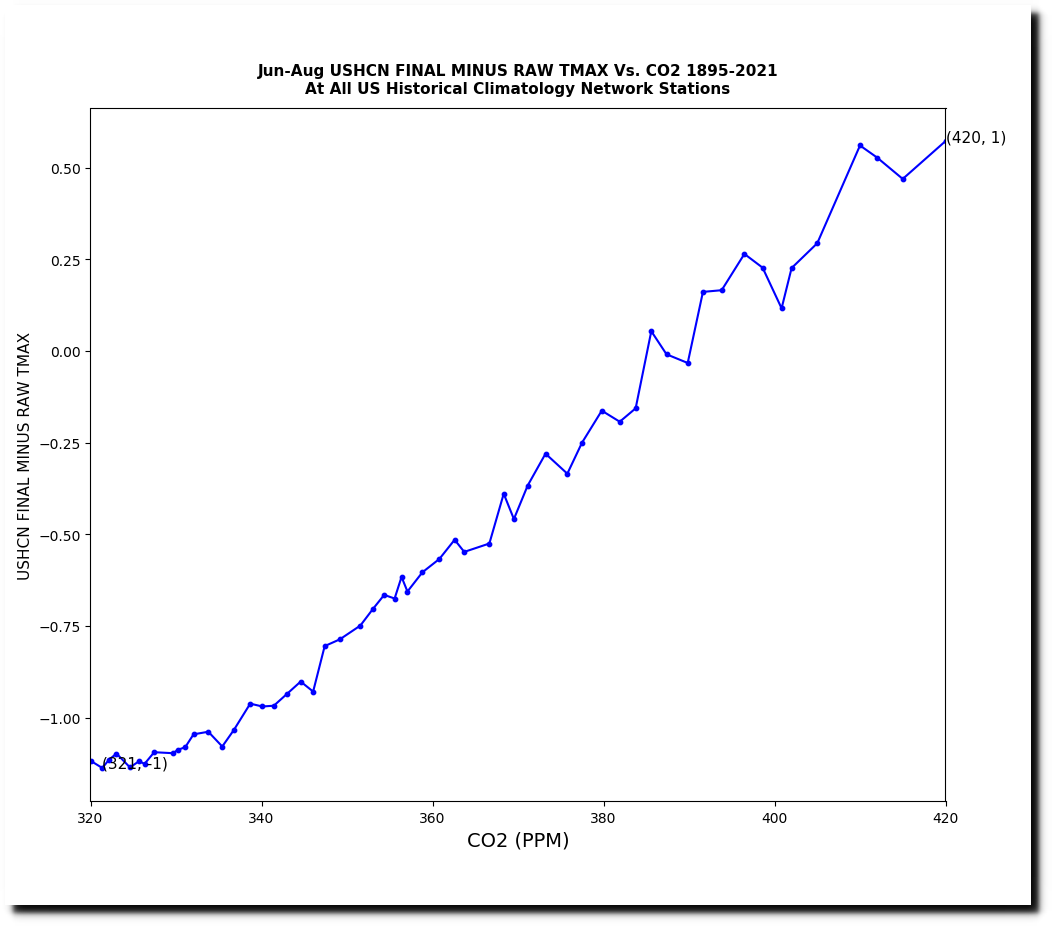
The final data set has diverged from the measured data by almost two degrees over the past forty years.
This warming trend since 1970 does not exist in the thermometer data, so where does it come from?
There has been a large decrease in the number of stations reporting data over the past 30 years. But in the final adjusted data set, they use temperatures for all 1,218 stations regardless of whether or not there is actually any thermometer data.
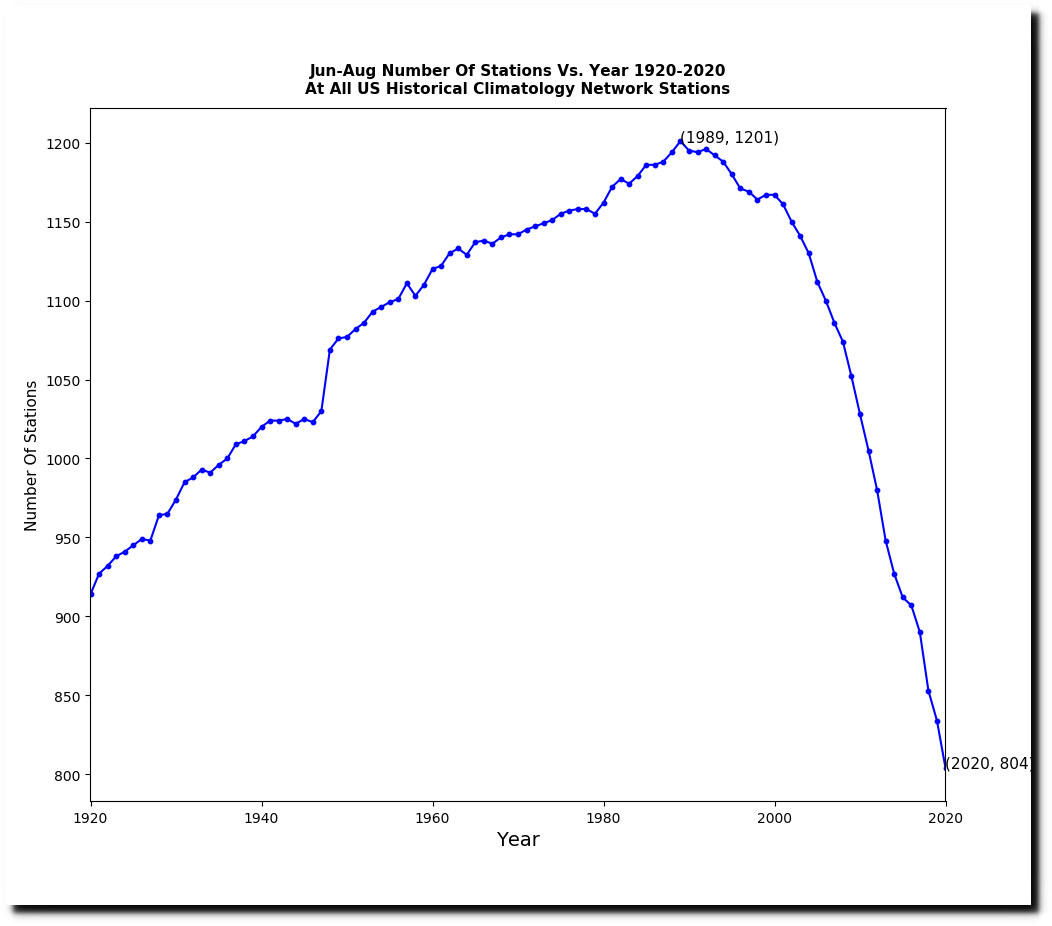
In other words, they are simply making up data. More than 40% of the data in the final data set is now fabricated.
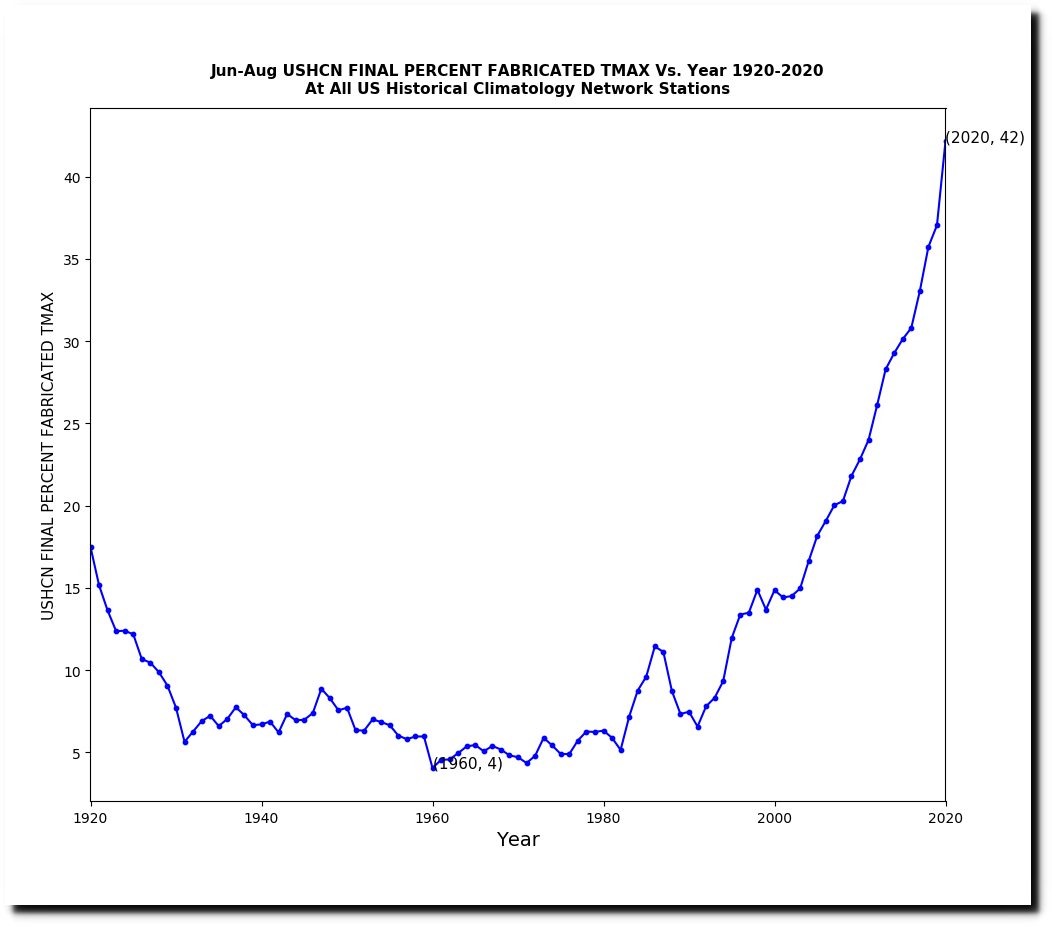
The fabricated data has three degrees of warming, and that accounts for the entire warming trend.

NOAA US temperature graphs are completely fraudulent, and they are being adjusted upwards to track CO2.