*A look back at global tropical activity and US tornadoes in 2020…global tropical activity below normal…US tornado activity below normal and no reported EF-5s*
By Meteorologist Paul Dorian
Perspecta, Inc.
perspectaweather.com
*A look back at global tropical activity and US tornadoes in 2020…global tropical activity below normal…US tornado activity below normal and no reported EF-5s*

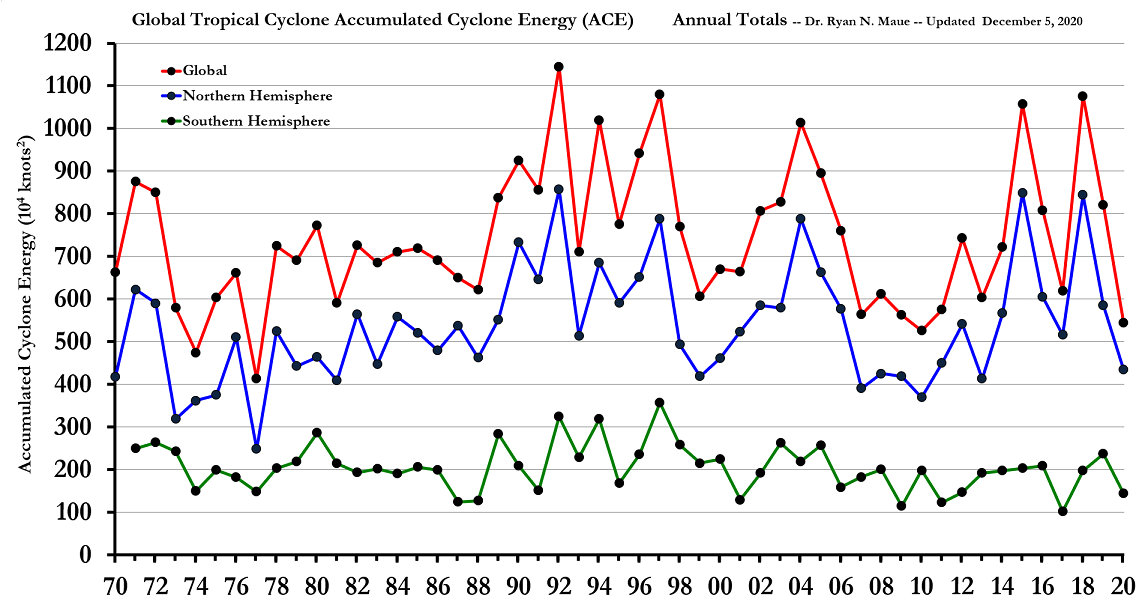
While the Atlantic Basin has had a record setting year in terms of tropical activity in 2020, “accumulated cyclone energy” was below-normal in the Northern Hemisphere and across the globe. Data courtesy Dr. Ryan Maue (http://climatlas.com/tropical/), NOAA
Overview
The Atlantic Basin experienced the most active hurricane season on record with so many named storms (30) that the Greek alphabet had to be utilized for only the second time ever, the first being 2005. In fact, the 2020 Atlantic hurricane season was the fifth consecutive season with above-normal activity and 12 of the 30 named storms made landfall in the contiguous US, breaking the record of nine set in 1916. On the other hand, the Pacific hurricane season was well below normal in terms of overall activity with a total of 17 tropical storms and it was the least active year since 2010. The Pacific Ocean outweighs in importance the Atlantic Basin when it comes to global tropical activity which ends the year far below the normal levels of an important metric. In terms of tornado activity in the US during 2020, the year will end up below-normal and, fortunately, this year has featured no EF-5 tornadoes which are the most powerful of all.

Last 4-decades of Global Tropical Storm and Hurricane Accumulated Cyclone Energy — Annual totals. The Southern Hemisphere tropical cyclone season occurs from July-June each calendar year. The graph is constructed such that SH annual value for July 2014 – July 2015 is positioned in 2015. Data courtesy Dr. Ryan Maue (http://climatlas.com/tropical/), NOAA, Paul Homewood (last updated 12/5/20).
2020 Global Tropical Activity
The 2020 Atlantic Basin hurricane season got off to an early start with the early formation of two tropical storms (Arthur and Bertha) in the month of May (the “official” hurricane season begins on June 1st.) This marked the sixth consecutive year with a “pre-season” system (in this case two systems) and it certainly was a sign that the year could turn out to be quite active. The record amount of activity in the Atlantic Basin for 2020 was fueled in part by La Nina conditions in the equatorial part of the Pacific Ocean. Typically, colder-than-normal sea surface temperatures in the tropical Pacific Ocean (i.e., La Nina conditions) lead to reduced overall wind shear in the tropical Atlantic Ocean and this, in turn, is a favorable factor for the formation and intensification of tropical cyclones in that part of the world.
The first hurricane in the 2020 Atlantic Basin season was named “Hanna” which made landfall in Texas during the latter part of July and this was followed by Hurricane “Isaias” which crossed the Bahamas and moved parallel to the east coasts of Florida and Georgia during early August. After a very active stretch for the next few weeks, Tropical Storm “Wilfred” formed during the middle of September and this was the last named storm before the Greek alphabet had to be utilized. In fact, there were eight systems named with Greek letters in subsequent weeks of the 2020 Atlantic Basin hurricane season ending with Hurricane “Iota” during the middle part of the month of November.

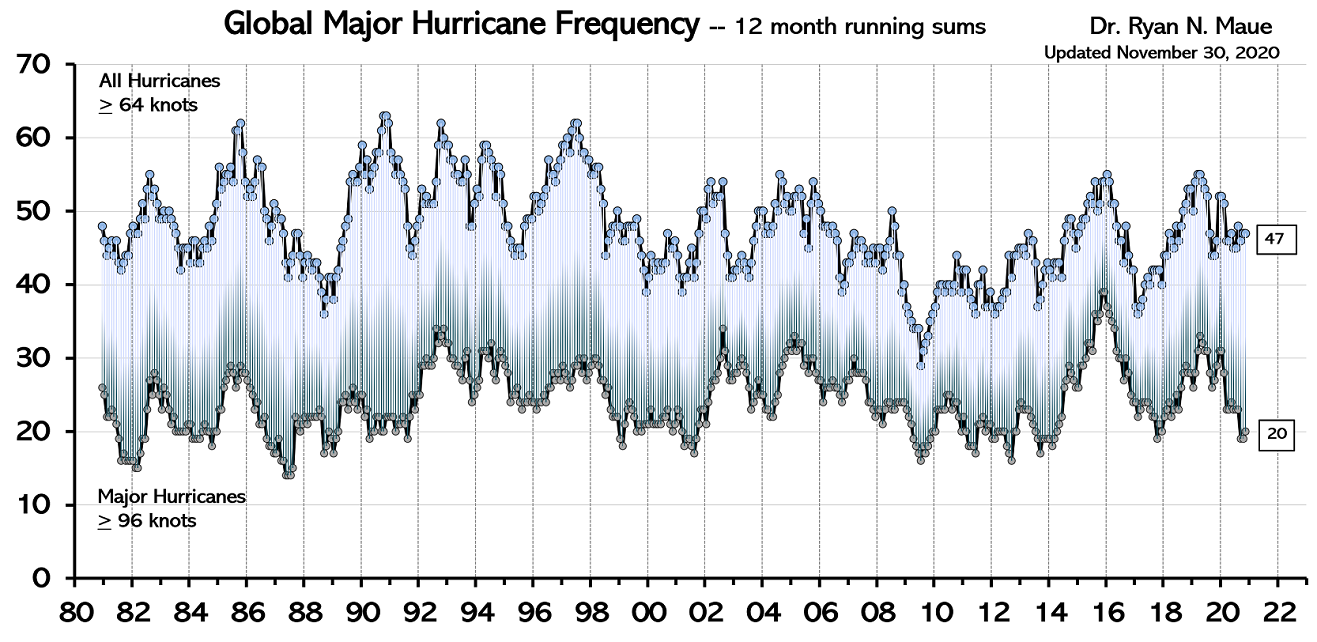
Global Hurricane Frequency (all & major) — 12-month running sums. The top time series is the number of global tropical cyclones that reached at least hurricane-force (maximum lifetime wind speed exceeds 64-knots). The bottom time series is the number of global tropical cyclones that reached major hurricane strength (96-knots+). Adapted from Maue (2011) GRL. Data courtesy Dr. Ryan Maue (http://climatlas.com/tropical/), NOAA, Paul Homewood (last updated 11/30/20).
While La Nina conditions were a favorable factor for tropical activity in the Atlantic Basin, it tended to suppress activity in the equatorial part of the Pacific Ocean. As it turned out, the 2020 Pacific Ocean hurricane season was the least active since 2010 with well below the normal number of hurricanes and well below the number of hurricanes that reached “major” status of category 3 or higher (4 hurricanes, 3 “major”).

La Nina conditions continue in the equatorial part of the Pacific Ocean as we end the year 2020 with colder-than-normal sea surface temperatures (shown in blue). Map courtesy NOAA, tropicaltidbits.com
One of the most accurate ways to monitor overall tropical activity is through the usage of a metric known as the accumulated cyclone energy or “ACE”. The ACE metric – which was originally created by Dr. William Gray and associates at Colorado State University and later tweaked by NOAA – not only factors in the intensity of a tropical cyclone, it also takes into account its longevity. A “major” hurricane, for example, that lasts for a long time will have a much bigger impact on the accumulated cyclone energy than a short-lived and weaker tropical system. While the Atlantic Basin featured well above-normal levels of accumulated cyclone energy in 2020, the much quieter Pacific Ocean led the way for well below-normal ACE values in the Northern Hemisphere and across the globe.

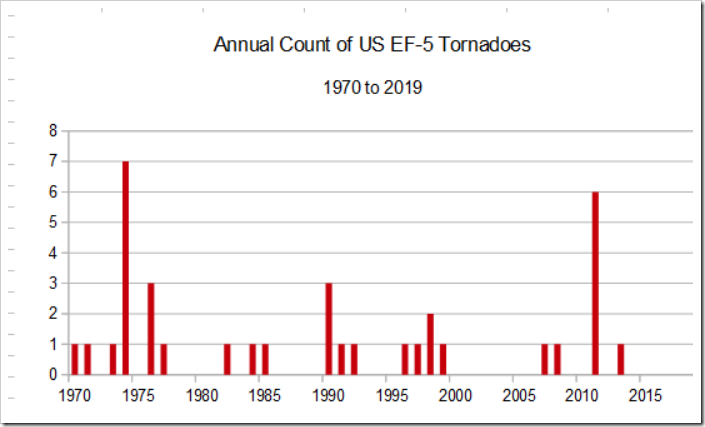
Data courtesy NOAA/SPC (https://www.spc.noaa.gov/wcm/#data); Paul Homewood (last updated 12/31/20)
2020 US Tornadoes
As 2020 comes to a close, the number of tornadoes recorded in the US by NOAA (at least on a preliminary basis) is 1245 and this is below the normal value of 1392 when compared to the mean of the base period 2005-2019. Tornado activity in the US was actually above-normal for awhile back in the spring months of April and May, but it dropped to below-normal levels by the early part of the summer and has stayed there through the remainder of the year.

Data courtesy NOAA/SPC (https://www.spc.noaa.gov/wcm/#data); Paul Homewood (last updated 12/31/20)
One of the notable findings of the 2020 US tornado season is that it featured no EF-5 tornadoes which are the most powerful of all. In fact, it has now been more than 7 years since the last EF-5 tornado struck in the US which was in Moore County, Oklahoma during May of 2013. According to NOAA, there have been a total of 36 EF-5 tornadoes in the US since 1970 with 14 of those occurring in the 1970s.
Meteorologist Paul Dorian
Perspecta, Inc.
perspectaweather.com


