
https://rclutz.wordpress.com/2020/08/21/greenland-ice-varies-dont-panic/
The scare du jour is about Greenland Ice Sheet (GIS) and how it will melt out and flood us all. It’s declared that GIS has passed its tipping point, and we are doomed. Typical is the Phys.org hysteria: Sea level rise quickens as Greenland ice sheet sheds record amount: “Greenland’s massive ice sheet saw a record net loss of 532 billion tonnes last year, raising red flags about accelerating sea level rise, according to new findings.”
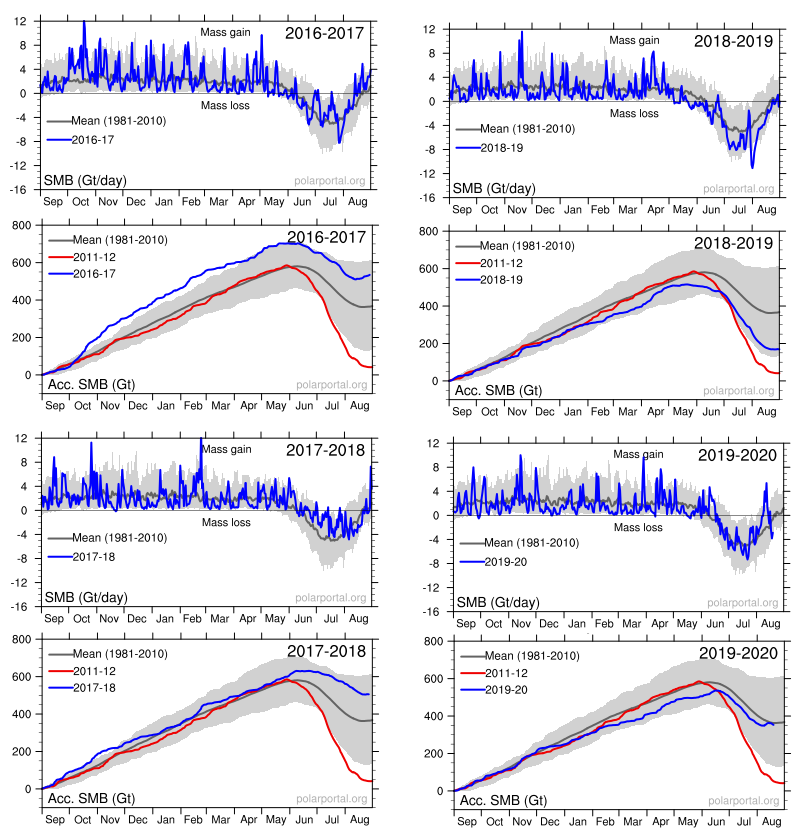
Panic is warranted only if you treat this as proof of an alarmist narrative and ignore the facts and context in which natural variation occurs. For starters, consider the last four years of GIS fluctuations reported by DMI and summarized in the eight graphs above. Note the noisy blue lines showing how the surface mass balance (SMB) changes its daily weight by 8 or 10 gigatonnes (Gt) around the baseline mean from 1981 to 2010. Note also the summer decrease between May and August each year before recovering to match or exceed the mean.
The other four graphs show the accumulation of SMB for each of the last four years including 2020. Tipping Point? Note that in both 2017 and 2018, SMB ended about 500 Gt higher than the year began, and way higher than 2012, which added nothing. Then came 2019 dropping below the mean, but still above 2012. Lastly, this year is matching the 30-year average. Note also that the charts do not integrate from previous years; i.e. each year starts at zero and shows the accumulation only for that year. Thus the gains from 2017 and 2018 do not result in 2019 starting the year up 1000 Gt, but from zero.
The Truth about Sliding Greenland Ice
Researchers know that the small flows of water from surface melting are not the main way GIS loses ice in the summer. Neil Humphrey explains in this article from last year Nate Maier and Neil Humphrey Lead Team Discovering Ice is Sliding Toward Edges Off Greenland Ice Sheet Excerpts in italics with my bolds.
While they may appear solid, all ice sheets—which are essentially giant glaciers—experience movement: ice flows downslope either through the process of deformation or sliding. The latest results suggest that the movement of the ice on the GIS is dominated by sliding, not deformation. This process is moving ice to the marginal zones of the sheet, where melting occurs, at a much faster rate.
“The study was motivated by a major unknown in how the ice of Greenland moves from the cold interior, to the melting regions on the margins,” Neil Humphrey, a professor of geology from the University of Wyoming and author of the study, told Newsweek. “The ice is known to move both by sliding over the bedrock under the ice, and by oozing (deforming) like slowly flowing honey or molasses. What was unknown was the ratio between these two modes of motion—sliding or deforming.
“This lack of understanding makes predicting the future difficult, since we know how to calculate the flowing, but do not know much about sliding,” he said. “Although melt can occur anywhere in Greenland, the only place that significant melt can occur is in the low altitude margins. The center (high altitude) of the ice is too cold for the melt to contribute significant water to the oceans; that only occurs at the margins. Therefore ice has to get from where it snows in the interior to the margins.
“The implications for having high sliding along the margin of the ice sheet means that thinning or thickening along the margins due to changes in ice speed can occur much more rapidly than previously thought,” Maier said. “This is really important; as when the ice sheet thins or thickens it will either increase the rate of melting or alternatively become more resilient in a changing climate.“
“There has been some debate as to whether ice flow along the edges of Greenland should be considered mostly deformation or mostly sliding,” Maier says. “This has to do with uncertainty of trying to calculate deformation motion using surface measurements alone. Our direct measurements of sliding- dominated motion, along with sliding measurements made by other research teams in Greenland, make a pretty compelling argument that no matter where you go along the edges of Greenland, you are likely to have a lot of sliding.”
The sliding ice does two things, Humphrey says. First, it allows the ice to slide into the ocean and make icebergs, which then float away. Two, the ice slides into lower, warmer climate, where it can melt faster.
While it may sound dire, Humphrey notes the entire Greenland Ice Sheet is 5,000 to 10,000 feet thick.
“In a really big melt year, the ice sheet might melt a few feet. It means Greenland is going to be there another 10,000 years,” Humphrey says. “So, it’s not the catastrophe the media is overhyping.”
Humphrey has been working in Greenland for the past 30 years and says the Greenland Ice Sheet has only melted 10 feet during that time span.
Summary
The Greenland ice sheet is more than 1.2 miles thick in most regions. If all of its ice was to melt, global sea levels could be expected to rise by about 25 feet. However, this would take more than 10,000 years at the current rates of melting.
Background from Previous Post: Greenland Glaciers: History vs. Hysteria
The modern pattern of environmental scares started with Rachel Carson’s Silent Spring claiming chemicals are killing birds, only today it is windmills doing the carnage. That was followed by ever expanding doomsday scenarios, from DDT, to SST, to CFC, and now the most glorious of them all, CO2. In all cases the menace was placed in remote areas difficult for objective observers to verify or contradict. From the wilderness bird sanctuaries, the scares are now hiding in the stratosphere and more recently in the Arctic and Antarctic polar deserts. See Progressively Scaring the World (Lewin book synopsis)
The advantage of course is that no one can challenge the claims with facts on the ground, or on the ice. Correction: Scratch “no one”, because the climate faithful are the exception. Highly motivated to go to the ends of the earth, they will look through their alarmist glasses and bring back the news that we are indeed doomed for using fossil fuels.
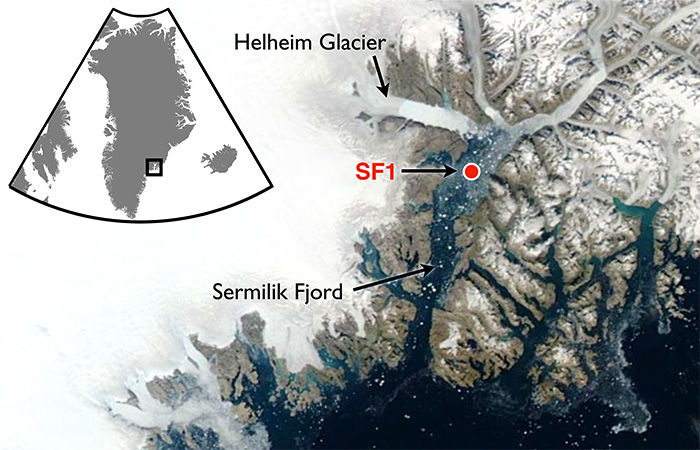
A recent example is a team of researchers from Dubai (the hot and sandy petro kingdom) going to Greenland to report on the melting of Helheim glacier there. The article is NYUAD team finds reasons behind Greenland’s glacier melt. Excerpts in italics with my bolds.
First the study and findings:
For the first time, warm waters that originate in the tropics have been found at uniform depth, displacing the cold polar water at the Helheim calving front, causing an unusually high melt rate. Typically, ocean waters near the terminus of an outlet glacier like Helheim are at the freezing point and cause little melting.
NYUAD researchers, led by Professor of Mathematics at NYU’s Courant Institute of Mathematical Sciences and Principal Investigator for NYU Abu Dhabi’s Centre for Sea Level Change David Holland, on August 5, deployed a helicopter-borne ocean temperature probe into a pond-like opening, created by warm ocean waters, in the usually thick and frozen melange in front of the glacier terminus.
Normally, warm, salty waters from the tropics travel north with the Gulf Stream, where at Greenland they meet with cold, fresh water coming from the polar region. Because the tropical waters are so salty, they normally sink beneath the polar waters. But Holland and his team discovered that the temperature of the ocean water at the base of the glacier was a uniform 4 degrees Centigrade from top to bottom at depth to 800 metres. The finding was also recently confirmed by Nasa’s OMG (Oceans Melting Greenland) project.
“This is unsustainable from the point of view of glacier mass balance as the warm waters are melting the glacier much faster than they can be replenished,” said Holland.
Surface melt drains through the ice sheet and flows under the glacier and into the ocean. Such fresh waters input at the calving front at depth have enormous buoyancy and want to reach the surface of the ocean at the calving front. In doing so, they draw the deep warm tropical water up to the surface, as well.
All around Greenland, at depth, warm tropical waters can be found at many locations. Their presence over time changes depending on the behaviour of the Gulf Stream. Over the last two decades, the warm tropical waters at depth have been found in abundance. Greenland outlet glaciers like Helheim have been melting rapidly and retreating since the arrival of these warm waters.

Then the Hysteria and Pledge of Alligiance to Global Warming
“We are surprised to learn that increased surface glacier melt due to warming atmosphere can trigger increased ocean melting of the glacier,” added Holland. “Essentially, the warming air and warming ocean water are delivering a troubling ‘one-two punch’ that is rapidly accelerating glacier melt.”
My comment: Hold on.They studied effects from warmer ocean water gaining access underneath that glacier. Oceans have roughly 1000 times the heat capacity of the atmosphere, so the idea that the air is warming the water is far-fetched. And remember also that long wave radiation of the sort that CO2 can emit can not penetrate beyond the first millimeter or so of the water surface. So how did warmer ocean water get attributed to rising CO2? Don’t ask, don’t tell. And the idea that air is melting Arctic glaciers is also unfounded.
Consider the basics of air parcels in the Arctic.
The central region of the Arctic is very dry. Why? Firstly because the water is frozen and releases very little water vapour into the atmosphere. And secondly because (according to the laws of physics) cold air can retain very little moisture.
Greenland has the only veritable polar ice cap in the Arctic, meaning that the climate is even harsher (10°C colder) than at the North Pole, except along the coast and in the southern part of the landmass where the Atlantic has a warming effect. The marked stability of Greenland’s climate is due to a layer of very cold air just above ground level, air that is always heavier than the upper layers of the troposphere. The result of this is a strong, gravity-driven air flow down the slopes (i.e. catabatic winds), generating gusts that can reach 200 kph at ground level.
Arctic air temperatures
Some history and scientific facts are needed to put these claims in context. Let’s start with what is known about Helheim Glacier.
Holocene history of the Helheim Glacier, southeast Greenland
Helheim Glacier ranks among the fastest flowing and most ice discharging outlets of the Greenland Ice Sheet (GrIS). After undergoing rapid speed-up in the early 2000s, understanding its long-term mass balance and dynamic has become increasingly important. Here, we present the first record of direct Holocene ice-marginal changes of the Helheim Glacier following the initial deglaciation. By analysing cores from lakes adjacent to the present ice margin, we pinpoint periods of advance and retreat. We target threshold lakes, which receive glacial meltwater only when the margin is at an advanced position, similar to the present. We show that, during the period from 10.5 to 9.6 cal ka BP, the extent of Helheim Glacier was similar to that of todays, after which it remained retracted for most of the Holocene until a re-advance caused it to reach its present extent at c. 0.3 cal ka BP, during the Little Ice Age (LIA). Thus, Helheim Glacier’s present extent is the largest since the last deglaciation, and its Holocene history shows that it is capable of recovering after several millennia of warming and retreat. Furthermore, the absence of advances beyond the present-day position during for example the 9.3 and 8.2 ka cold events as well as the early-Neoglacial suggest a substantial retreat during most of the Holocene.
Quaternary Science Reviews, Holocene history of the Helheim Glacier, southeast Greenland
A.A.Bjørk et. Al. 1 August 2018
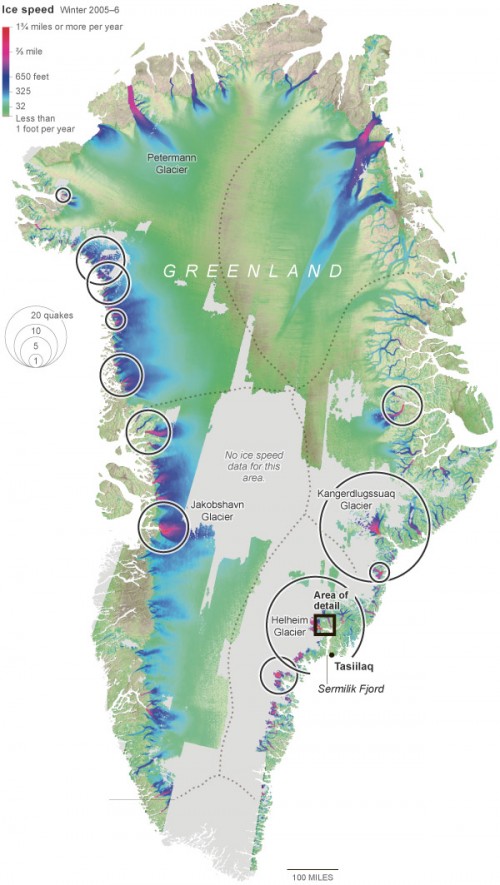
The topography of Greenland shows why its ice cap has persisted for millenia despite its southerly location. It is a bowl surrounded by ridges except for a few outlets, Helheim being a major one.

And then, what do we know about the recent history of glacier changes. Two Decades of Changes in Helheim Glacier
Helheim Glacier is the fastest flowing glacier along the eastern edge of Greenland Ice Sheet and one of the island’s largest ocean-terminating rivers of ice. Named after the Vikings’ world of the dead, Helheim has kept scientists on their toes for the past two decades. Between 2000 and 2005, Helheim quickly increased the rate at which it dumped ice to the sea, while also rapidly retreating inland- a behavior also seen in other glaciers around Greenland. Since then, the ice loss has slowed down and the glacier’s front has partially recovered, readvancing by about 2 miles of the more than 4 miles it had initially retreated.
NASA has compiled a time series of airborne observations of Helheim’s changes into a new visualization that illustrates the complexity of studying Earth’s changing ice sheets. NASA uses satellites and airborne sensors to track variations in polar ice year after year to figure out what’s driving these changes and what impact they will have in the future on global concerns like sea level rise.
Since 1997, NASA has collected data over Helheim Glacier almost every year during annual airborne surveys of the Greenland Ice Sheet using an airborne laser altimeter called the Airborne Topographic Mapper (ATM). Since 2009 these surveys have continued as part of Operation IceBridge, NASA’s ongoing airborne survey of polar ice and its longest-running airborne mission. ATM measures the elevation of the glacier along a swath as the plane files along the middle of the glacier. By comparing the changes in the height of the glacier surface from year to year, scientists estimate how much ice the glacier has lost.
The animation begins by showing the NASA P-3 plane collecting elevation data in 1998. The laser instrument maps the glacier’s surface in a circular scanning pattern, firing laser shots that reflect off the ice and are recorded by the laser’s detectors aboard the airplane. The instrument measures the time it takes for the laser pulses to travel down to the ice and back to the aircraft, enabling scientists to measure the height of the ice surface. In the animation, the laser data is combined with three-dimensional images created from IceBridge’s high-resolution camera system. The animation then switches to data collected in 2013, showing how the surface elevation and position of the calving front (the edge of the glacier, from where it sheds ice) have changed over those 15 years.
Helheim’s calving front retreated about 2.5 miles between 1998 and 2013. It also thinned by around 330 feet during that period, one of the fastest thinning rates in Greenland.
“The calving front of the glacier most likely was perched on a ledge in the bedrock in 1998 and then something altered its equilibrium,” said Joe MacGregor, IceBridge deputy project scientist. “One of the most likely culprits is a change in ocean circulation or temperature, such that slightly warmer water entered into the fjord, melted a bit more ice and disturbed the glacier’s delicate balance of forces.”
Comment:
Once again, history is a better guide than hysteria. Over time glaciers advance and retreat, and incursions of warm water are a key factor. Greenland ice cap and glaciers are part of the the Arctic self-oscillating climate system operating on a quasi-60 year cycle.


