In recent decades there have been “notable cooling trends” throughout many regions of the globe according to several new studies.
A year ago NoTricksZone (NTZ) announced Greenland Has Been Cooling In Recent Years – 26 Of Its 47 Largest Glaciers Now Stable Or Gaining Ice.
Six months ago NTZ cited several scientific papers indicating The Region From 50-70°S Has Cooled Since The 1980s As North Atlantic SSTs Have Cooled 1°C Since 2004.
Three months ago we reported A Massive Cooling Of 2°C In 8 Years (2008-2016) Has Jolted Large Regions Of The North Atlantic.
A few days ago we shared a New Study Finds The Larsen Ice Shelf (Antarctic Peninsula) Has Cooled More Than 2°C Since 1991.
Now we shine the light on 3 more studies that assess “Eurasia, North America, Africa, Australia, South America, and Greenland experienced notable cooling trends” from 2002 to 2013 (Xu et al., 2020), and both West and East Antarctica have been rapidly cooling since the mid-2000s (Hrbáček and Uxa, 2020 and Fatras et al., 2020).
At some point the question may need to be asked: Just how global is recent “global warming”?
“Concurrent with the slowdown of global warming during 2002–2013, the wintertime land surface air temperatures over Eurasia, North America, Africa, Australia, South America, and Greenland experienced notable cooling trends. … The slowdown concurs with a negative phase of the Pacific Decadal Oscillation (PDO), indicating that PDO plays an important role in modulating the global warming signal. Not all ensemble members capture the cooling trends over the continents, suggesting additional contribution from internal atmospheric variability.”
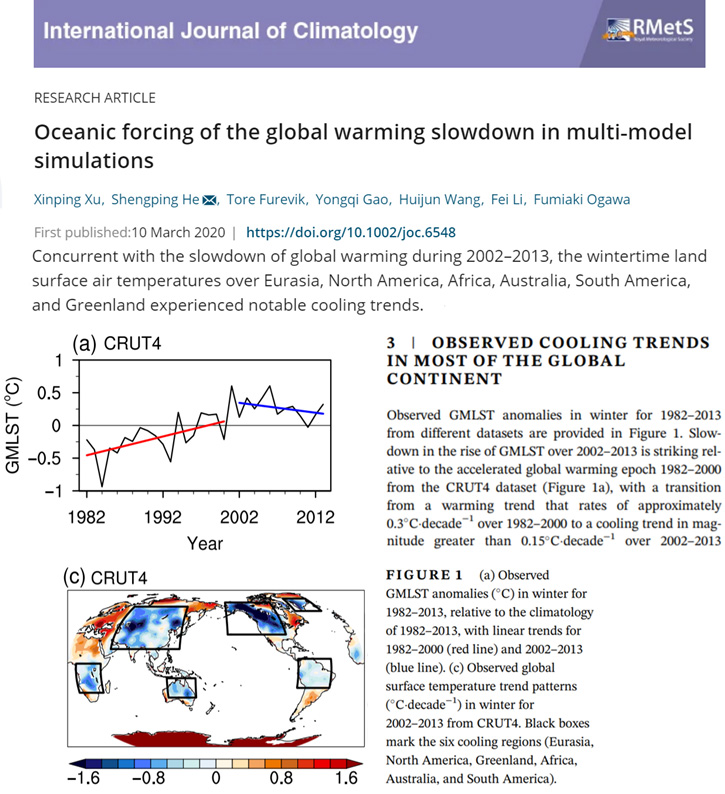
Image Source: Xu et al., 2020
“A significant air temperature decrease started around 2000 along most of the Western AP. The cooling triggered by natural variability of cyclonic activity and increasing sea‐ice concentrations near coastlines caused MAAT trends of −0.16 to 0.05°C y−1 in the period 2006–2015. In contrast, the MAAT on JRI was increasing at a non‐significant rate of 0.10°C y−1, which corresponds to observations from other sites of the north‐eastern AP where positive, but non‐significant, trends between 0.02 and 0.08°C y−1 have been reported.10 Unlike MAAT , there was a non‐significant negative trend of −0.05°C y−1 for MAGT 5. Interestingly, the MSAT and MSGT 5 trends were positive only in autumn (MAM), at 0.30 and 0.13°C y−1, respectively, while they were negative in the other three seasons. Yet, the north‐eastern AP region exhibited a MAAT more than 1°C lower in the period 2006–2015 compared to 1996–2005, and autumn (MAM) air temperature was even about 1.5°C lower.”
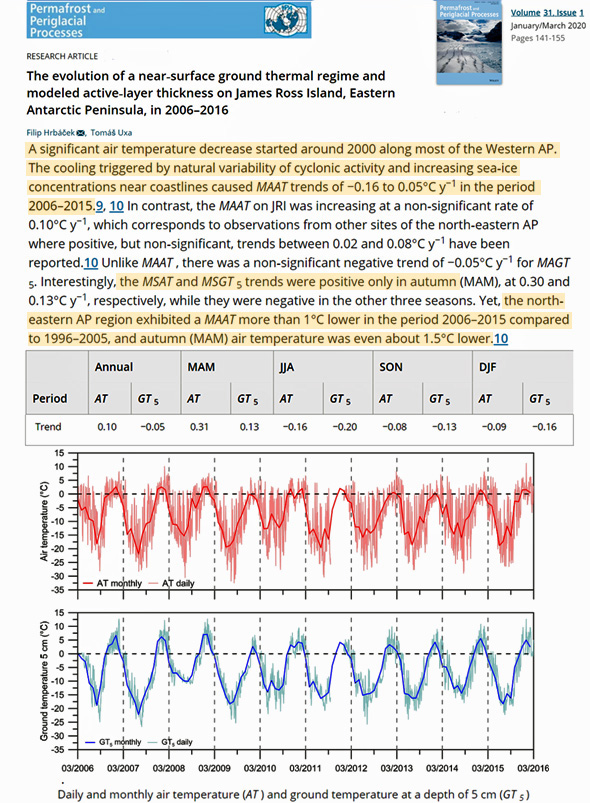
Image Source: Hrbáček and Uxa, 2020
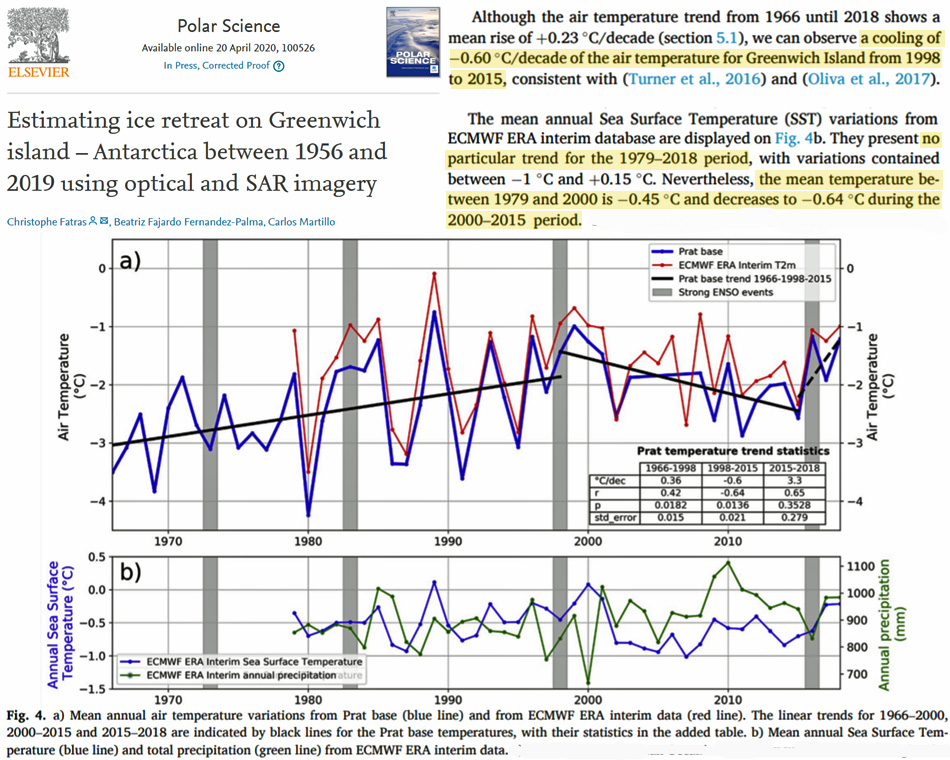
“The mean annual Sea Surface Temperature (SST) variations from ECMWF ERA interim database are displayed on Fig. 4b. They present no particular trend for the 1979–2018 period, with variations contained between -1°C and +0.15°C. Nevertheless, the mean temperature between 1979 and 2000 is -0.45°C and decreases to -0.64°C during the 2000–2015 period.”