
https://wattsupwiththat.com/2020/03/03/climate-crisis-to-eradicate-worlds-beaches-by-2100/
by David Middleton
Gregory Wrightstone linked to the Fox News version of this article on his LinkedIn page, the comments from fellow geologists were fracking hilarious…
World’s beaches disappearing due to climate crisis – study
UK on course to lose a quarter of its sandy coast because of human-driven erosionStefano Valentino
Mon 2 Mar 2020
Almost half of the world’s sandy beaches will have retreated significantly by the end of the century as a result of climate-driven coastal flooding and human interference, according to new research.
The sand erosion will endanger wildlife and could inflict a heavy toll on coastal settlements that will no longer have buffer zones to protect them from rising sea levels and storm surges. In addition, measures by governments to mitigate against the damage are predicted to become increasingly expensive and in some cases unsustainable.
[…]
These estimates are far from the most catastrophic; they rely on an optimistic forecast of international action to fight climate breakdown, a scenario known as RCP4.5. In this scenario of reduced ice-cap melting and lower thermal expansion of water, oceans will only have risen by 50cm by 2100.
However, if the world continues to emit carbon at its current rate, sea levels will rise by an estimated 80cm, according to the Intergovernmental Panel on Climate Change. If this happens, a total of 131,745km of beaches, or 13% of the planet’s ice-free coastline, will go under water.
Around the globe, the average shoreline retreat will be 86.4 metres in the RCP4.5 scenario or 128.1 metres in the high-carbon scenario, though amounts will vary significantly between locations. Flatter or wilder coastlines will be more affected than those where waterfronts are steeper, or those artificially maintained as part of coastal development.
[…]
“The length of threatened seashores incorporates locations that will be submerged by more than 100 metres, assuming there are no physical limits to potential retreat,” said Michalis Vousdoukas, an oceanographer at the JRC and lead author of the study, published in the journal Nature Climate Change. “Our 100-metre threshold is conservative since most beaches’ width is below 50 metres, especially near human settlements and in small islands, such as the Caribbean and the Mediterranean.”
[…]
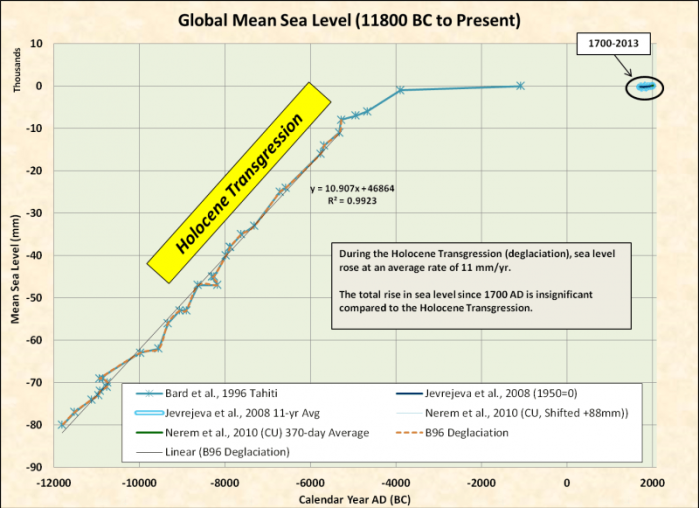
Where do I start? “Human settlements”?!?!?!?!? Those are generally called cities. The last time sea level wiped out “human settlements” was called the Holocene transgression.
Those former human settlements are now at the bottom of the Gulf of Mexico and the reason why the Bureau of Ocean Energy Management (BOEM) employs archaeologists.
I have to quote this bit of idiocy a second time…
These estimates are far from the most catastrophic; they rely on an optimistic forecast of international action to fight climate breakdown, a scenario known as RCP4.5. In this scenario of reduced ice-cap melting and lower thermal expansion of water, oceans will only have risen by 50cm by 2100.
However, if the world continues to emit carbon at its current rate, sea levels will rise by an estimated 80cm, according to the Intergovernmental Panel on Climate Change.
Unmitigated horst schist!
50 cm is half a meter… 1.6 feet. 80 cm is almost 1 meter… 2.6 feet.
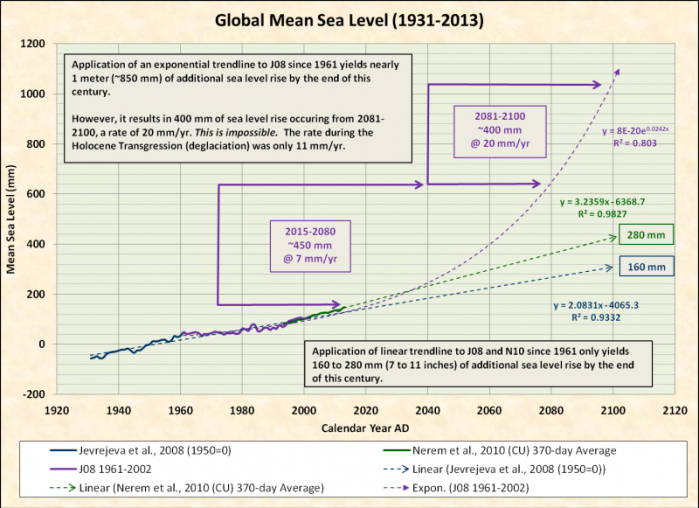
For sea level to rise 80 cm by 2100, it would have to be rising twice as fast as the Holocene Transgression from 2081-2100.
And it just kept getting better for those of us who love to ridicule junk science…
Around the globe, the average shoreline retreat will be 86.4 metres in the RCP4.5 scenario or 128.1 metres in the high-carbon scenario…
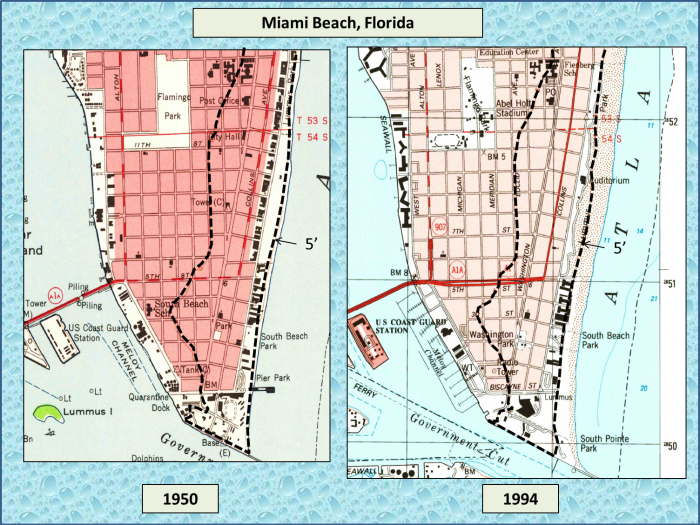
Let’s look at Miami Beach, the poster child of catastrophic sea level rise. The nearest tide gauge station with a sufficient record length is Virginia Key.
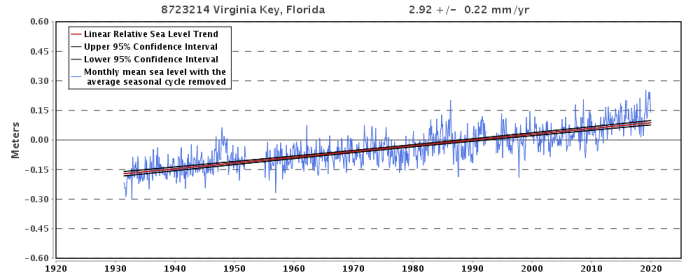
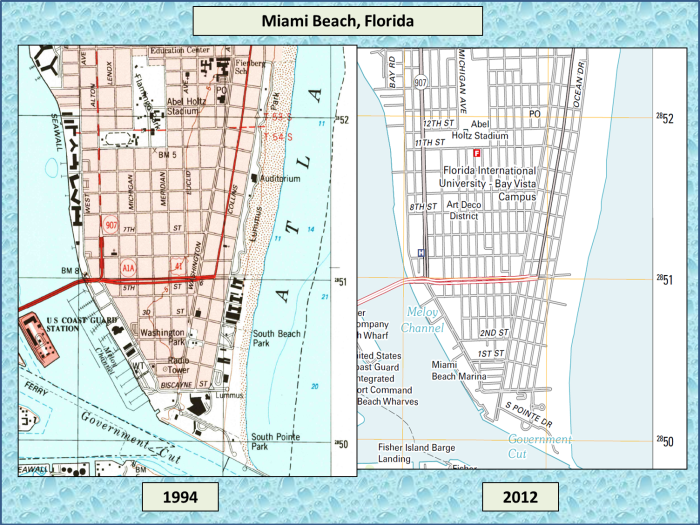
Since 1931, sea level appears to have risen by about 20-25 cm. A review of USGS topographic maps reveals that the coastline has barely moved.
At 3 mm per year, sea level in the Miami Beach area will have risen by another 240 mm by 2100, 24 cm, about 9 inches. Beach slopes can be highly variable. Doran & Overbeck (2015) found that the slopes of North Carolina sandy beaches ranged from 0.05 to 0.10 radians (~3-6°). 9 inches of sea level rise works out to 7 feet of shoreline retreat at 6° and 14 feet at 3°.
Here’s a topographic profile across Miami Beach.
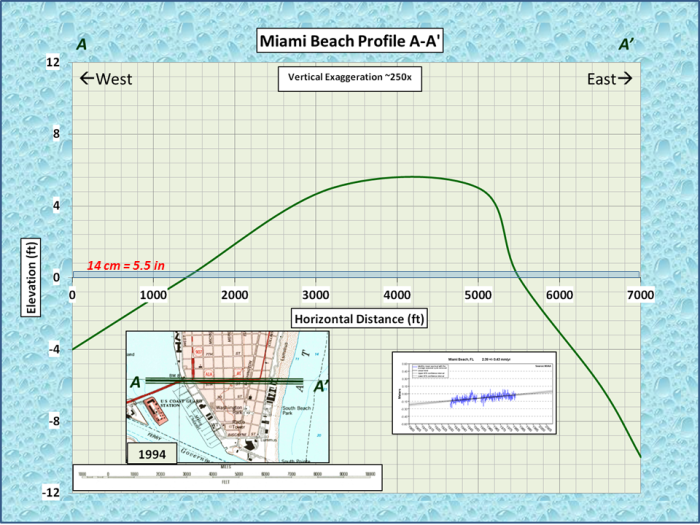
We can see that the sandy beach side (east) is much steeper than the shoreward side. The gray band represents 14 cm of sea level rise. Even if we double that, the shoreline would only retreat by about 100 feet on the shoreward side and hardly budge at all on the sandy beach side, a far cry from 86.4 to 128.1 meters (283 to 420 feet). However, we can see from the topographic maps that the previous 20-25 mm of sea level rise had no affect on the coastline… What’s up with that? Without anthropogenic intervention, beaches move… That’s what they do.
To illustrate the irrelevance of sea level rise, I devised a little topographic exercise using NOAA tides & sea level trends and a USGS topographic map of the Jacksonville FL quadrangle. There are two NOAA sea level stations in this quadrangle: Fernandina Beach and Mayport. I chose Fernandina Beach because the record goes back to 1897, Mayport only goes back to 1930.
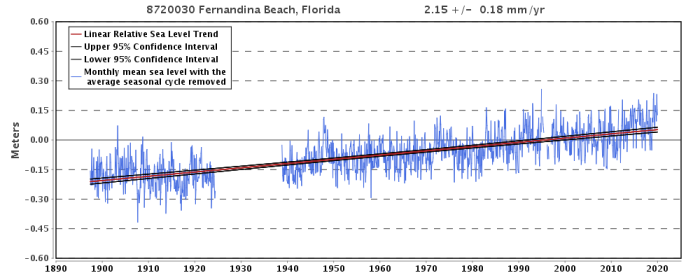
2 mm/yr… Can I get a “yawn” for this?
Here is the current tide range for Fernandina Beach…
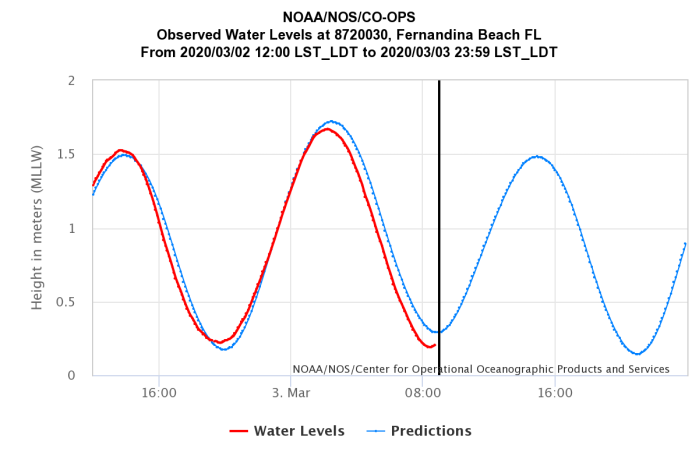
1.5 m/day… How can 2 mm/yr be a crisis and 1.5 m/day not be a crisis?
Here’s a topographic map of the Fernandina Beach area…

To evaluate the significance insignificance of 2 mm/yr of sea level rise since 1897, I constructed a topographic profile (A-A’) along Atlantic Avenue from Nassau General Hospital (A) to the shoreline (A’).

My next step was to plot the sea level data at the same vertical scale as the topographic profile.

According the the alarmists, sea level rise will make storm surges worse, somehow endangering beaches more than nature already endangers them. What effect has all of this sea level rise had on a 10′ storm surge? Just above the Dean Wormer line (zero-point-zero).

My next exercise was to compare the typical tidal range to sea level rise.

The construction of topographic profiles was literally the first thing I was taught as a freshman geology student back in 1976. How in the hell could ostensibly professional engineers and scientists write crap like this: “World’s beaches disappearing due to climate crisis”… Well, they didn’t. The idiot Grauniad journalist wrote it. The actual paper isn’t as bad as it’s made out to be…
Sandy coastlines under threat of erosion
Michalis I. Vousdoukas, Roshanka Ranasinghe, Lorenzo Mentaschi, Theocharis A. Plomaritis, Panagiotis Athanasiou, Arjen Luijendijk and Luc Feyen
Abstract
Sandy beaches occupy more than one-third of the global coastline1 and have high socioeconomic value related to recreation, tourism and ecosystem services2. Beaches are the interface between land and ocean, providing coastal protection from marine storms and cyclones3. However the presence of sandy beaches cannot be taken for granted, as they are under constant change, driven by meteorological4,5, geological6 and anthropogenic factors1,7. A substantial proportion of the world’s sandy coastline is already eroding1,7, a situation that could be exacerbated by climate change8,9.
[…]
However, the paper has one YUGE problem with it…
Sandy coastlines under threat of erosion
No schist Sherlock! They always have been and always will be.
Beaches are the interface between land and ocean
No schist Sherlock! They always have been and always will be.
However the presence of sandy beaches cannot be taken for granted, as they are under constant change…
No schist Sherlock! They always have been and always will be.
A substantial proportion of the world’s sandy coastline is already eroding…
No schist Sherlock! That’s fracking obvious to anyone who has ever taken at least one semester of stratigraphy and sedimentation. Beaches are not only destroyed by erosion… They are formed by erosion. How the hell could the beach sand have gotten to the beach if it wasn’t eroded from some place else?
And… Here’s the mother of all “no schist Sherlocks”… Every beach that has ever formed has eventually disappeared or ceased to be a beach because of climate change.
Beaches that formed at the Holocene Highstand are no stranded well above sea level.

Many prolific oil and gas reservoir sandstone formations were once beaches.

Every beach currently on Earth will eventually “disappear” or otherwise cease to be a beach due to climate change. However, much of the sand will just be redeposited on new beaches. Because, that’s what beaches do.
This is another climate “crisis” that can be safely filed away as: “Same as it ever was”…
Letting the days go by, let the water hold me down
Letting the days go by, water flowing underground
Into the blue again after the money’s gone
Once in a lifetime, water flowing undergroundSame as it ever was
Same as it ever was
Same as it ever was
Same as it ever was
Same as it ever was
Same as it ever was
Same as it ever was
Same as it ever wasWater dissolving and water removing
There is water at the bottom of the ocean
Under the water, carry the water
Remove the water at the bottom of the ocean!
Water dissolving and water removing
References
Doran, K.S., Long, J.W., and Overbeck, J.R., 2015. “A method for determining average beach slope and beach slope variability for U.S. sandy coastlines: U.S. Geological Survey Open-File Report 2015-1053”. 5 p., http://dx.doi.org/10.3133/ofr20151053.
Jameson, J., C. Strohmenger. “Late Pleistocene to Holocene Sea-Level History of Qatar: Implications for Eustasy and Tectonics”. AAPG Search and Discovery Article #90142 © 2012 AAPG Annual Convention and Exhibition, April 22-25, 2012, Long Beach, California.
Vousdoukas, M.I., Ranasinghe, R., Mentaschi, L. et al. Sandy coastlines under threat of erosion. Nat. Clim. Chang.10, 260–263 (2020). https://doi.org/10.1038/s41558-020-0697-0
