Professor Dr. Roger Pielke Jr. also challenges the New York Times on sea-level rise claims:
https://twitter.com/RogerPielkeJr/status/1224522380346703872
#
Other media outlets are promoting sea level rise scares as well: Sea level rise could displace 13 million Americans by 2100
Swedish paleogeophysicist Nils-Axel Mörner comments on the 13 million claim. He makes his corrections in red below.
Other experts weigh in on this:
Willis Eschenbach writes: “I have little faith in the satellite sea level. The Jason satellite orbits at an elevation of 1,336 km. To measure 1 mm from that altitude is measuring to one part in a billion. That’s hard to do with a fixed target on a solid bench in a lab … think about the issues with measuring one part in a billion to an uneven sea surface with varying tidal elevations on an oblate spheroid from a moving platform more than a thousand kilometers away orbiting through a highly variable gravitation through an ever-changing atmosphere … I discuss other issues regarding sea level measurement in my post “Inside The Acceleration Factory“.
https://threadreaderapp.com/
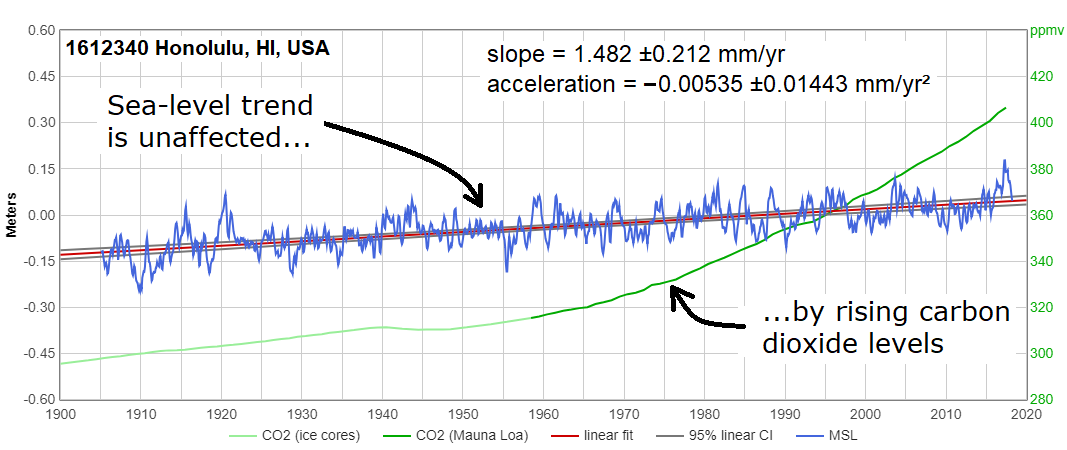
A warming climate has effects which both increase and decrease sea-level trends, and it seems that (at least when there’s no Laurentide ice sheet to melt!) those processes roughly balance each other.
The only effects that many climate alarmists seem to be aware of are those which increase sea-level, like ice melting, sublimation, thermal expansion, and glacier calving. But the most important process which affects ice sheet mass trends is none of those things. It is snowfall.
A warming climate increases snow accumulation on ice sheets and glaciers — and thus decreases sea-level — in two ways:
1. Most obviously, warmer air holds more moisture. Every 1°C of warming increases the amount of moisture which the atmosphere can hold by about 7%.
When temperatures are very low snowfall is greatly reduced, because the frigid air carries very little moisture; it is said to be “too cold to snow (much).” The heaviest snowfalls usually occur when temperatures are only modestly below freezing.
2. Decreased sea ice coverage (Arctic, North Atlantic, and Southern Ocean) increases water evaporation, which increases “lake/ocean-effect snowfall” (LOES) downwind. Some of that snow falls on the ice sheets and glaciers, increasing ice accumulation, and offsetting meltwater losses. Other snow falls on land, increasing snowpack.
Snowfall is, by far, the most important factor in ice sheet & glacier mass fluxes. Increased snowfall is the main reason that, in two of the last three glaciological years, the Greenland Ice Sheet (which usually loses ice) apparently had no net loss of ice.
Yet in eighty pages of fine print, which you can read here…
https://www.ipcc.ch/pdf/
…the IPCC’s AR5 authors never even mentioned lake/ocean-effect snowfall, and its effect on ice sheet & glacier mass balance, and sea-level. It appears that they had never heard of it.
That amazes me. Any competent meteorologist could have told them all about lake/ocean-effect snowfall. It’s the reason Buffalo, New York famously gets so much snow. But the IPCC’s sea-level authors seem to have been unaware of it.
In both Greenland and Antarctica, snowfall is the most important factor affecting ice sheet mass balance, greater in magnitude than melting, sublimation, or iceberg calving. In fact, in Antarctica, snowfall accumulation is approximately equal to the sum of those other three factors.
Multiple studies have found that snowfall accumulation in Antarctica has been increasing.[1] [2] [3] [4]
The magnitude of ice accretion from snowfall on ice sheets was illustrated by the amazing story of Glacier Girl. She’s a Lockheed P-38 Lightning which was extracted in pieces from beneath 268 feet(!) of accumulated ice and snow (mostly ice), fifty years after she made an emergency landing on the Greenland Ice Sheet.
That’s more than 5 feet of ice per year, which is equivalent to more than seventy (70) feet of annual snowfall, which had piled up on top of the airplane! That snow represents evaporated water, mostly removed from the Arctic and North Atlantic Oceans, which then fell as ocean-effect snow on the Greenland Ice Sheet.
We know that some of the effects of global warming increase sea-level, and others decrease it. Forty years of experience tell us that those factors roughly cancel each other, meaning that there’s no reason to expect significantly accelerated sea-level rise from mankind’s GHG emissions.
www.sealevel.info