The Surprising Energy Math Behind U.S. Climate Policy Failure

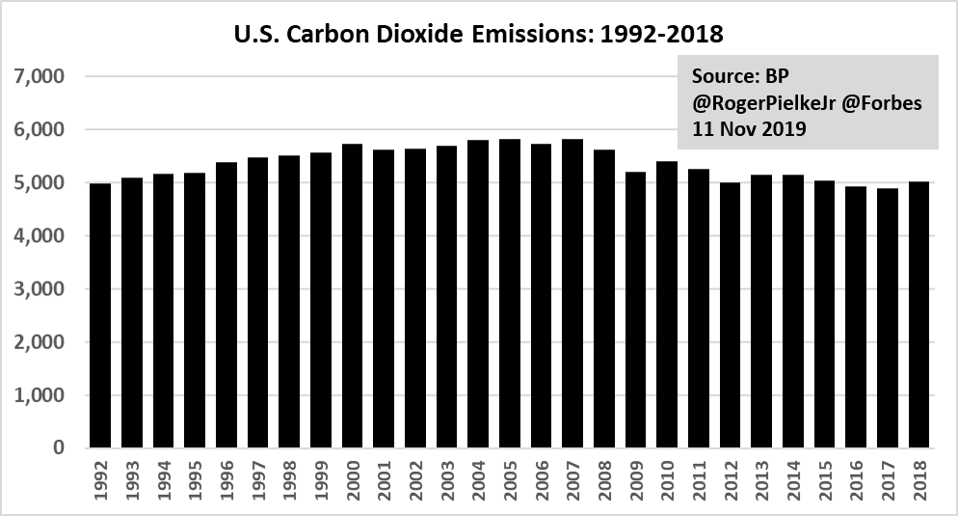
U.S. carbon dioxide emissions 1992 to 2018, source; BP.
ROGER PIELKE JR.
Let’s take a look at the numbers. From 2005 to 2018, the consumption of fossil fuels – coal, natural gas, petroleum – in the U.S. declined by about 100 million tonnes of oil equivalent (mtoe), totaling about 1,940 mtoe in 2018. All of this decline, and more, was due to the 2009 economic crisis, when fossil fuel consumption decreased by almost 120 mtoe in just one year. Since 2009 U.S. fossil fuel consumption has increased by about 70 mtoe.
Carbon-free energy has also increased in the U.S., from about 270 mtoe in 2005 to about 360 mtoe in 2018. All of this increase is due to increasing deployment of renewables such as wind and solar, while nuclear and hydro have remained more or less constant. The evidence indicates that none of the increase in renewables deployment has actually replaced any fossil fuel consumption.
U.S. fossil fuel consumption has continued to increase. In the decade following the 2009 financial crisis, carbon-free consumption increased by about 75 mtoe, but fossil fuel consumption also increased by about 75 mtoe. The notable addition of renewables to the U.S. energy mix has all been additive – it has not displaced any fossil fuels.
The figure below shows the carbon-free energy consumption in the U.S. from 1992 – the year of the Rio climate conference – through 2018. At 15.7% in 2018, the U.S. is slightly above the global average. To achieve net-zero carbon dioxide the world would need to get to close to 100% carbon-free energy consumption.
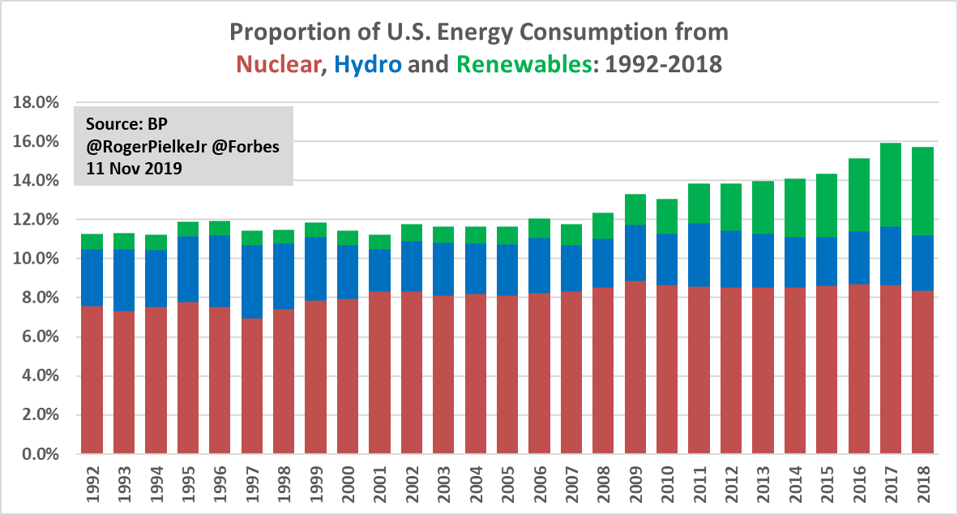
Proportion of U.S. energy consumption from nuclear, hydro and renewables, 1992 to 2018. Source: BP.
ROGER PIELKE JR.
Carbon dioxide emissions reductions in the United States since 2005 are largely the result of the displacement of coal, which is very carbon intensive, by natural gas. Consider that U.S. fossil fuel consumption was just about the same in 1999 and 2018, but carbon dioxide emissions were about 550 million metric tonnes more in 1999 than in 2018. This decrease represents the effects of natural gas displacing coal, but not any less reliance on fossil fuels.
The U.S. experience shows how a focus on emissions can mislead. Even though emissions dropped from 1999 to 2018, the U.S. is no closer to net-zero carbon dioxide because total fossil fuel consumption is unchanged.
During the Obama administration, fossil fuel consumption dropped by about 100 mtoe, while renewables increased by about 60 mtoe. It might have seemed that carbon-free energy displaced fossil fuels during this period, but again, the overwhelming factor influencing energy outcomes appears to be the 2009 financial crisis.
A more precise evaluation is possible by looking at decarbonization rates. Decarbonization refers to the rate of decline of the ratio of carbon dioxide emissions to GDP. We want GDP to go up and emissions to go down. So a decrease in this ratio is an indication of progress. The figure below shows annual U.S. decarbonization rates since 1992.
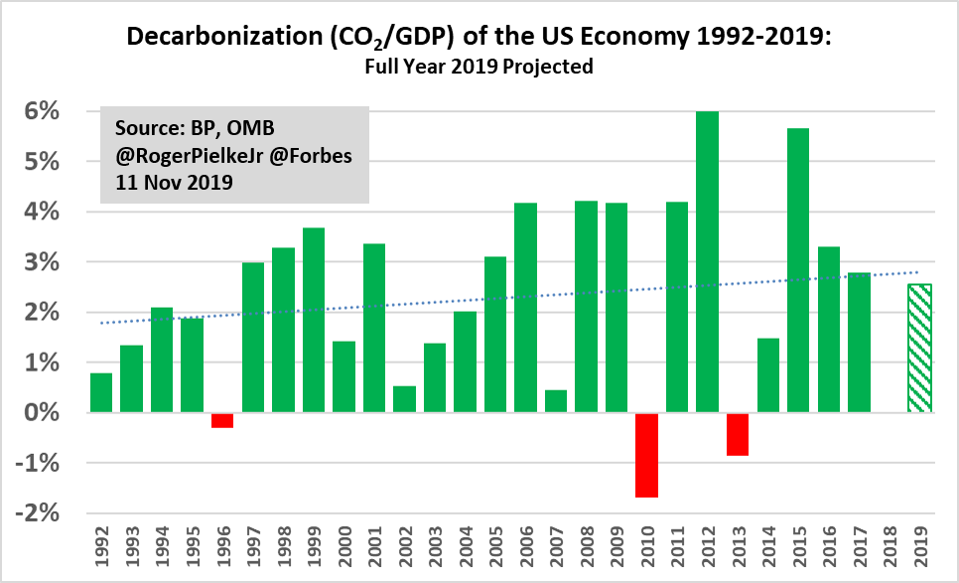
Decarbonization of the U.S. economy 1992 to 2018. Full year 2019 is projected based on estimates.
ROGER PIELKE JR.
The figure shows a modest increase in U.S. decarbonization rates over the past several decades. That is good news. However, the increase is far from what is needed. According to PwC, to hit a 1.5 or 2 degree Celsius temperature target would require annual global decarbonization rates of 7% to 11% or more.
The projected 2019 decarbonization rate of ~2.6% is slightly about the long-term historical average since 1992, and just below the average decarbonization rate of the Obama administration. So far, at least, presidents would appear to matter less to decarbonization than might be assumed.
The figure below shows decarbonization rates by president, since the Carter administration. The data show small differences between administrations, and none achieved decarbonization rates anywhere close to what would be needed to reduce emissions by 80% by 2050, much less net zero.
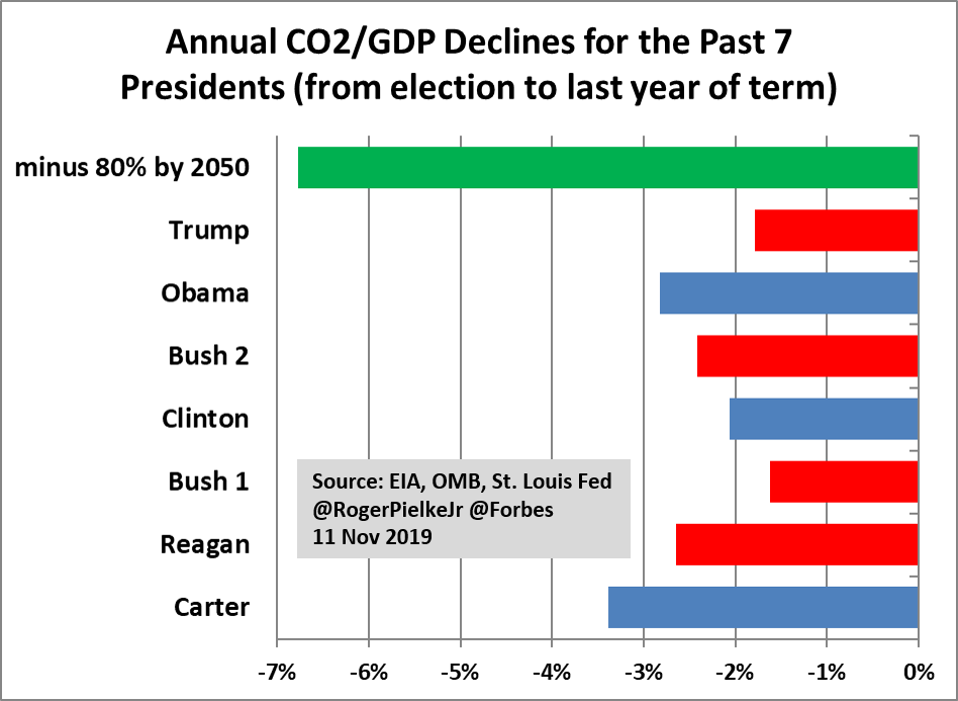
Decarbonization of the U.S. economy by president, Carter through Trump.
ROGER PIELKE JR.
The bottom line is that the reduction in U.S. carbon dioxide emissions, while notable, masks policy failure. The U.S. has achieved this reduction due to fuel switching among fossil fuels and the notable growth of renewable energy has been purely additive.
The U.S. has not yet begun its journey towards net-zero carbon dioxide, whether by 2050 or any other year. None of the proposals put forward by Democratic candidates for president are plausible. This battle has yet to be joined.