https://notalotofpeopleknowthat.wordpress.com/2019/03/23/borenstein-tries-the-daily-records-con/
Borenstein Tries The Daily Records Con
By Paul Homewood
Another remarkably dishonest and deceitful piece, even by Seth Borenstein standards. That it should be aided and abetted by NOAA is shameful:
Over the past 20 years, Americans have been twice as likely to sweat through record-breaking heat rather than shiver through record-setting cold, a new Associated Press data analysis shows.
The AP looked at 424 weather stations throughout the Lower 48 states that had consistent temperature records since 1920 and counted how many times daily hot temperature records were tied or broken and how many daily cold records were set. In a stable climate, the numbers should be roughly equal.
Since 1999, the ratio has been two warm records set or broken for every cold one. In 16 of the last 20 years, there have been more daily high temperature records than low.
The AP shared the data analysis with several climate and data scientists, who all said the conclusion was correct, consistent with scientific peer-reviewed literature and showed a clear sign of human-caused climate change. They pointed out that trends over decades are more robust than over single years.
The analysis stopped with data through 2018. However, the first two months of 2019 are showing twice as many cold records than hot ones. That’s temporary and trends are over years and decades, not months, said National Oceanic and Atmospheric Administration climate monitoring chief Deke Arndt.
“We are in a period of sustained and significant warming and — over the long run — will continue to explore and break the warm end of the spectrum much more than the cold end,” Arndt said.
Former Weather Channel meteorologist Guy Walton, who has been studying hot and cold extreme records since 2000, said the trend is unmistakable.
“You are getting more extremes,” Walton said. “Your chances for getting more dangerous extremes are going up with time.”
No place has seen the trend more clearly than the Southern California city of Pasadena, where 7,203 days (more than 19 years) went by between cold records being broken. On Feb. 23, Pasadena set a low temperature record, its first since June 5, 1999.
Vermont native Paul Wennberg felt it. He moved to Pasadena in 1998 just before the dearth of cold records.
“Even with the local cold we had this past month, it’s very noticeable,” said Wennberg, a California Institute of Technology atmospheric sciences professor. “It’s just been ever warmer.”
In between the two cold record days, Pasadena set 145 hot records. That includes an all-time high of 113 degrees last year.
“Last year was unbelievable here,” Wennberg said. “The tops of a lot of the hedges, they essentially melted.”
Scientists often talked about human-caused global warming in terms of average temperatures, but that’s not what costs money or sends people to the hospital. A study this month found that in just 22 states, about 36,000 people on average go to the hospital because of excessive summertime heat.
“The extremes affect our lives,” Arndt said, adding that they are expensive, with hospital stays, rising energy bills and crop losses.
National Center for Atmospheric Research climate scientist Gerald Meehl, who has published peer-reviewed papers on the rising hot-to-cold ratio, said people pay more attention to climate when records are broken.
The AP counted daily records across 424 stations starting in 1920 and ending in 2018. The AP only considered daily — not all-time — high maximum temperatures and low minimum temperatures and only used stations with minimal missing data. Temperatures that tied previous records were counted in addition to temperatures that broke previous records.
More typical than Pasadena is Wooster, Ohio. From 1999 on, Wooster saw 106 high temperature records set or broken and 51 cold ones. In the previous eight decades, the ratio was slightly colder than one to one.
At MW Robinson Co., people are lining up for air conditioning installation as the climate seems to get have been getting hotter over the years, said Lori Bowersock, who coordinates the firm’s HVAC installations.
“It’s more and more every year,” Bowersock said. “Usually we don’t have them lined up like this.”
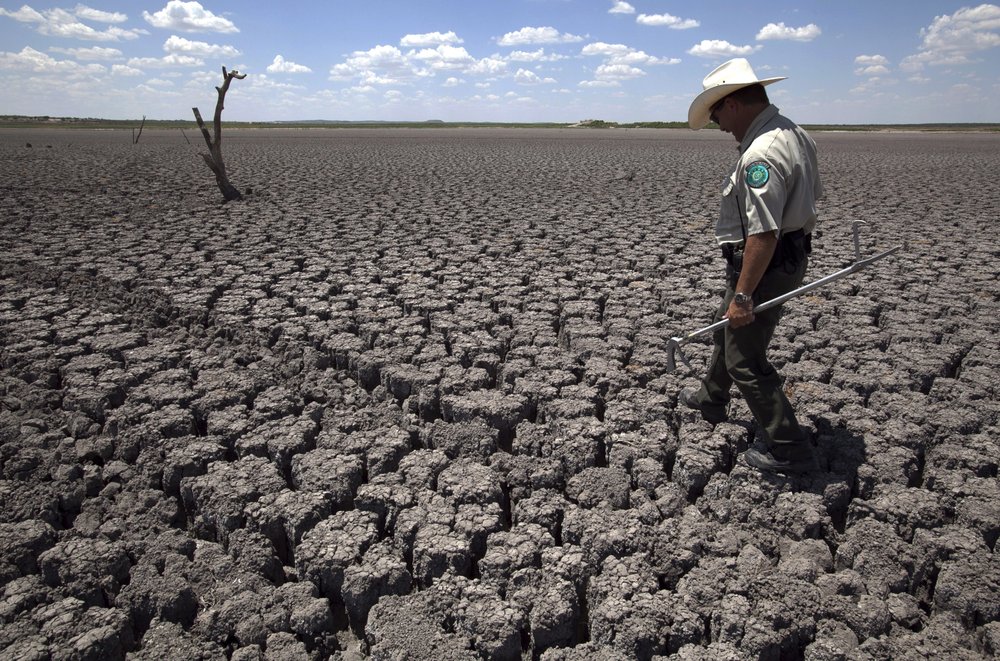
Texas State Park police officer Thomas Bigham walks across the cracked lake bed of O.C. Fisher Lake, in San Angelo, Texas, on Aug. 3, 2011. (AP Photo/Tony Gutierrez, File)
The AP’s other findings:
— Since Jan. 1, 1999, just under half the stations had at least twice as many hot records set than cold ones, including Wooster.
— In all, 87 percent of the weather stations had more hot records than cold since 1999. There have been 42 weather stations that have at least five hot records for every cold one since 1999, with 11 where the hot-to-cold ratio is 10-to-1 or higher, including Pasadena.
— All nine of NOAA’s climate regions have seen more hot records set than cold ones since 1999, with the West, Southwest and Northeast having a 3-to-1 ratio.
— All four seasons have had more hot records broken than cold for the same time period.
— Most decades in the 20th century had close to an even ratio of hot to cold. The 1930s, driven by Dust Bowl summers, had about 1.4 hot records for every cold. The 1960s and 1970s had about 1.5 cold records for every hot. The 21st century has a 1.9-to-1 hot-to-cold ratio.
“As a measure of climate change, the dailies (temperature records) will tell you more about what’s happening,” said climate scientist Chris Field of Stanford. “The impacts of climate change almost always come packaged in extremes.”


#
Paul Homewood responds:
I have highlighted in red some of the more misleading claims, but first let’s look at the graph:

Note that it starts in 1958. Why should that be? After all, the stations used in their analysis all have data going back to 1920.
What are they trying to hide?
Secondly they state “As time goes on, records become harder to set”. This would be true if ties were not included. But, as they also state, “The AP looked at 424 weather stations throughout the Lower 48 states that had consistent temperature records since 1920 and counted how many times daily hot temperature records were tied or broken and how many daily cold records were set.”
In other words, ties are included, and consequently records should, in theory, be evenly distributed throughout the time scale.
Given this, you can see straightaway that hot records have actually been declining since 1958. This, of course, rather destroys their argument that we are breaking the “warm end of the spectrum” more and more. All that we are seeing is that cold records have become much less common.
They present Wooster, OH as a good example.
So let’s look at the full record there, which actually goes back to 1893.
The CLIMOD2 climate tool supported by NOAA gives temperature records for each day of the year.

http://climod2.nrcc.cornell.edu/
Using this database, I have graphed both the daily highs and lows:


The reason why AP decided to hide the data prior to 1958 becomes immediately obvious. Hot records were far more common not only in the 1930s, but 1950s as well.
We also see far fewer cold records since around 1990. It is that lack of cold records which has skewed the ratio of hot/cold, and not an increase in the hot ones.
We can see this more clearly if we combine both on the same graph:

According to Guy Walton:
“You are getting more extremes. Your chances for getting more dangerous extremes are going up with time.”
In fact, the opposite is true. The number of extremes, hot and cold added together, have been getting fewer in recent years.

These are, of course, daily records for the whole year, but what about summertime itself? What about that “record breaking heat”, or all of those air cons the good folks of Wooster are buying, as the climate seems to get have been getting hotter over the years,
It turns out that there is no evidence of this either, at Wooster at least.
The chart below the highest temperature recorded each year, and we can see that were routinely much higher in the past. The second chart gives the number of days each year above 90C, and shows a similar pattern.
What does stand out in the latter is the run of cool summers in the 1960s and 70s.


http://climod2.nrcc.cornell.edu/
Maybe Wooster is not representative of the rest of the country, so let’s look at the other example used, Pasadena.
The first thing to note is that the weather station there is slap in the middle of the city with a population of 142,000. It is surrounded by large buildings and close to roads.
Certainly not a proper site to measure climate trends at!

https://www.ncdc.noaa.gov/homr/#ncdcstnid=10100112&tab=LOCATIONS
But even there, we find no evidence that summers are more “sweltering”:


Borenstein claims that we are seeing more and more “record breaking heat” and “more extremes”.
The opposite is true. Hot records are less common than in the past, and cold records have become even rarer. As a result, we are seeing a reduction in extreme temperatures.
FOOTNOTE
Tony Heller has also done his usual demolition job on the Borenstein report.
He has plotted daily records at all USHCN sites, and comes up with very similar results to the Wooster analysis, both on an annual basis and during summer:
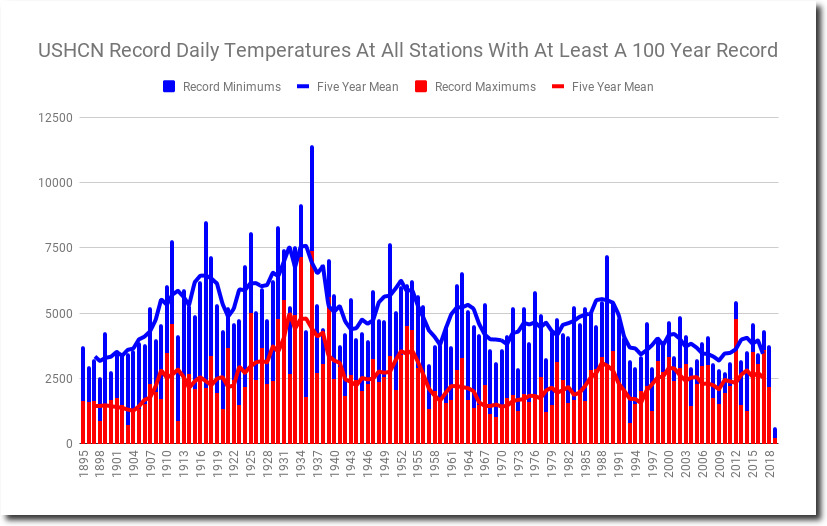
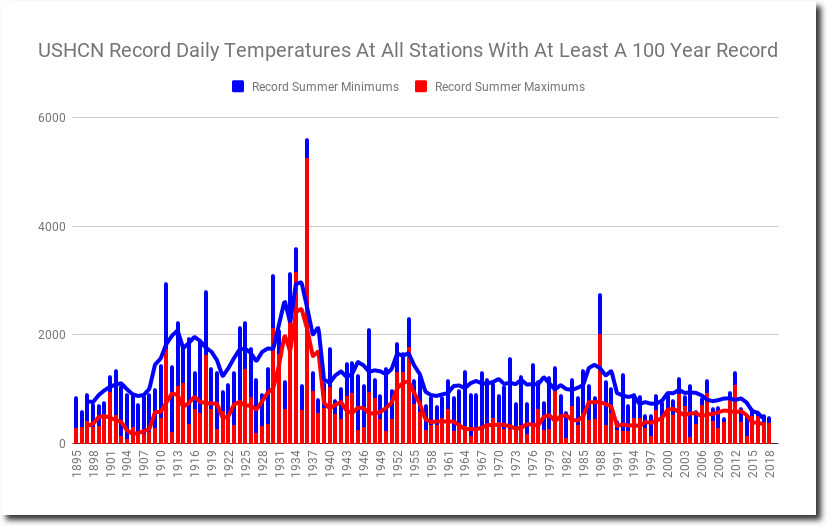
Tony’s post is well worth a read here.