
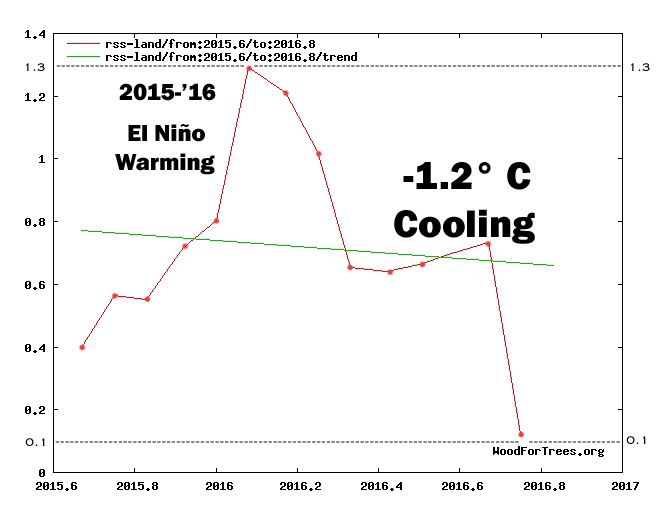
Satellites Show -1.2° C Temperature Drop Since Early 2016 As Scientists Project Low Solar Activity, Cooling In Coming Decades
By – The most recent Super El Niño natural warming event exerted its maximum effect on surface temperature anomalies during the last few months of 2015 and the first few months of 2016. Since then, surface temperatures over land have dramatically declined by about 1.2° C according to the RSS satellite dataset.
#
Background on ‘Gore Effect’:

Man Unicycles Across Canada for Global Warming During Record-Breaking Cool Summer
British Antarctic Survey trapped without power during record cold -55.4° C
Al Gore’s climate-changers at EPA hearings foiled by cool temperatures
EPA forced to move climate hearings on coal plant restrictions due to ‘large scale power outage’ – EPA’s own version of ‘Gore Effect’?
#
Background on “Hottest Year” claims:
Global temperatures have been holding nearly steady for almost two decades (nearly 18 years, according to RSS satellite data). While 2005, 2010, and 2015 were declared the ‘hottest years’ by global warming proponents, a closer examination revealed that the claims were “based on year-to-year temperature data that differs by only a few HUNDREDTHS of a degree to tenths of a degree Fahrenheit – differences that were within the margin of error in the data.” In other words, global temperatures have essentially held very steady with no sign of acceleration.
The media and climate activists hype ‘record’ temperatures that are not even outside the margin of error of the dataset as somehow meaningful. Even former NASA climatologist James Hansen admitted ‘hottest year’ declarations are “not particularly important.”
MIT climate scientist Dr. Richard Lindzen ridiculed ‘hottest year’ claims in 2015. “The uncertainty here is tenths of a degree. When someone points to this and says this is the warmest temperature on record, what are they talking about? It’s just nonsense. This is a very tiny change period,” Lindzen said. “If you can adjust temperatures to 2/10ths of a degree, it means it wasn’t certain to 2/10ths of a degree.” 11 So-called ‘hottest year’ claims are just a fancy way of saying that the ‘global warming pause’ has essentially continued.
Analysis: 2016 ‘Hottest Year Evah Nonsense’ From Media: ‘Satellite data shows no such thing at all’
Meanwhile, climate models continue to predict too much warming. See: Climatologist Dr. Pat Michaels: ‘When Will Climate Scientists Say They Were Wrong?’
#
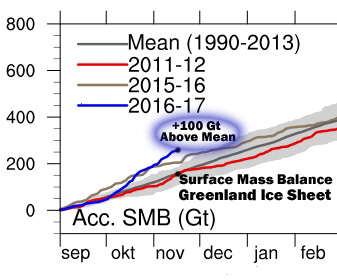
Greenland Gaining Ice:
Since September 2016, the Greenland Ice Sheet surface mass balance has risen +100 Gt above the 1990-2013 average:
According to an increasing body of scientific evidence, short-term cooling and ice sheet growth trends like the ones shown above may soon become long-term trends in the coming decades. As shown recently, there have already been 18 scientific papers published in 2016 indicating that periods with high solar activity (i.e., the 20th/21st century Modern Maximum, the 11th century Medieval Maximum) are associated with centennial-scale warming trends, and periods with low solar activity (the 13th to 19th century Little Ice Age) are associated with centennial-scale cooling trends.
Within the last year and a half, there have also been many other papers published in scientific journals indicating that the Earth’s Modern Grand Maximum of high solar activity (which lasted from the early- to mid-20th century to the early 21st century) has recently come to an end, and will soon be replaced by several decades of low solar activity and the concomitant decline in temperatures reaching levels not seen since the Little Ice Age.
Listed below are 10 recently-published scientific papers projecting solar activity minimums and “deep cooling” in the coming decades, especially beginning by about 2030. These papers would appear to run counter to the viewpoint that the coming decades will be characterized by unprecedented global warming that is dangerous and irreversible unless humans reduce or eliminate their consumption of fossil-fuel energies.
“The quasi-centennial epoch of the new Little Ice Age has started at the end 2015 after the maximum phase of solar cycle 24. The start of a solar grand minimum is anticipated in solar cycle 27 ± 1 in 2043 ± 11 and the beginning of phase of deep cooling in the new Little Ice Age in 2060 ± 11. The gradual weakening of the Gulf Stream leads to stronger cooling in the zone of its action in western Europe and the eastern parts of the United States and Canada. Quasi-bicentennial cyclic variations of TSI together with successive very important influences of the causal feedback effects are the main fundamental causes of corresponding alternations in climate variation from warming to the Little Ice Age.”
“In 1890´s G. Spörer and E. W. Maunder (1890) reported that the solar activity stopped in a period of 70 years from 1645 to 1715. Later a reconstruction of the solar activity confirms the grand minima Maunder (1640-1720), Spörer (1390-1550), Wolf (1270-1340), and the minima Oort (1010-1070) and Dalton (1785-1810) since the year 1000 A.D. (Usoskin et al. 2007). These minimum periods have been associated with less irradiation from the Sun and cold climate periods on Earth. An identification of a three grand Maunder type periods and two Dalton type periods in a period thousand years, indicates that sooner or later there will be a colder climate on Earth from a new Maunder- or Dalton- type period. …. The result shows that the TSI variability and the sunspots variability have deterministic oscillations, controlled by the large planets Jupiter, Uranus and Neptune, as the first cause. A deterministic model of TSI [total solar irradiance] variability and sunspot variability confirms the known minimum and grand minimum periods since 1000. From this deterministic model we may expect a new Maunder type sunspot minimum period from about 2018 to 2055. The deterministic model of a TSI ACRIM data series from 1700 computes a new Maunder type grand minimum period from 2015 to 2071. A model of the longer TSI ACRIM data series from 1000 computes a new Dalton to Maunder type minimum irradiation period from 2047 to 2068.”
“Conclusions Based on our results, we propose the use of the Wolf’s Number Oscillation Index (WNOI) – as a more uniform alternative to the ONI – in the range over 30 and below -30. The analysis of the material presented and the arguments discussed allows us to define a possible relationship between phenomena related to Solar Cycle, the ENSO, climatic conditions, as well as some criteria for the establishment of public policies for preservation and remediation of the environment in the long run. We can conclude that solar activity oscillations impact the earth climatic conditions to such a extent that they become measurable only in the long run. The magnitude of the Solar Cycle – from 7 to 17 and a mean of 11.2 years – seems to support this statement. Based on the similarities of the Solar Cycles 5 and 24 we can expect a longer period of cold weather for the years 2022 y/o 2034, corresponding to the Solar Cycles 24 and 25.”
“Solar variability represents a source of uncertainty in the future forcings used in climate model simulations. Current knowledge indicates that a descent of solar activity into an extended minimum state is a possible scenario. With aid of experiments from a state-of-the-art Earth system model, we investigate the impact of a future solar minimum on Northern Hemisphere climate change projections. This scenario is constructed from recent 11 year solar-cycle minima of the solar spectral irradiance, and is therefore more conservative than the ‘grand’ minima employed in some previous modeling studies. Despite the small reduction in total solar irradiance (0.36 W m−2), relatively large responses emerge in the winter Northern Hemisphere, with a reduction in regional-scale projected warming by up to 40%. To identify the origin of the enhanced regional signals, we assess the role of the different mechanisms by performing additional experiments forced only by irradiance changes at different wavelengths of the solar spectrum. We find that a reduction in visible irradiance drives changes in the stationary wave pattern of the North Pacific and sea–ice cover. A decrease in UV irradiance leads to smaller surface signals, although its regional effects are not negligible. These results point to a distinct but additive role of UV and visible irradiance in the Earth’s climate, and stress the need to account for solar forcing as a source of uncertainty in regional scale projections.”
“This empirical modeling of solar recurrent patterns has also provided a consequent multi-millennial-scale experimental forecast, suggesting a solar decreasing trend toward grand (super) minimum conditions for the upcoming period, AD 2050–2250 (AD 3750–4450). … Solar activity (SA) has non-linear characteristics that influence multiple scales in solar processes (Vlahos and Georgoulis, 2004). For instance, millennia-scale solar oscillations have been recently detected, like those of about 6000 and 2400 years, by Xapsos and Burke (2009) and Charvátová (2000), respectively, with important and interesting influences in the near, past and future climate. These millennialscale patterns of reconstructed SA variability could justify epochs of low activity, such as the Maunder minimum, as well as epochs of enhanced activity, such as the current Modern Maximum, and the Medieval maximum in the 12th century. … We can conclude that the evidence provided is sufficient to justify a complete updating and reviewing of present climate models to better consider these detected natural recurrences and lags in solar processes.“
“By about 2030-2040, the Sun will experience a new grand solar minimum. This is evident from multiple studies of quite different characteristics: the phasing of sunspot cycles, the cyclic observations of North Atlantic behaviour over the past millennium, the cyclic pattern of cosmogenic radionuclides in natural terrestrial archives, the motions of the Sun with respect to the centre of mass, the planetary spin-orbit coupling, the planetary conjunction history and the general planetary-solar-terrestrial interaction. During the previous grand solar minima—i.e. the Sporer Minimum (ca 1440-1460), the Maunder Minimum (ca 1687-1703) and the Dalton Minimum (ca 1809-1821)—the climatic conditions deteriorated into Little Ice Age periods.”
“Solar activity (SA) has non-linear characteristics that influence multiple scales in solar processes (Vlahos and Georgoulis, 2004). For instance, millennia-scale solar oscillations have been recently detected, like those of about 6000 and 2400 years, by Xapsos and Burke (2009) and Charvátová (2000), respectively, with important and interesting influences in the near past and future climate. These millennial-scale patterns of reconstructed solar activity variability could justify epochs of low activity, such as the Maunder Minimum, as well as epochs of enhanced activity, such as the current Modern Maximum, and the Medieval Maximum in the 12th century. Although the reason for these solar activity oscillations is unclear, it has been proposed that they are due to chaotic behavior of non-linear dynamo equations (Ruzmaikin, 1983), or stochastic instabilities forcing the solar dynamo, leading to on-off intermittency (Schmittet al., 1996), or planetary gravitational forcing with recurrent multi-decadal, multi-centennial and longer patterns (Fairbridge and Sanders, 1987; Fairbridge and Shirley,1987; Charvátová, 2000; Duhau and Jager, 2010; Perry and Hsu, 2000). It should be noted that all proponents of planetary forcing have forecasted a solar Grand Minimum for the upcoming decades, but one of them has also forecasted a Super Minimum for the next centuries (Perry and Hsu, 2000). In addition, during recent decades, statistical forecasts (with physically-based spectral information of reconstructed records) of solar magnetic activity predict a clear decrease in solar activity, reaching a minimum around AD 2100(Steinhilber et al., 2013; S13, hereafter, Velasco et al., 2015).”
A new model of the Sun’s solar cycle is producing unprecedentedly accurate predictions of irregularities within the Sun’s 11-year heartbeat. The model draws on dynamo effects in two layers of the Sun, one close to the surface and one deep within its convection zone. Predictions from the model suggest that solar activity will fall by 60 per cent during the 2030s to conditions last seen during the ‘mini ice age’ that began in 1645.
Results will be presented today by Prof Valentina Zharkova at the National Astronomy Meeting in Llandudno. … Zharkova and her colleagues derived their model using a technique called ‘principal component analysis’ of the magnetic field observations from the Wilcox Solar Observatory in California. They examined three solar cycles-worth of magnetic field activity, covering the period from 1976-2008. In addition, they compared their predictions to average sunspot numbers, another strong marker of solar activity. All the predictions and observations were closely matched. “Combining both waves together and comparing to real data for the current solar cycle, we found that our predictions showed an accuracy of 97%,” said Zharkova.
“Effectively, when the waves are approximately in phase, they can show strong interaction, or resonance, and we have strong solar activity. When they are out of phase, we have solar minimums. When there is full phase separation, we have the conditions last seen during the Maunder minimum, 370 years ago.”
“The Earth’s climate shows a rather regular oscillation of ∼ 200 year period during the last millennia. However, frequency, phase, and strength of the oscillation are found to vary in different time series of temperatures and for different times (see Figs. 4–6, and 5 8). Nonetheless, the relative historic stability of the cycle suggests that the periodic nature of the climate will persist also for the foreseeable future. Disregarding other conceivable forcings e.g. anthropogenic influences, an approximate prediction of the climate for the next 100 years suggests itself. Figure 9 shows the Tsine representation from AD 1800 to AD 2100 derived from the ∆Tsine representation by a π/2 phase shift. 10 It gives correctly the 1850–1900 temperature minimum and shows a temperature drop from present to ∼ AD 2080, the latter comparable with the minimum of 1870, as already predicted in the studies (Steinhilber and Beer, 2013; Liu et al., 2011) on the grounds of solar activity data alone.”
“The estimation of solar activity for the next hundred years is one of the current problems in solar physics because the possible occurrence of a future grand solar minimum will probably have an impact on the Earth’s climate. … Depending on the composite used, PMOD (or ACRIM), we found a grand minimum for the 21st century, starting in ∼2004 (or 2002) and ending in ∼2075 (or 2063), with an average irradiance of 1365.5 (or 1360.5) Wm-2±1σ=0.3 (or 0.9) Wm-2. Moreover, we calculated an average radiative forcing between the present and the 21st century minima of ∼-0.1 (or −0.2) Wm-2, with an uncertainty range of-0.04 to -0.14 (or -0.12 to -0.33) Wm-2.”
– See more at: http://notrickszone.com/2016/11/17/satellites-show-1-2-c-temperature-drop-since-early-2016-as-scientists-project-low-solar-activity-cooling-in-coming-decades/#sthash.zFTpptNd.dfF24zK6.dpuf


