Special to Climate Depot
Via: https://kenskingdom.wordpress.com/2016/04/02/the-pause-update-march-2016-preliminary/
The Pause Update: March 2016 (Preliminary)
Well my last post certainly stirred up some Global Warming Enthusiasts who found it difficult to get their heads around the continued existence of The Pause. What will they make of this month’s update? The Pause refuses to go away, despite greatly exaggerated rumours of its death.
Dr Roy Spencer has just released UAH v6.0 data for March. This is a preliminary post with graphs only for the Globe, the Northern Hemisphere, the Southern Hemisphere, and the Tropics. Other regions will be updated in a few days’ time when the full data for March are released. (These preliminary figures may change slightly as well.)
These graphs show the furthest back one can go to show a zero or negative trend (less than +0.1C/ 100 years) in lower tropospheric temperatures. I calculate 12 month running means to remove the small possibility of seasonal autocorrelation in the monthly anomalies. Note: The satellite record commences in December 1978- now 37 years and 4 months long- 448 months. 12 month running means commence in November 1979. The graphs below start in December 1978, so the vertical gridlines denote Decembers. The final plotted points are March 2016.
Except for the Tropics, where The Pause has reduced by three months, in other regions it has remained at the same length.
[CLICK ON IMAGES TO ENLARGE]
Globe:
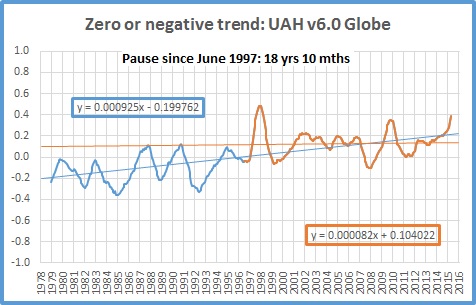
Sorry, GWEs, The Pause is still an embarrassing reality! For how much longer we don’t know.
And, for the special benefit of those who think that I am deliberately fudging data by using 12 month running means, here is the plot of monthly anomalies, which shows that The Pause is over in monthly anomalies by my rather strict criterion:
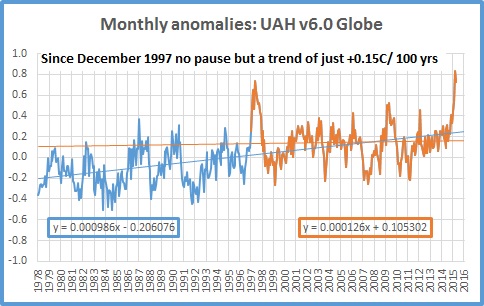
I will continue posting these figures showing these scarey trends from monthly anomalies. The Pause will return sooner with monthly anomalies than 12 month means of course. Meanwhile, shudder at the thought of 18 years and 4 months with a frightening trend of +0.15C +/-0.1C per 100 years.
Northern Hemisphere:
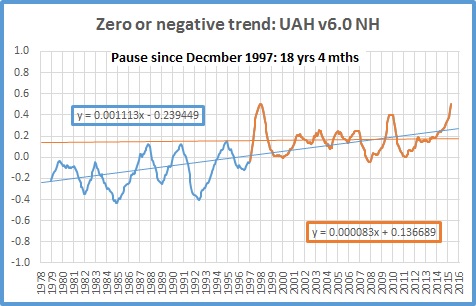
The Northern Hemisphere Pause refuses to go quietly and remains at nearly half the record. It may well disappear in the next month or two.
Southern Hemisphere:
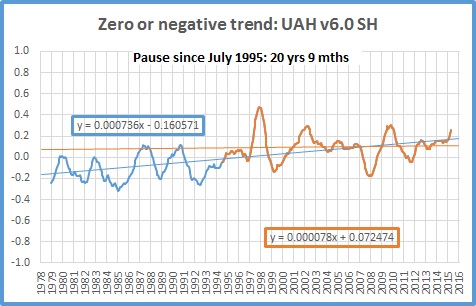
For well over half the record the Southern Hemisphere has zero trend.
Tropics:
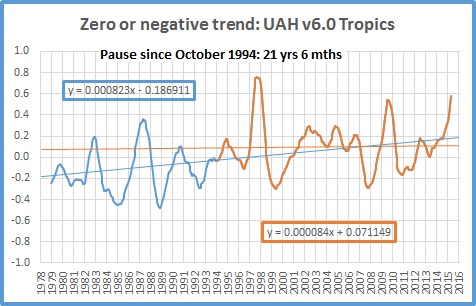
The Pause has shortened by three months, but is still well over half the record long.